Cyclical investing - case studies

Economy moves in cycles, Ray Dalio explains this beautifully in this 30 minute video. Dalio explains cycle using three factors:

  • Productivity growth: This matters over the long term where more productive elements of the economy go ahead of their peers over a long period of time. Productivity growth doesn’t vary a lot over time, hence not causing swift economic swings over short term.
  • Short and long term debt debt cycle: The amount of credit (or borrowing) in the economy is much larger than the amount of money in the economy, which causes huge economic swings. The short term debt cycle generally takes place over 5-8 years and is largely controlled by changes in interest rates made by the central bank. When the short term debt cycles keep on going for a long period of time (over decades), the overall debt in the economy increases to such an extent that a large part of income is made to simply service the interest payment, implying lower spending in the economy. The long term credit cycle generally takes place over 75-100 years. At the end of a long term credit cycle, there is cut in spending, reduction in debt (through defaults or restructing), wealth redistribution (via higher taxes from rich or inflation) and printing of money (leading to inflation in asset prices).

This picture from the above video summarizes everything very well (straight line is productivity growth)

Credit influences infrastructure and real estate sectors disproportionately as both these are largely funded on credit. I will illustrate this with the Indian real-estate sector.

The Indian real-estate sector went through a major boom in the early 1990s on back of large credit growth, with oustanding housing loans rising from 0.7% in 1989 to 2% in 1998 of total outstanding loans (see fig1, link). This was because Housing Finance Companies (HFCs) grew at a breakneck speed, with their market share rising from 28% in 1989 to 68% in 1998 (see fig2). This boom turned into a major bust, with very low housing sector growth until 2003, on back of HFCs losing market share. Its interesting to see that housing credit growth started around 2000, but the real-estate companies only saw growth coming back in 2004 (on basis of concall from Ashiana housing shown in fig3). The rapid credit growth in early 2000s led to housing loan market share rising from 2% in 2000 to 7.3% in 2008. This time around, it was the banks which gave out loans with their market share increasing from 35% in 2000 to 71% in 2008. Again, housing loan as a percentage of total outstanding loans went down to 6.7% in 2013 after which we saw another real-estate collapse. However, since then housing loan as a % of outstanding loans have gone up to 9.4% in FY19.


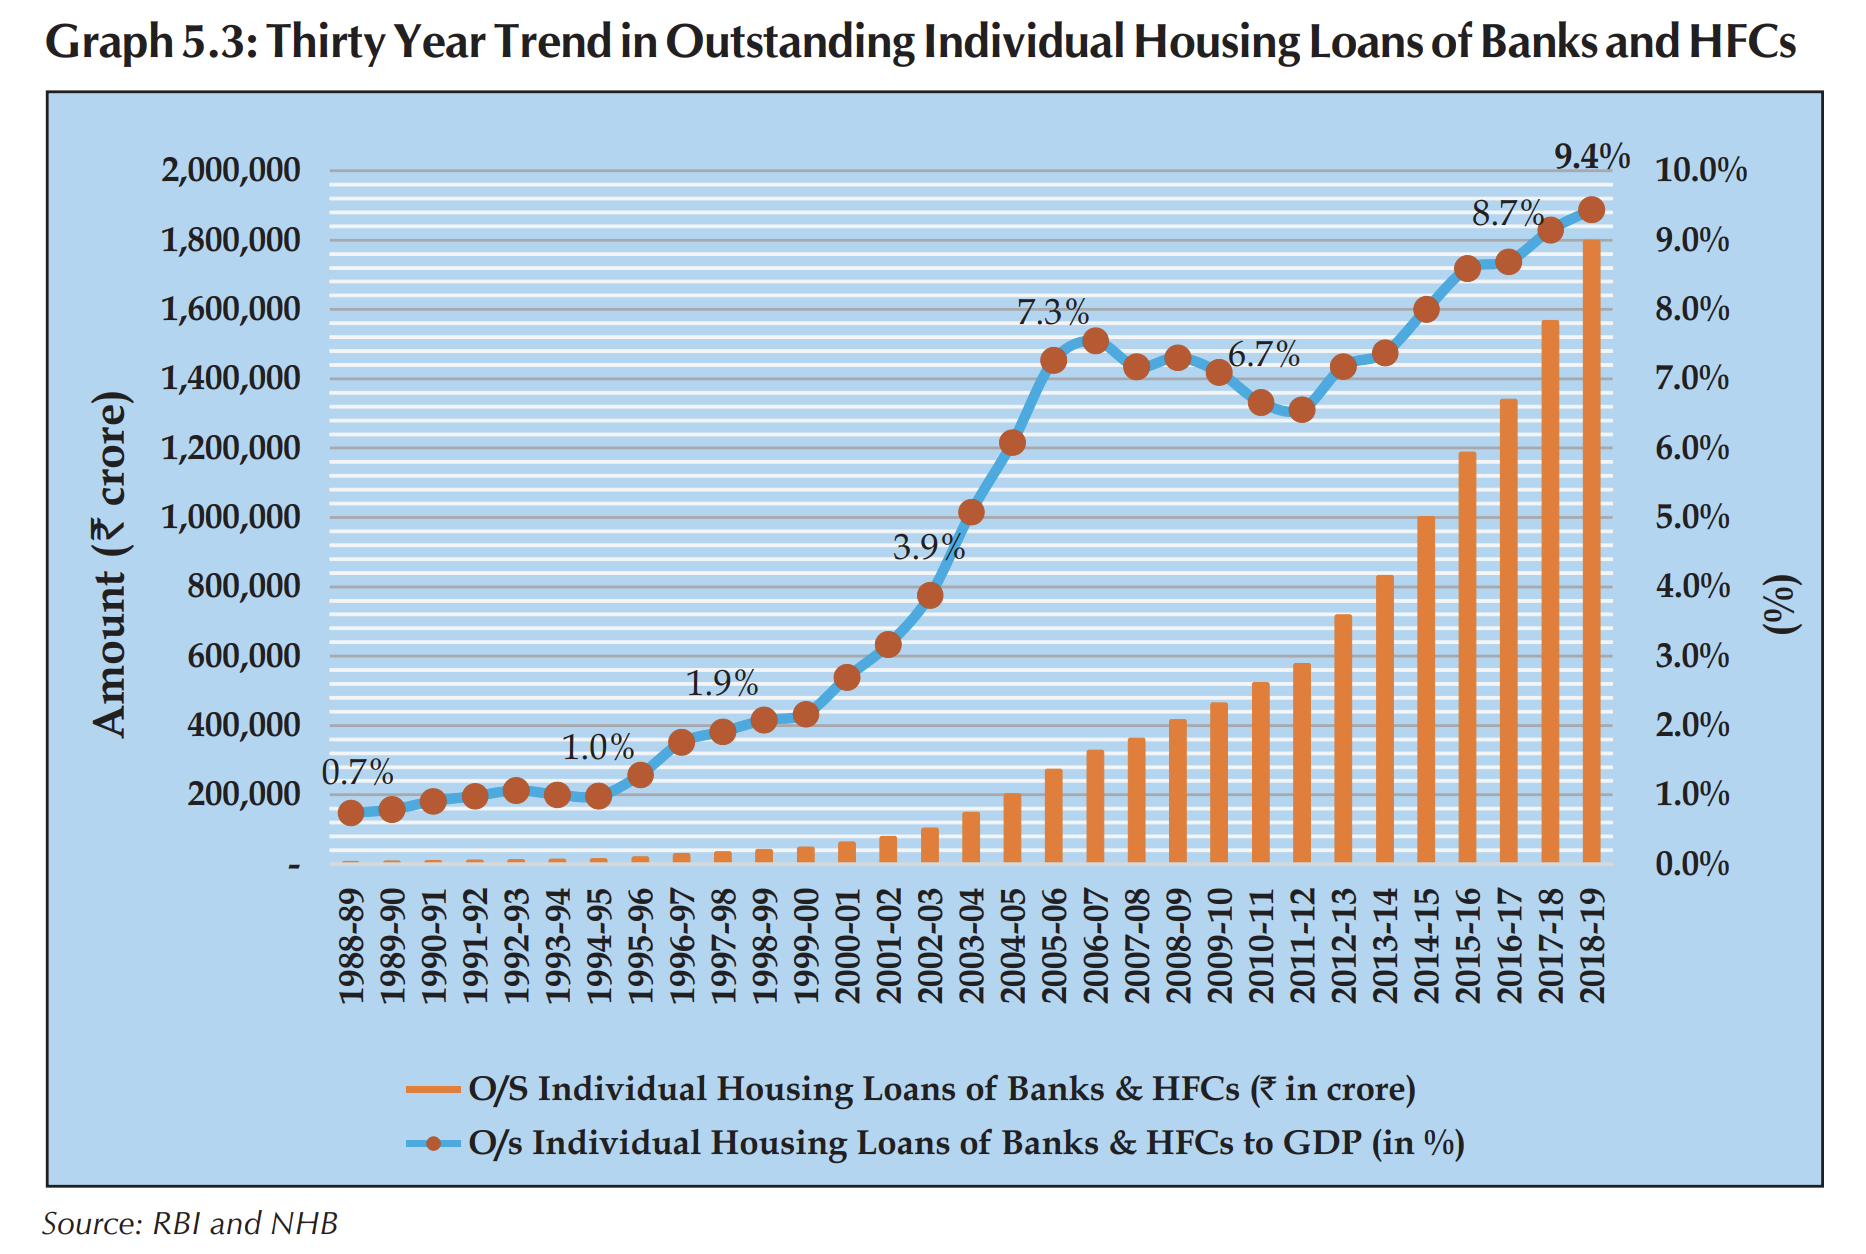
Fig1. Housing loans as a fraction of total outstanding loans given by banks and HFCs (link)


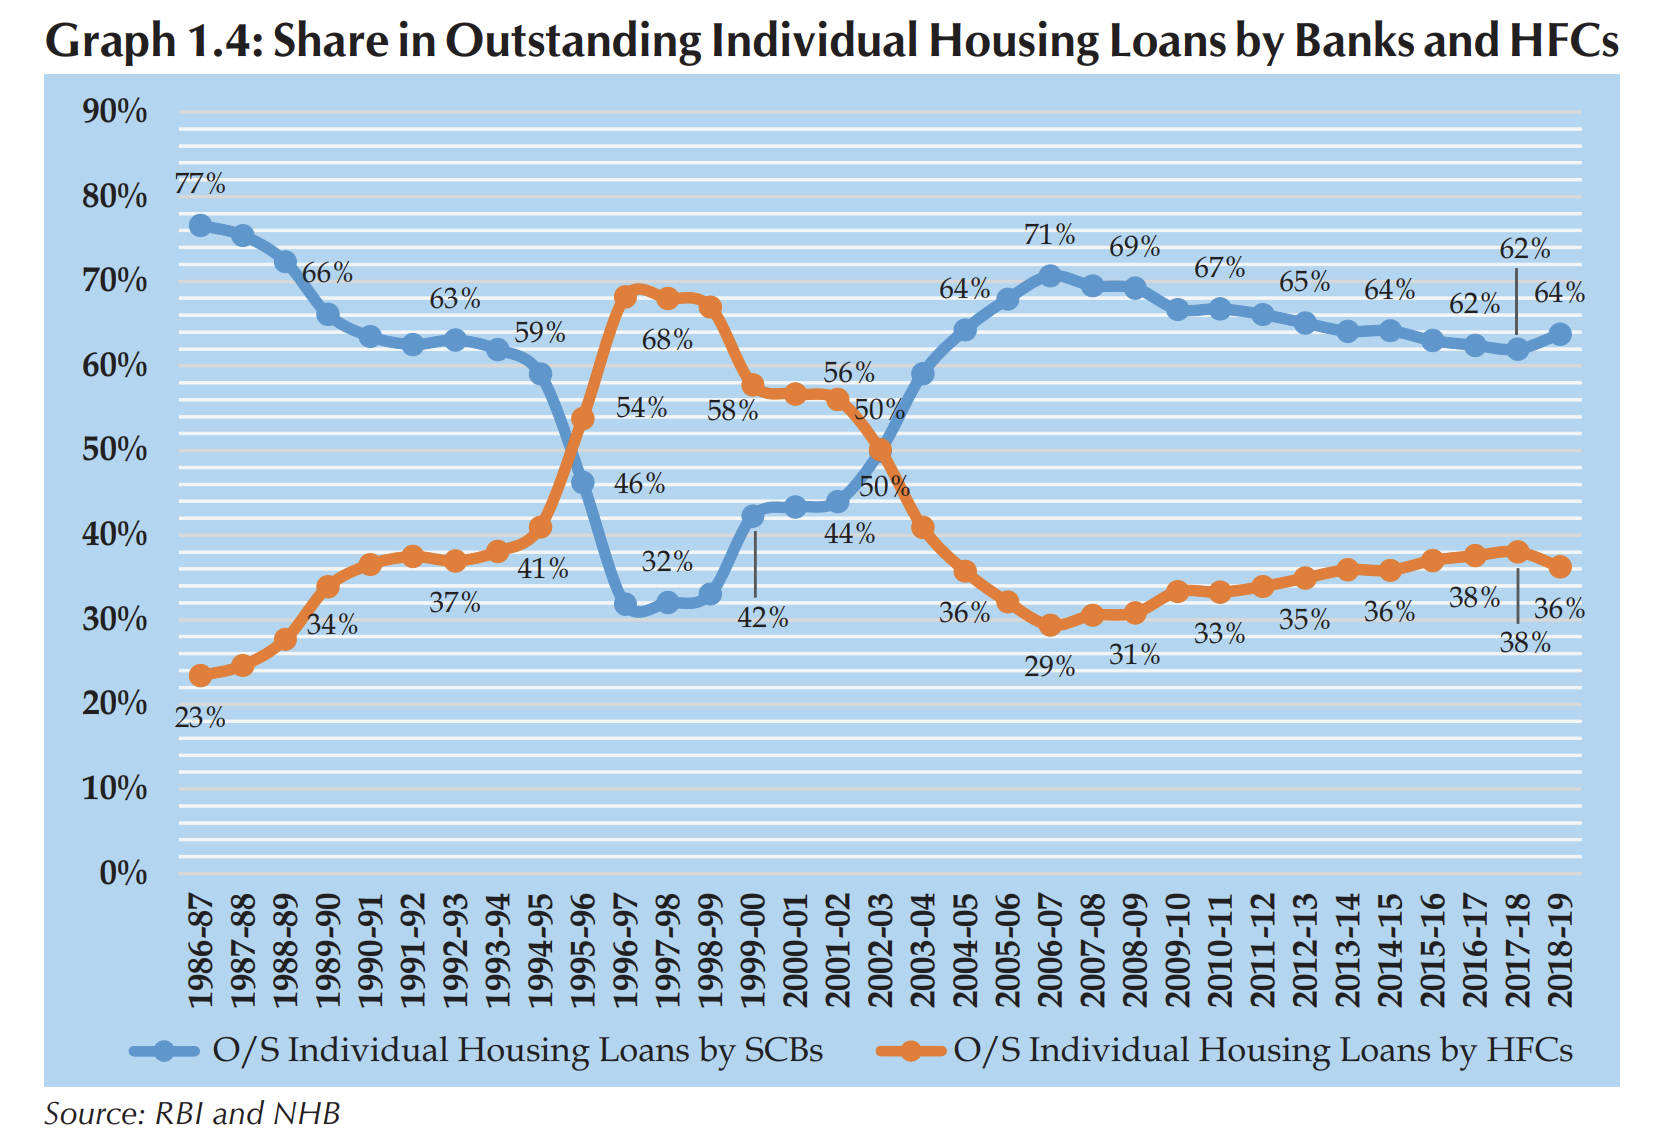
Fig2. Housing loan market share between HFCs and banks (link)


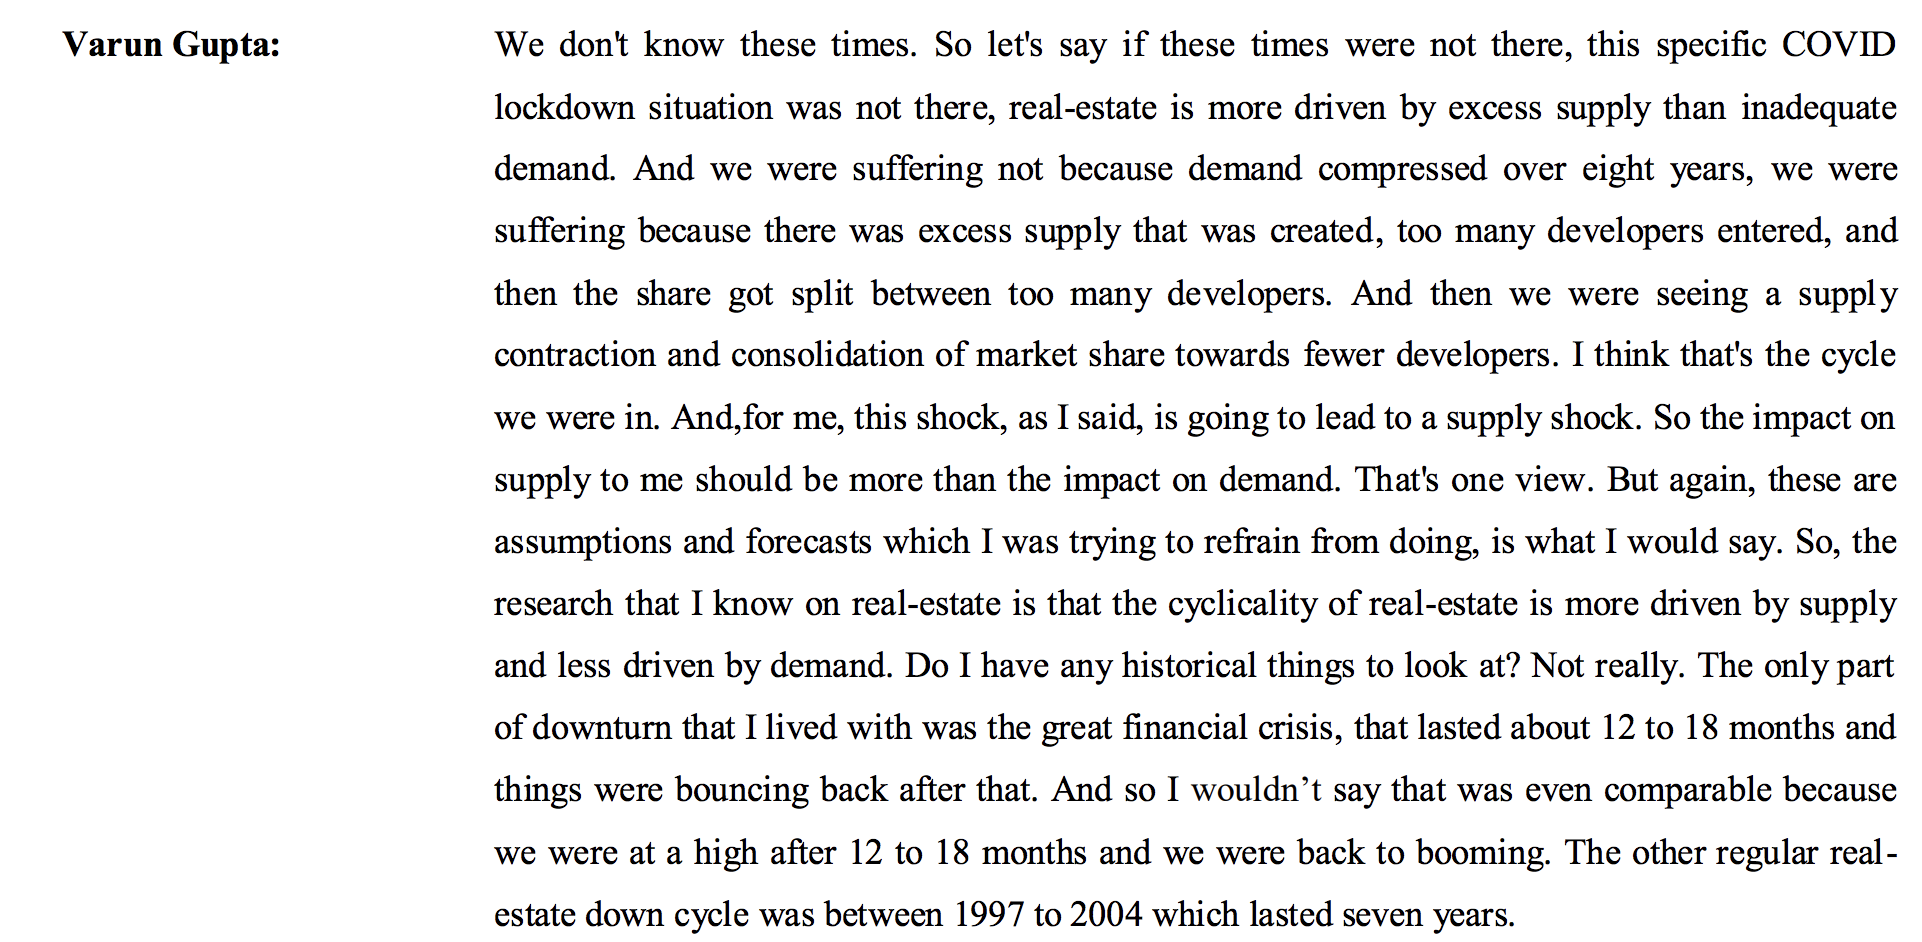
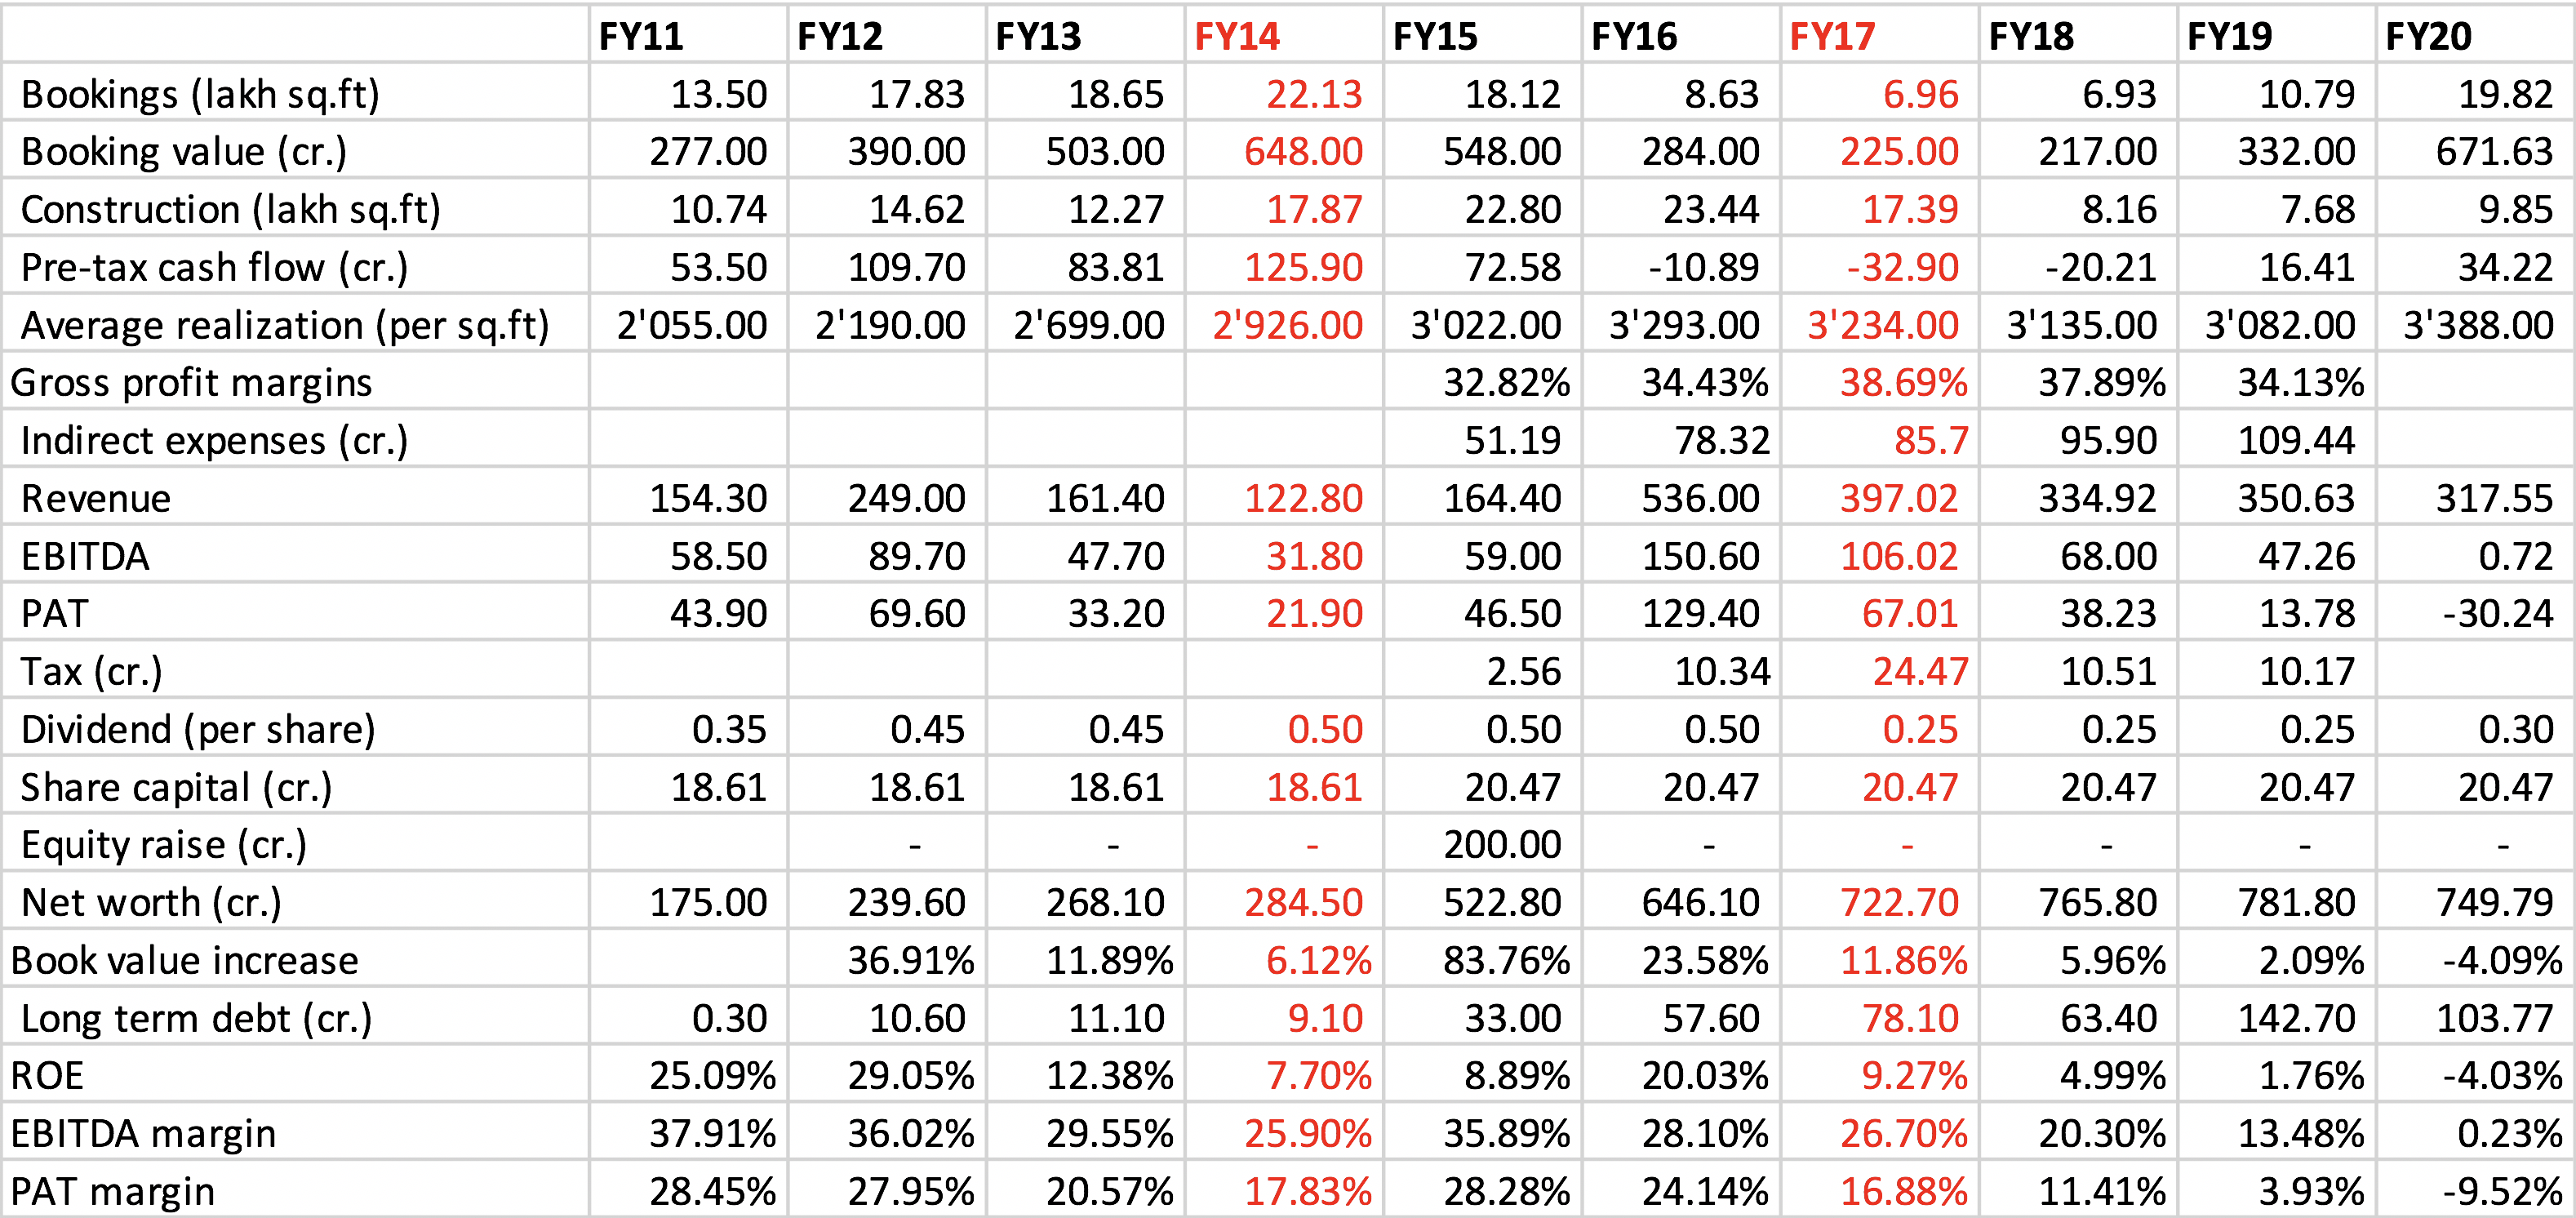
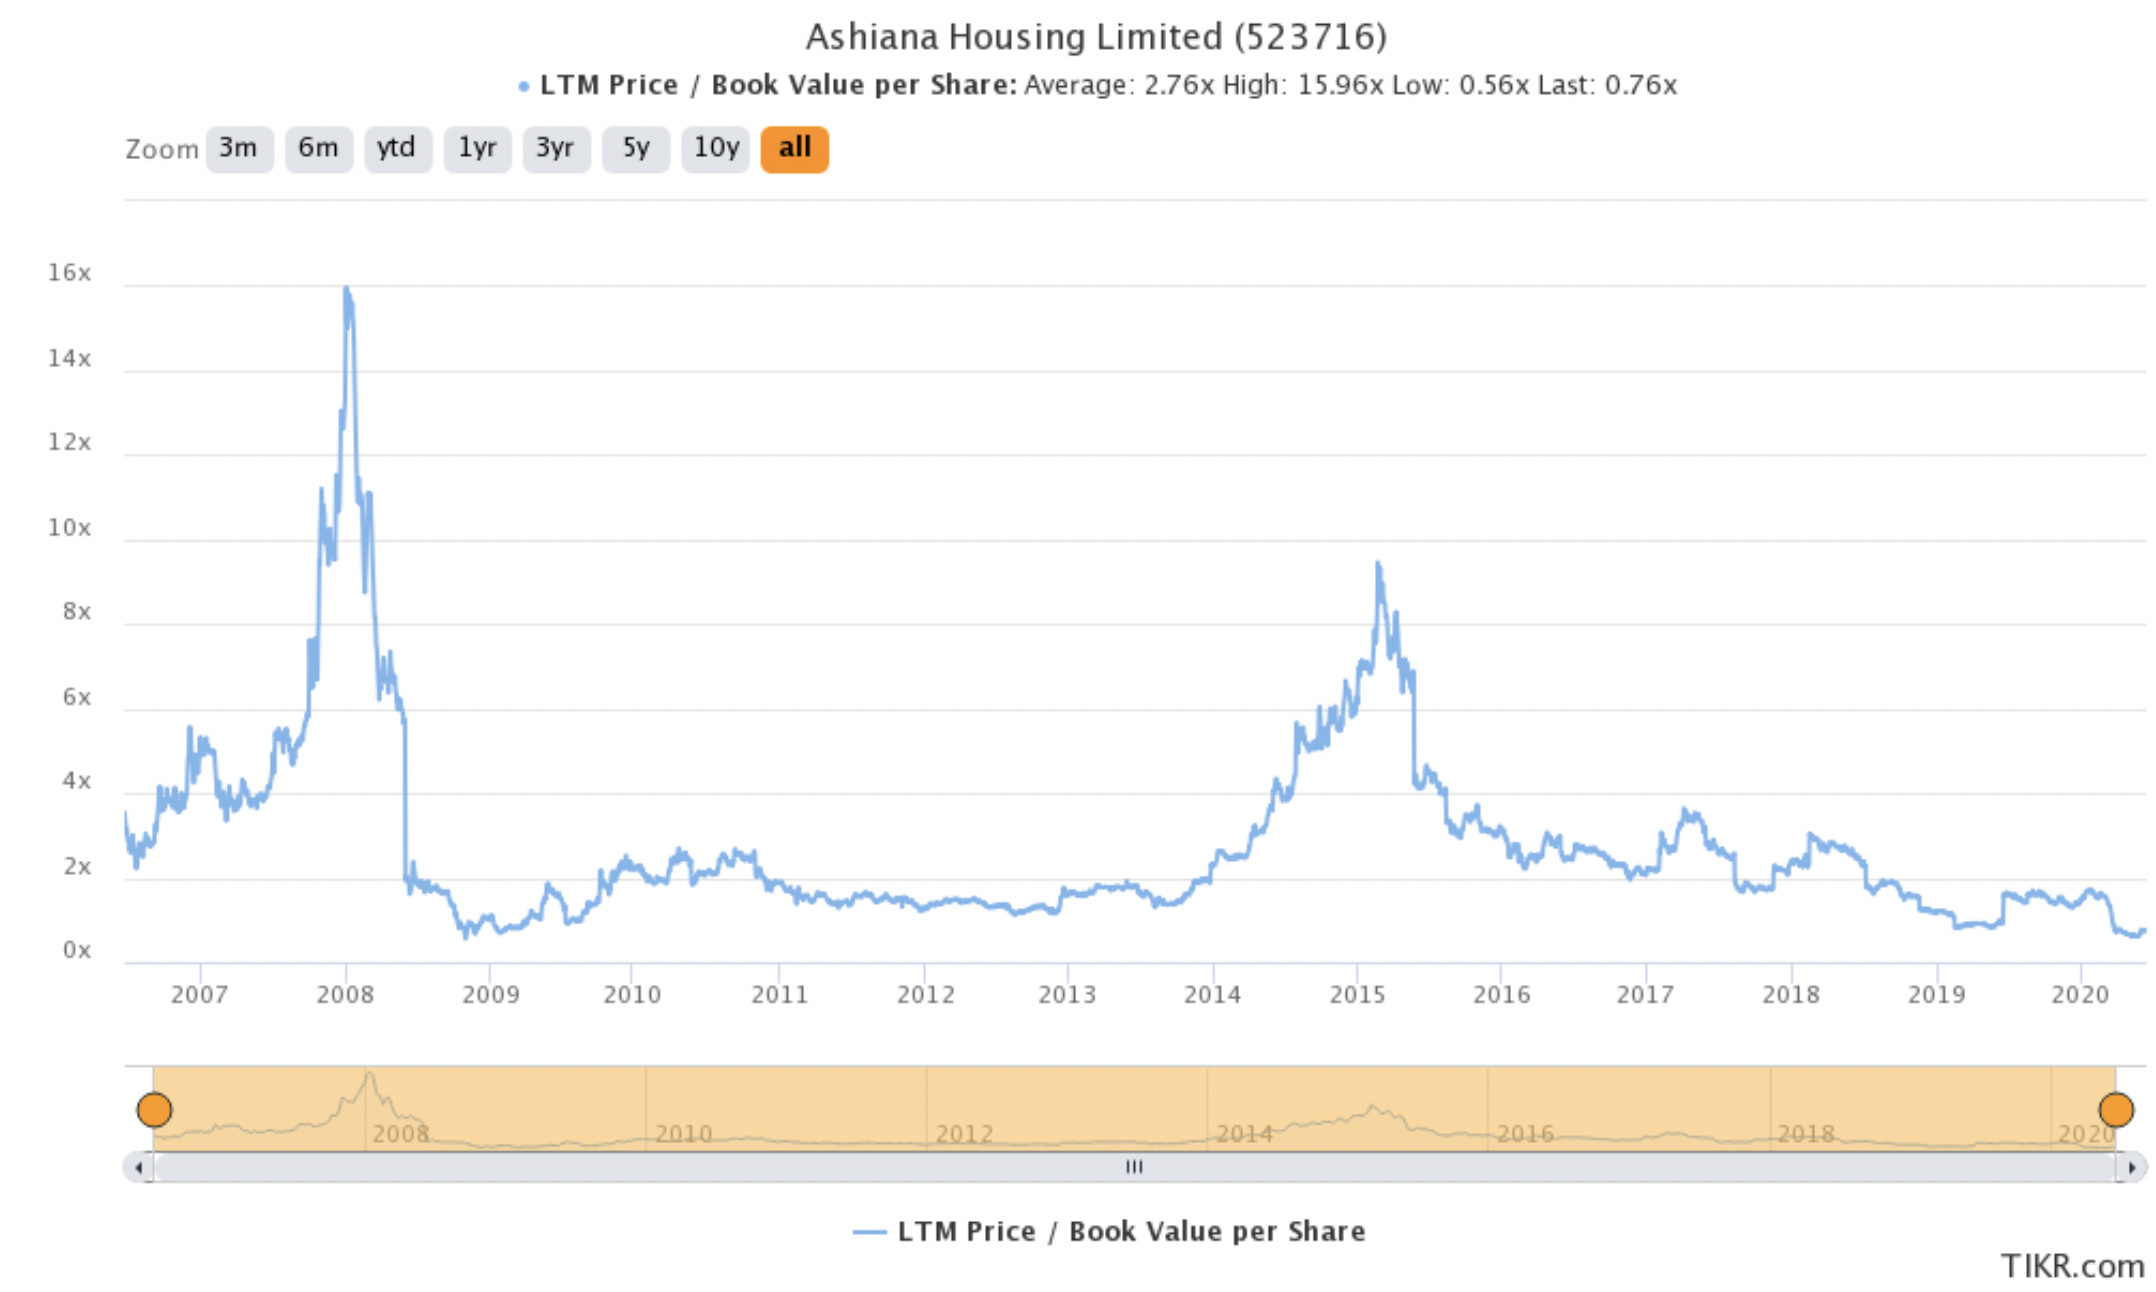
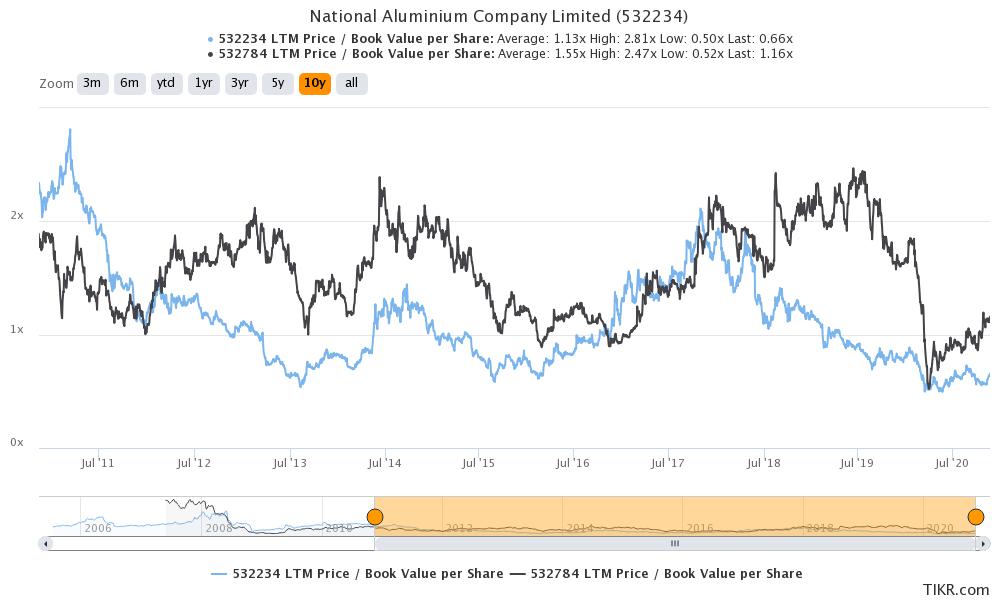
Fig3. Conference call of Ashiana Housing (link)

Now, that we know that real-estate goes in cycles, what next?
Its clear that we are nowhere close to the real-estate peak, my personal viewpoint is that the bust peaked in 2017-18 and the sector is already recovering. As real-estate is a hugely local market, it really depends on the micromarket where the company operates. Its a simple demand and suppy game. At times of boom, supply grows higher than demand which is reversed in times of bust. Different micromarkets behave differently. If we look at all-India level, the number of units sold in the last couple of years has been way higher than number of new launches (see fig4).

.
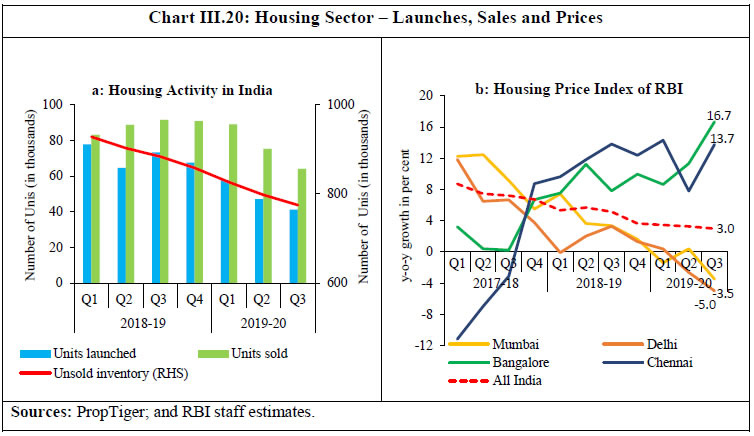
Fig4. Housing sector launches, sales and prices trends in FY19 and FY20 (link to RBI report)

How does COVID impact real estate?
Level 1 thinking says that demand will be impacted because of COVID’s impact on personal finances (bad for real estate companies). Level 2 thinking will say that supply will be more adversely impacted because a lot of developers who were already facing challenges might find it even more challenging to fund their projects. If supply goes down more than demand, prices increase (good for real-estate companies who can survive the current downtrend).

Micromarkets also make a huge impact on the fortunes of a company. This is clearly visible from the property price chart (called NHB RESIDEX) in Fig5. Except for Delhi, prices have been going up in different residential markets.


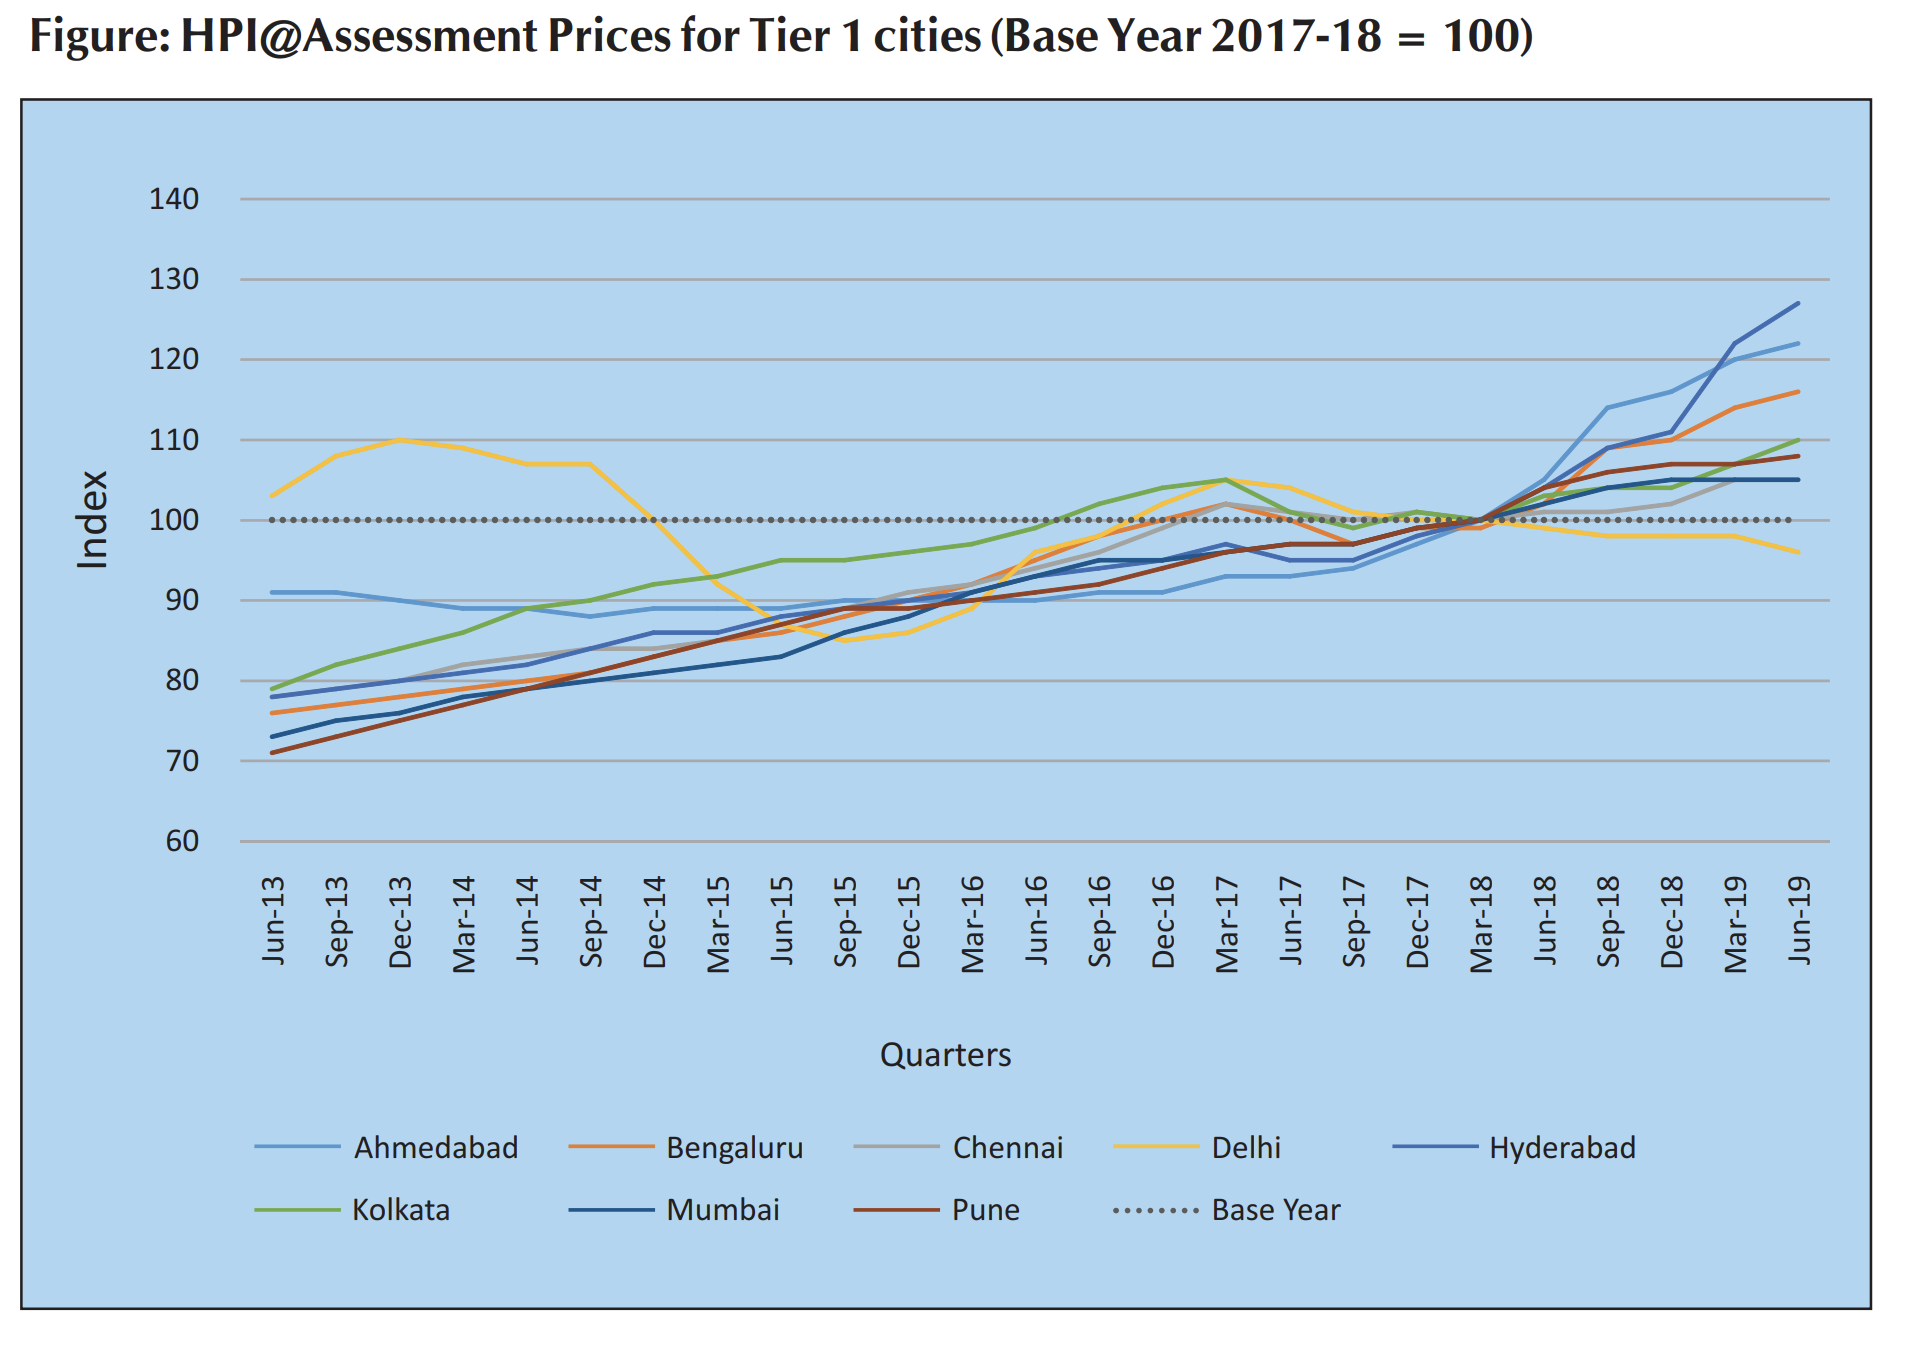
Fig5. Housing price charts normalized to 2017-18 fiscal year (link)

Another way to look at it is in terms of inventory duration i.e. how long will it take to liquidate inventory in a given region. The Anarock 2019 report clearly identifies Hyderabad and Bengaluru as two micromarkets with low inventory and reasonable number of launches (see Fig6). NCR region is a huge problem with >4 years of inventory and still large number of launches. This report from Knight frank also identifies Hyderabad, Pune and Bengaluru as low inventory markets.


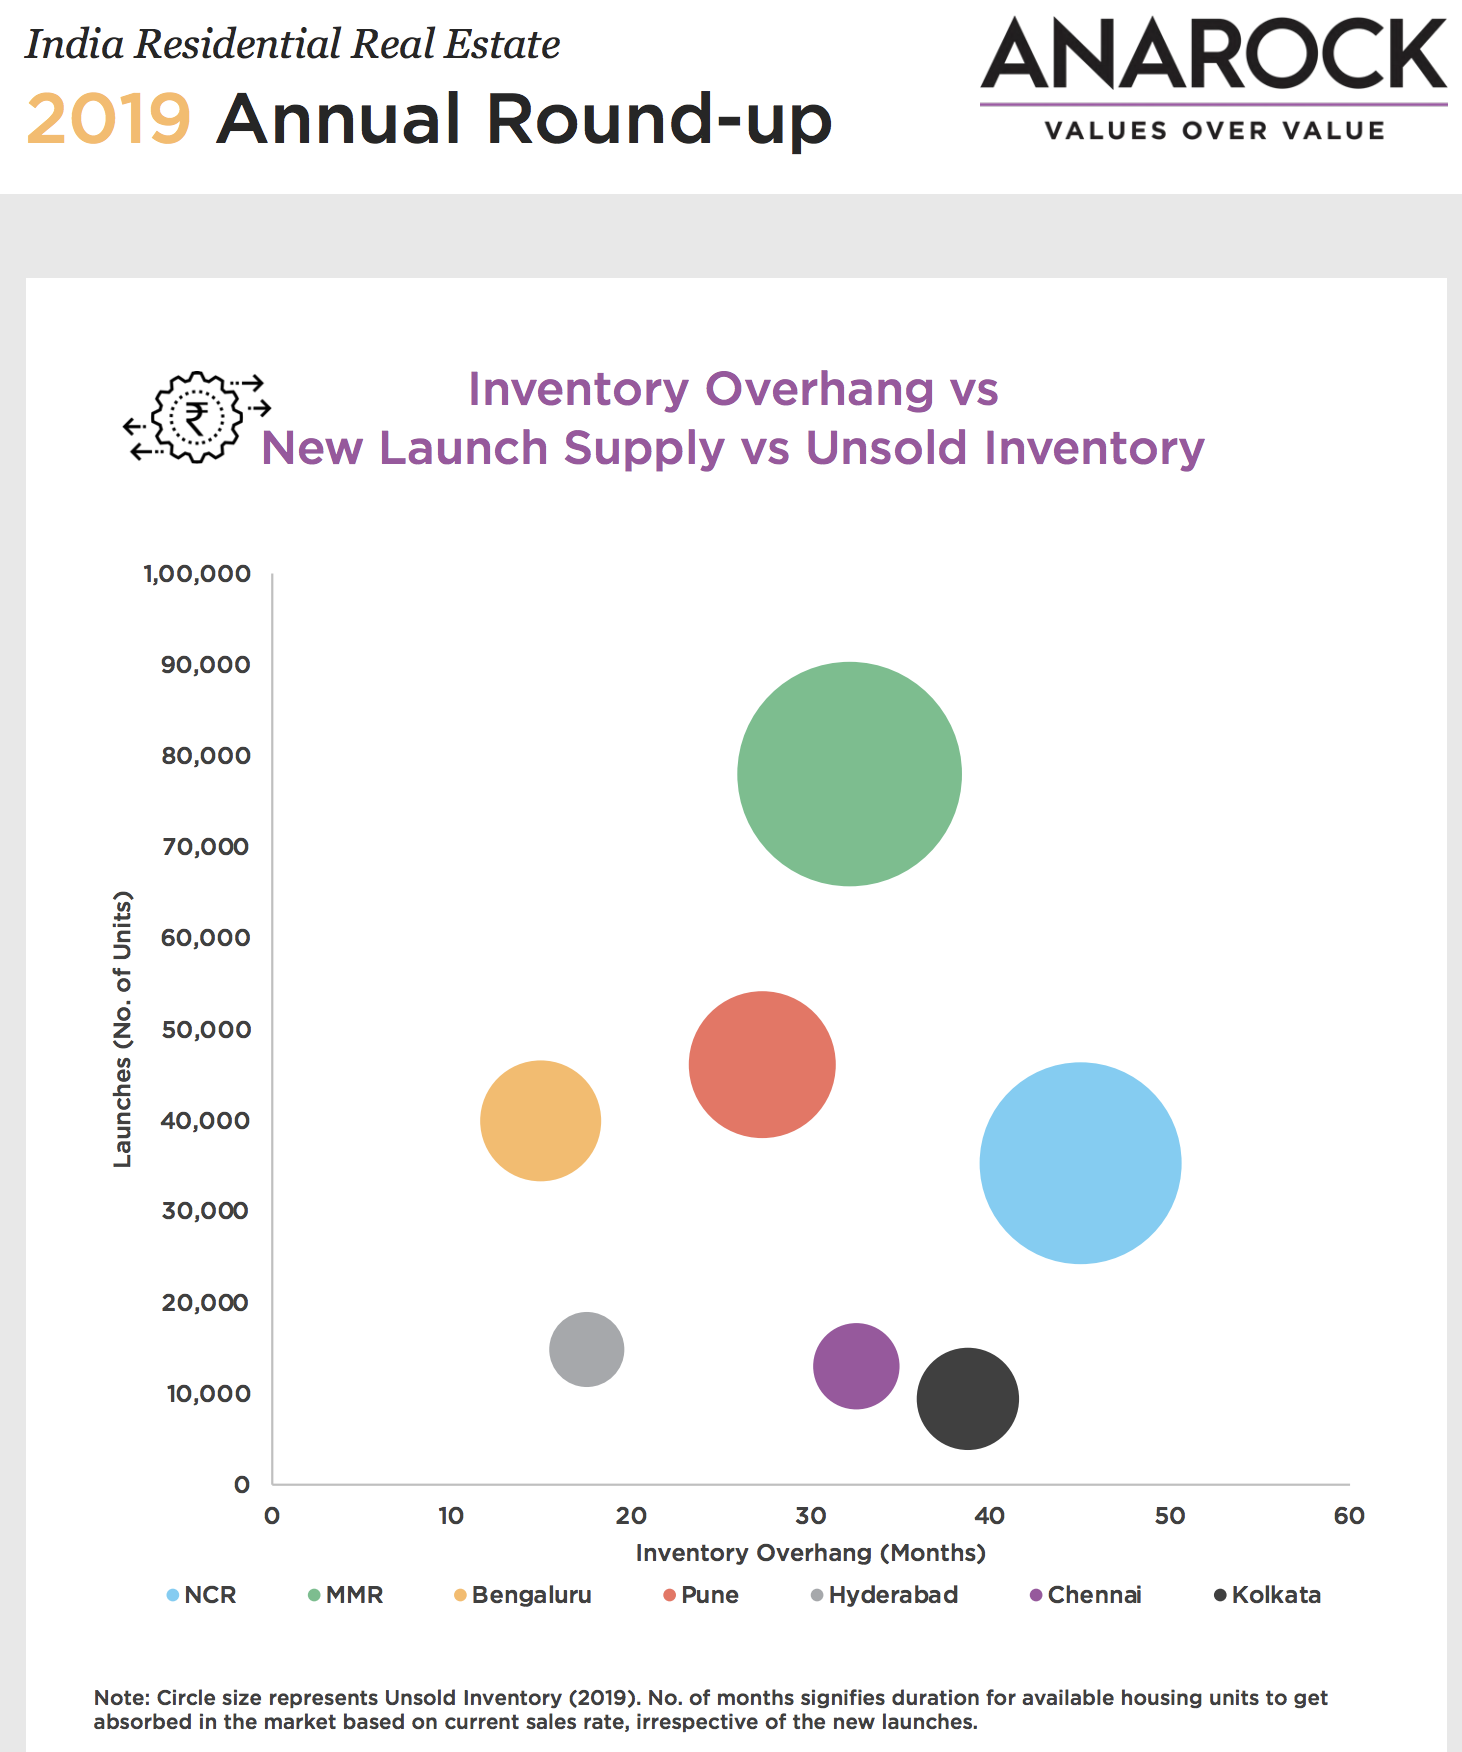
Fig6. Anarock report extracts (link)

In the next post, I will write about how we can play the real estate cycle giving example of a few companies that are trading at throw-away valuations.

27 Likes

In this post, I will try to illustrate the real-estate cycle through Ashiana Housing. The figure below shows detailed financials since FY2011

As shown in the previous post, the Indian residential real-estate cycle peaked around 2013-14 period. Ashiana’s booking also peaked around the same time at 22.13 lakh sq.ft in FY14 and went down to 6.93 in FY18. Since then, booking volume has picked up and the company managed to get close to its FY14 numbers. Other listed players have reported improving sales number in the last 2 years, which hints that the cycle might have bottomed out.

Book value can be a considered as a proxy to the current value of land and inventory. How has market price moved relative to their book value over time? (taken from tikr)

We can clearly see that market went a bit haywire in 2008 boom, and again in 2015 period (Ashiana housing thread is a very good illustration of the same). This shows how cyclical valuations (or market sentiments) are. Over the past 15 years, we have clearly seen two large bull markets in Ashiana where market was willing to pay upto 10x its book value. The next question is what is the appropriate P/B for such a business? Let me try to give my spin.

In FY10, Ashiana’s book value was ~130 cr. This has increased to ~750 cr. in FY20 (CAGR growth of 19%). For achieving this growth, company has taken ~95 cr. of debt, raised equity of 200 cr. in FY15 and given back dividends of ~80 cr. (excluding taxes). If we include taxes paid on dividends, the IRR numbers are 12-15%. Now we also know that the inventory and land costs stated on the balance sheet are historical numbers, their actual values might differ (are probably higher given inflation). In essence, the long term ROEs of the company is probably close to 15% which means at a risk free rate of 6%, this should be valued close to 2-3x its book value (if we do not assume growth). Market has valued it anywhere between 0.6x to 10x in the past.

What about now?
I did detailed valuation work here. The company sold flats worth 671 cr. in FY20, has land and inventory worth >1000 cr. all of which are available at a market cap of 630 cr.

Now the question is:

  • Will real-estate cycle recover (given the current down cycle has already been for 5 years)?
  • If it does, can management execute as they operate only in niche geographies (large inventory in Bhiwadi which is an auto-hub) and in niche sectors (senior citizen, trying to grow into family friendly housing)?

If the answer to the above is yes, it is a no-brainer 3-5x. What’s the downside? The current inventory is close to the market capitalization, they have an unlevered balance sheet (low bankruptcy risk). Only cycle has to turn.

Disclosure: Invested (latest position size here)

23 Likes

In this post, I will highlight commercial vehicle (CV) sector which is largely driven by credit and does well during economic expansion and gets butchered during economic contractions. I will illustrate it with a well known CV player Ashok Leyland. Here are the sales numbers, operating margins and net margins from 2004 (taken from tikr).

Strong growth was witnessed between 2003-2008, after which they witnessed growth contraction in FY09. Next phase of growth lasted until FY12, the downcycle then lasted for two years. The most recent phase of growth started in FY14 and ended in FY19. As auto is a business with huge operating leverage, margins expand during an upcycle and contract during a downcycle. For Ashok Leyland, in good times net margins can go upto 7% while in bad times net margins can also go negative.

How does Mr. market value this company over time?

In good times, EV/sales can go upto 2x and comes down below 1x in bad times.

I am sharing some really basic stock price data to see how we can benefit from these cycles.

2003 lows ~ 5
2008 highs ~ 28 (5.6 times from previous low)
2008 lows ~ 6.15 (78% low from previous high)
2010 highs ~ 40 (6.5 times from previous low)
2013 lows ~ 11.75 (70% low from previous high)
2018 highs ~ 167.5 (14.3 times from previous low)
2020 lows ~ 33.7 (80% from previous highs)
Next highs ~ ???

Stock price goes up by >5x from cyclical lows and retraces 70-80% during the next downcycle. Its almost predictable! However, please note we are looking at past and future may turn out to be different.

The current downcycle started after ILFS episode (2018), we are currently 1.5 years in the downcycle. These can easily last 2-3 years. However, the long term growth of the CV sector reflects long term economic growth (i.e. GDP growth + inflation ~ 10-12%).

Key risks:

  • Before ever investing in Ashok Leyland, everyone should read this post.
  • Ashok Leyland grew at a faster pace in the past because it took market share away from Tata motors. Volvo eicher has been trying to take market share away from Tata and Ashok Leyland.
  • Ashok Leyland has been trying to increase market share in light to medium segment which is less cyclical than medium and heavy segment where Ashok Leyland is market leader. However, the light to medium segment is much more competitive.

Disclosure: Invested (position size here)

13 Likes

In this post, I will talk about airline businesses, they are one of the most classic cyclicals prone to fluctuations in crude oil prices and prevailing economic circumstances. When crude jumps suddenly during an economic expansion phase, airline tend to lose money as there is plenty of competition around and generally the lowest cost provider defines the ticket pricing. This goes on a while until someone goes bankrupt (shock in supply) leading to higher ticket prices benefitting the incumbants (eg: Jet bankruptcy in March 2019 benefitting incumbants). I will try and illustrate this with Indigo, Southwest airlines and Ryan air with data taken from tikr.

For Indian conditions, the low cost carriers like Indigo tend to make net profit margins > 10% in good times when crude prices are in check and economy is expanding (like 2010, 2017) and goes down to 0 or negative in bad times when there is a crude price shock (like 2012-13) or a general demand shock (like now).

The same applies to Southwest airlines. We can see low margins after 9/11 and the 2003 recession, 2008-09 financial crisis. These rebound in good times.

For the world’s leading low cost airline Ryan air, here are the margins. Its incredible that they do upto 20% net profit margins in good times. Indigo promoters have repeatedly said that they want to get to the same margin profile as Ryan air.

How does market value this business over time?

Indigo has been valued upto 2.5x EV/sales (translating into normalized P/E of 25x) in good times and multiples derate to 1x EV/sales (normalized P/E of ~10x) in bad times.

Here are the numbers for Southwest.

Here are the numbers for Ryan air. Market has given them valuations upto 4x EV/sales because of their very low cost structure translating into higher earnings. Again similar trend as Indigo and Southwest.

Contrary to popular perception, airline can be a good busines if managed diligently. Southwest airlines has been one of the best compounding stories in US. Since 1995, here are the returns for Southwest (after this corona crisis). For Ryanair it has been incredible, with 15% (in USD) CAGR since 1997 (excluding dividends).

Disclosure: Invested in Indigo (position size here)

9 Likes

Entering and Exiting Cyclicals

One of the key arguments I have heard against cyclicals is:

  1. One cannot predict when the cycle will turn.
  2. Making money in a cyclical requires one to correctly time the entry and the exit, since these are typically not ‘buy and hold’ type companies. This increases the scope for making erroneous decisions thereby reducing returns.

These are both correct. The first one, imo is difficult to predict because the cycles are not uniform (same length or amplitude) and there can also be nestled cycles in specific industries (similar to the nestled cycles in economy, as pointed out in Ray Dalio’s video which Harsh talks about in first post). I will try to make some progress on the second point. Are there “no-brainer” entry and exit points one can think about, from a data-driven analysis? I think the answer is yes.

I will take a case study of National Aluminium Company and Sobha Ltd both in cyclical sectors. Their respective threads contain very good information for how to analyze them from fundamental aspects. I only probe the question of “no brainer” entry and exit points.

National Aluminium Company

Fundamentals

I superimpose the price movement with the fundamentals (Operating Margins, Gross Margins, Sales) to see what we can learn from the data.

Note for Fundamentals graphs: All Prices and Fundamentals are scaled to fit better when comparing relative fluctuations. Raw data is at this google sheet.


Inferences:

  1. Despite the Margins and Sales Collapsing between 2008 and 2011, the stock price came back to previous highs in 2010 (possibly in anticipation of improvement in fundamentals). When fundamentals didn’t improve, it collapsed again.
  2. The two times that margins and sales expanded post 2011 were in 2016 and 2020. Both times, the stock price moved in anticipation of the improvement and the price high preceeded the fundamentals high by roughly 1-1.5 years in 2016 and 1.5-2 years in 2020.
  3. This clearly demonstrates the difficulty in timing cyclicals. The price appreciation happens in anticipation of fundamentals improving. If we wait for TTM numbers to show a margin or sales expansion, a lot of upside might already be off the plate.
  4. I did investigate more granular fundamentals data (Quarterly) but that proved to be too noisy with margins fluctuating a lot.

Technicals

I also investigate whether it might be possible to enter these cyclicals in a price-chart/technical indicator based manner. I look at RSI. Since we’re talking about multi-year cycles, I look at the monthly RSI (1 data point is represented by 1 month).


Inferences:

  1. When RSI dips below 40, it presents a good buying opportunity (eg: Nov 2008, Jun 2013, Jul 2015, Mar-Now 2020).
  2. However, we also observe that RSI has to decisively break the resistance of 40 on the way up, for there to be a sustained price appreciation. In Dec 2011-Jun 2012, RSI did go below 40 (and even touched 30) but sustained below 40, resulting in price erosion.
  3. From these, I conclude that if one can make a subjective judgement as to whether RSI has broken above 40 then it presents a good buying opportunity. Note that this has not yet happened in 2020. RSI tested 40 in Aug 2020 and Nov 2020 but hasn’t decisively broken above 40.
  4. The RSI peaks above 60 and 70. This has happened multiple times. 2002, 2003, 2006, 2008, 2017 at RSI of 70 and 2009, 2014 for RSI of 60. From this, I conclude that an RSI of 60 possibly represents a good time to start unwinding a cyclical investment/trade.

Sobha Ltd

Fundamentals


Inferences:

  1. Sales have been non-cyclical for Sobha (almost ever increasing).
  2. Margins wise, the only clear pattern is that operating margins have been under pressure since 2014 until 2020 and yet, prices have moved in anticipation of the improvement in fundamentals in 2017 & 2018. If an investor had waited for the margins to bottom out, a lot of price appreciation would already have happened.

Technicals

Inferences:

  1. Similar to Nalco, Sobha presents buying opportunities below an RSI of 40 and peaks near RSI of 60 and 70.

Conclusion

In my understanding, utilizing technical indicators in addition to monitoring the fundamentals enables the investors to time entry and exit decisions better, because the prices often move in anticipation/speculation of improvement in fundamentals.

Sources:

  1. tikr.com for fundamental data
  2. in.tradingview.com for technicals data

Disc: Small position in Nalco, no position in Sobha.

12 Likes

For cyclicals, the bet is on mean reversion. So plotting a fundamental variable which is mean reverting in nature solves the problem (in most cases). Here is the P/B value charts for NALCO and Sobha over the last 10 years.

For nalco, a clear buy is ~0.6x P/B and sell is ~2x P/B. For Sobha, buy is below 1x P/B and sell is at 2x P/B. The length between this valuation gap determines the IRR. What I mean is if it takes 5-years to go from 1x to 2x, IRR is 15% from re-rating + growth in book value. If the same takes 10-years, then IRR is 7% from re-rating + growth in book value. No real rocket science in buy/sell decisions. The only thing that matters is if the company has the balance sheet strength to survive the downtrend, everything else like length of cycle, amplitude, etc. is mostly luck.

NOTE: WHAT WE ARE DOING HERE IS FITTING OLD DATA AND EXPECTING FUTURE TO TURN OUT LIKE THE PAST WHICH CAN LEAD TO OVERFITTING!

Over long periods of time, valuations are very cyclical, here are the lower and upper P/B bounds for Markel over the last 3.5 decades.

I can provide these kinds of charts for a lot of companies (Berkshire, Schlumberger, etc.) which have operations since the last 3-4 decades. The basic summary is if we zoom out and plot some fundamental variable (which is mean-reverting) over long periods of time, valuation work is done. This is what old value folks like Tweedy Browne have been doing for the last 5-decades.

26 Likes

Loved this thread. Although only you two are the contributors, this is really profound