Short Company Summary
The Company manufactures agrochemical (Fungicides, Herbicides, Insecticides & Intermediates) active ingredients (technical), bulk and formulations, intermediate products and sells its products in India as well as exports them to approximately 24 countries. Some of the exports are via CRAMS (Contract Research and Management Services) platform.
PS: A good resource to understand CRAMS in general (though the video is about Pharma CRAMS, the basic principles still apply) is: Indian Investing Conclave
They primarily manufacture (bulk) formulation and Active ingredients for agrochemicals. Some of the example agrochemicals manufactured by them are:
Tebuconazole
Propiconazole
Hexaconazole
Difenoconazole
Metalaxyl
Tricyclazole
Imazethapyr
Lambda cyhalothrin
Source: http://www.astecls.com/products.aspx
Apart from making bulk agrochemicals,The company has identified contract manufacturing as
a platform for future. The Company is able to provide its customers value addition due to its strong Research & Development (R&D) capabilities.
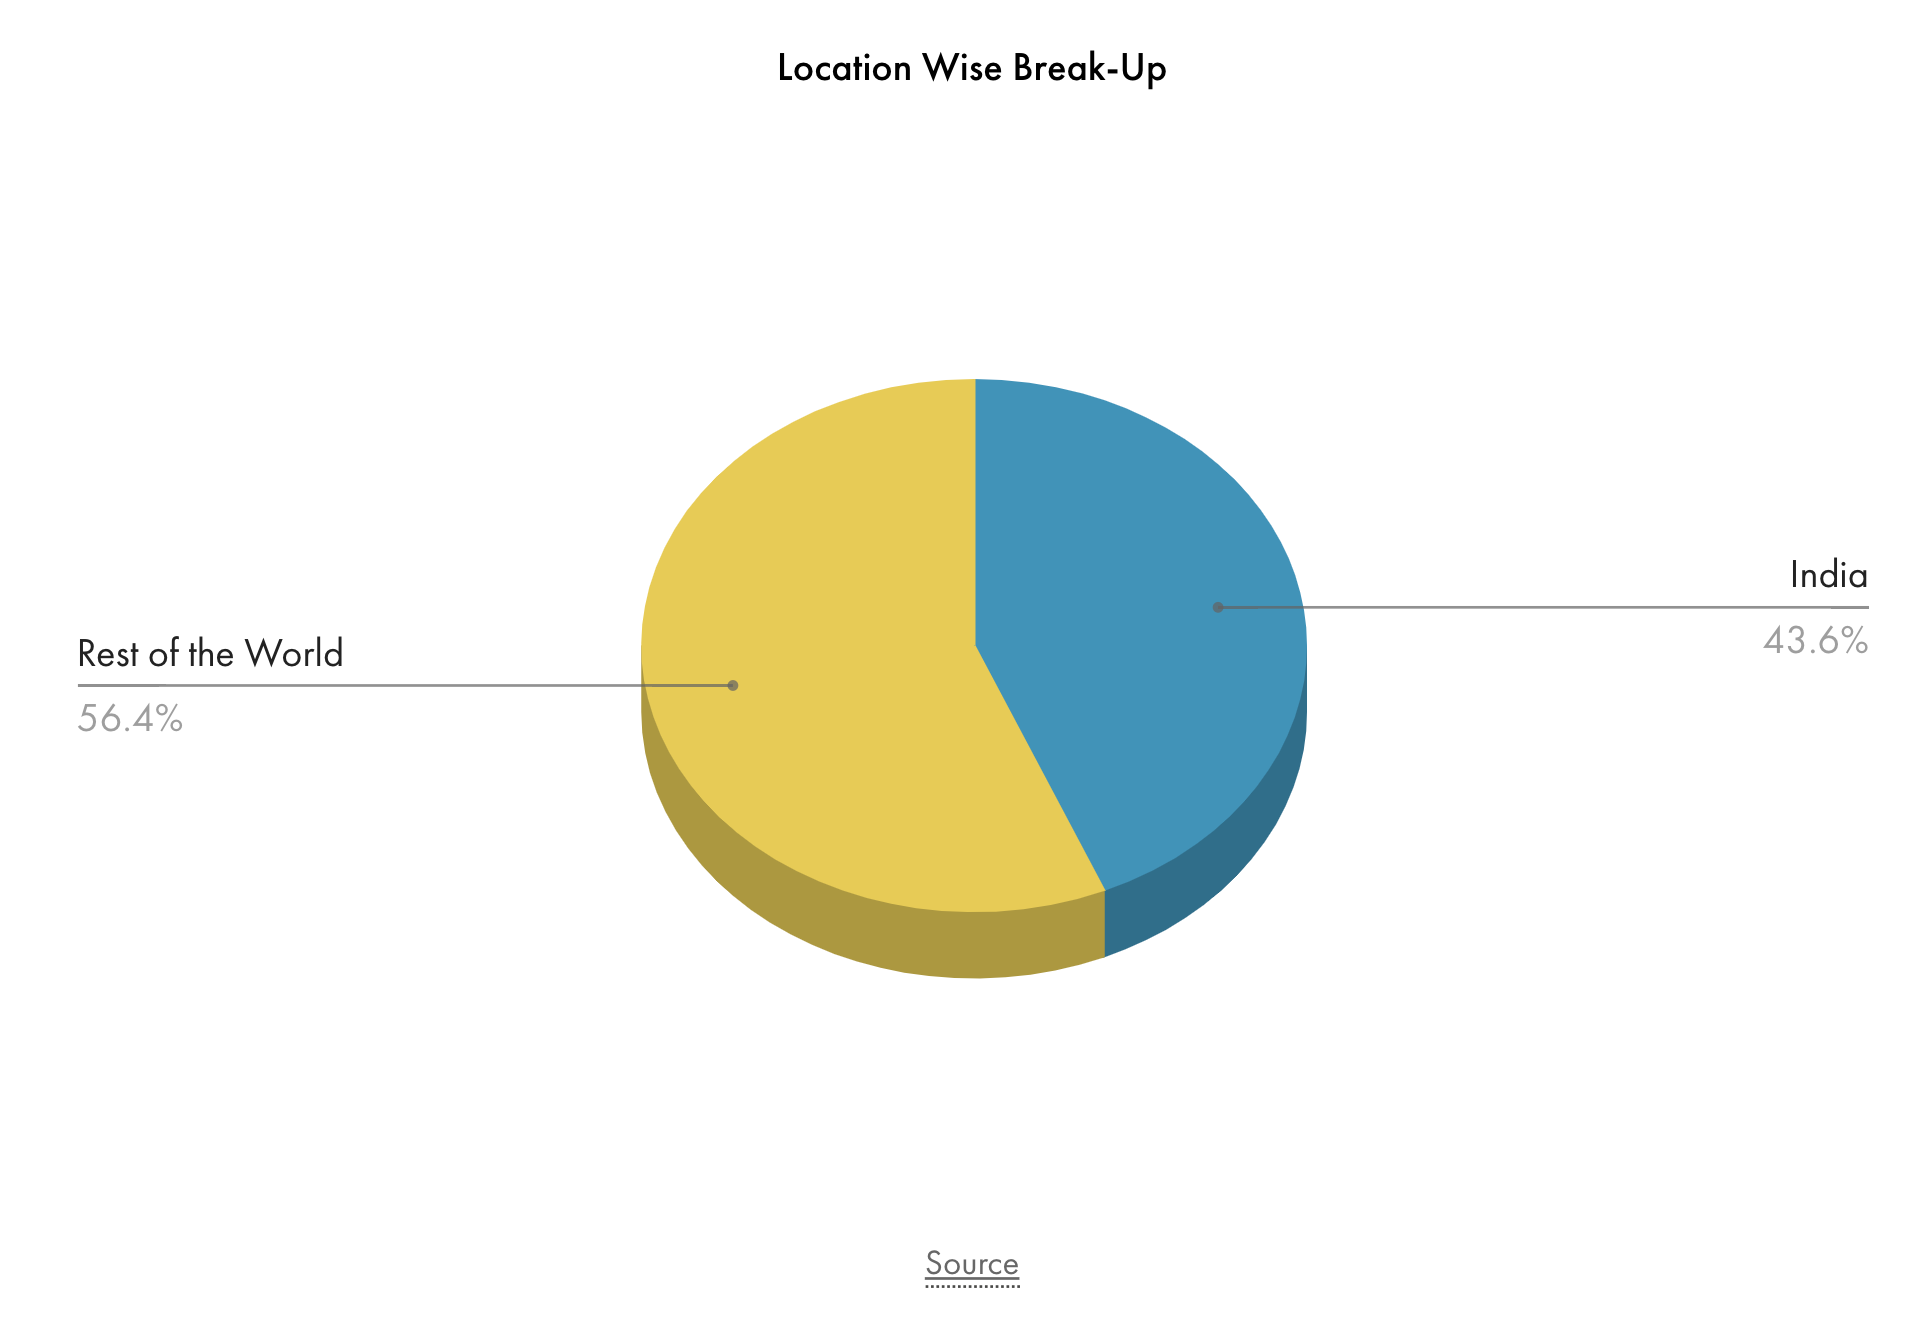
Revenue Breakup
Exports now makes up a majority of the revenue/sales and a significant (unknown) portion of exports is through CRAMS:
Source: Astec Lifesciences Ltd. Stock price: Live updates | Tijori Finance
It is also interesting to see how the revenue of the company has shifted from domestic sales (bulk agrochemicals) to exports (a significant part of which is CRAMS) for agrochemicals over the years:
| Financial Year | Revenue from domestic Sales | Revenue from Exports | Percent Growth in Exports | Total Revenue | Percent Growth in Revenues | Percent Revenue from Exports |
|---|---|---|---|---|---|---|
| 2016 | 144 | 89 | 233 | 38.19742489 | ||
| 2017 | 178.8644 | 133.8356 | 50.37707865 | 313 | 34.20600858 | 42.8 |
| 2018 | 172.0433 | 206.9067 | 54.59765563 | 379 | 21.18644068 | 54.6 |
| 2019 | 192.712 | 249.288 | 20.48329029 | 442 | 16.6380789 | 56.4 |
| 2020 | 230.865792 | 303.134208 | 21.6 | 534 | 20.81447964 | 56.76670562 |
Source: Annual Report for FY17,18,19,20.
Financials
| Mar 2016 | Mar 2017 | Mar 2018 | Mar 2019 | Mar 2020 | |
|---|---|---|---|---|---|
| Sales | 233 | 299 | 368 | 431 | 523 |
| Sales Growth | 28.20% | 23.08% | 17.22% | 21.28% | |
| Fixed Assets | 95 | 103 | 115 | 167 | 194 |
| Fixed Asset Turns | 2.452631579 | 2.902912621 | 3.2 | 2.580838323 | 2.695876289 |
| OPM % | 14% | 21% | 15% | 18% | 16% |
| ROCE% | 12% | 20% | 22% | 20% | 20% |
| EPS | 2.55 | 9.8 | 17.87 | 18.28 | 24.28 |
| Source: Astec Lifesciences Ltd share price | About Astec Lifescienc | Key Insights - Screener |
Few observations:
- Strictly increasing sales
- Stable profitability.
- Good Fixed asset turns
- Stable ROCE
2019-2020 annual report summary
Financials
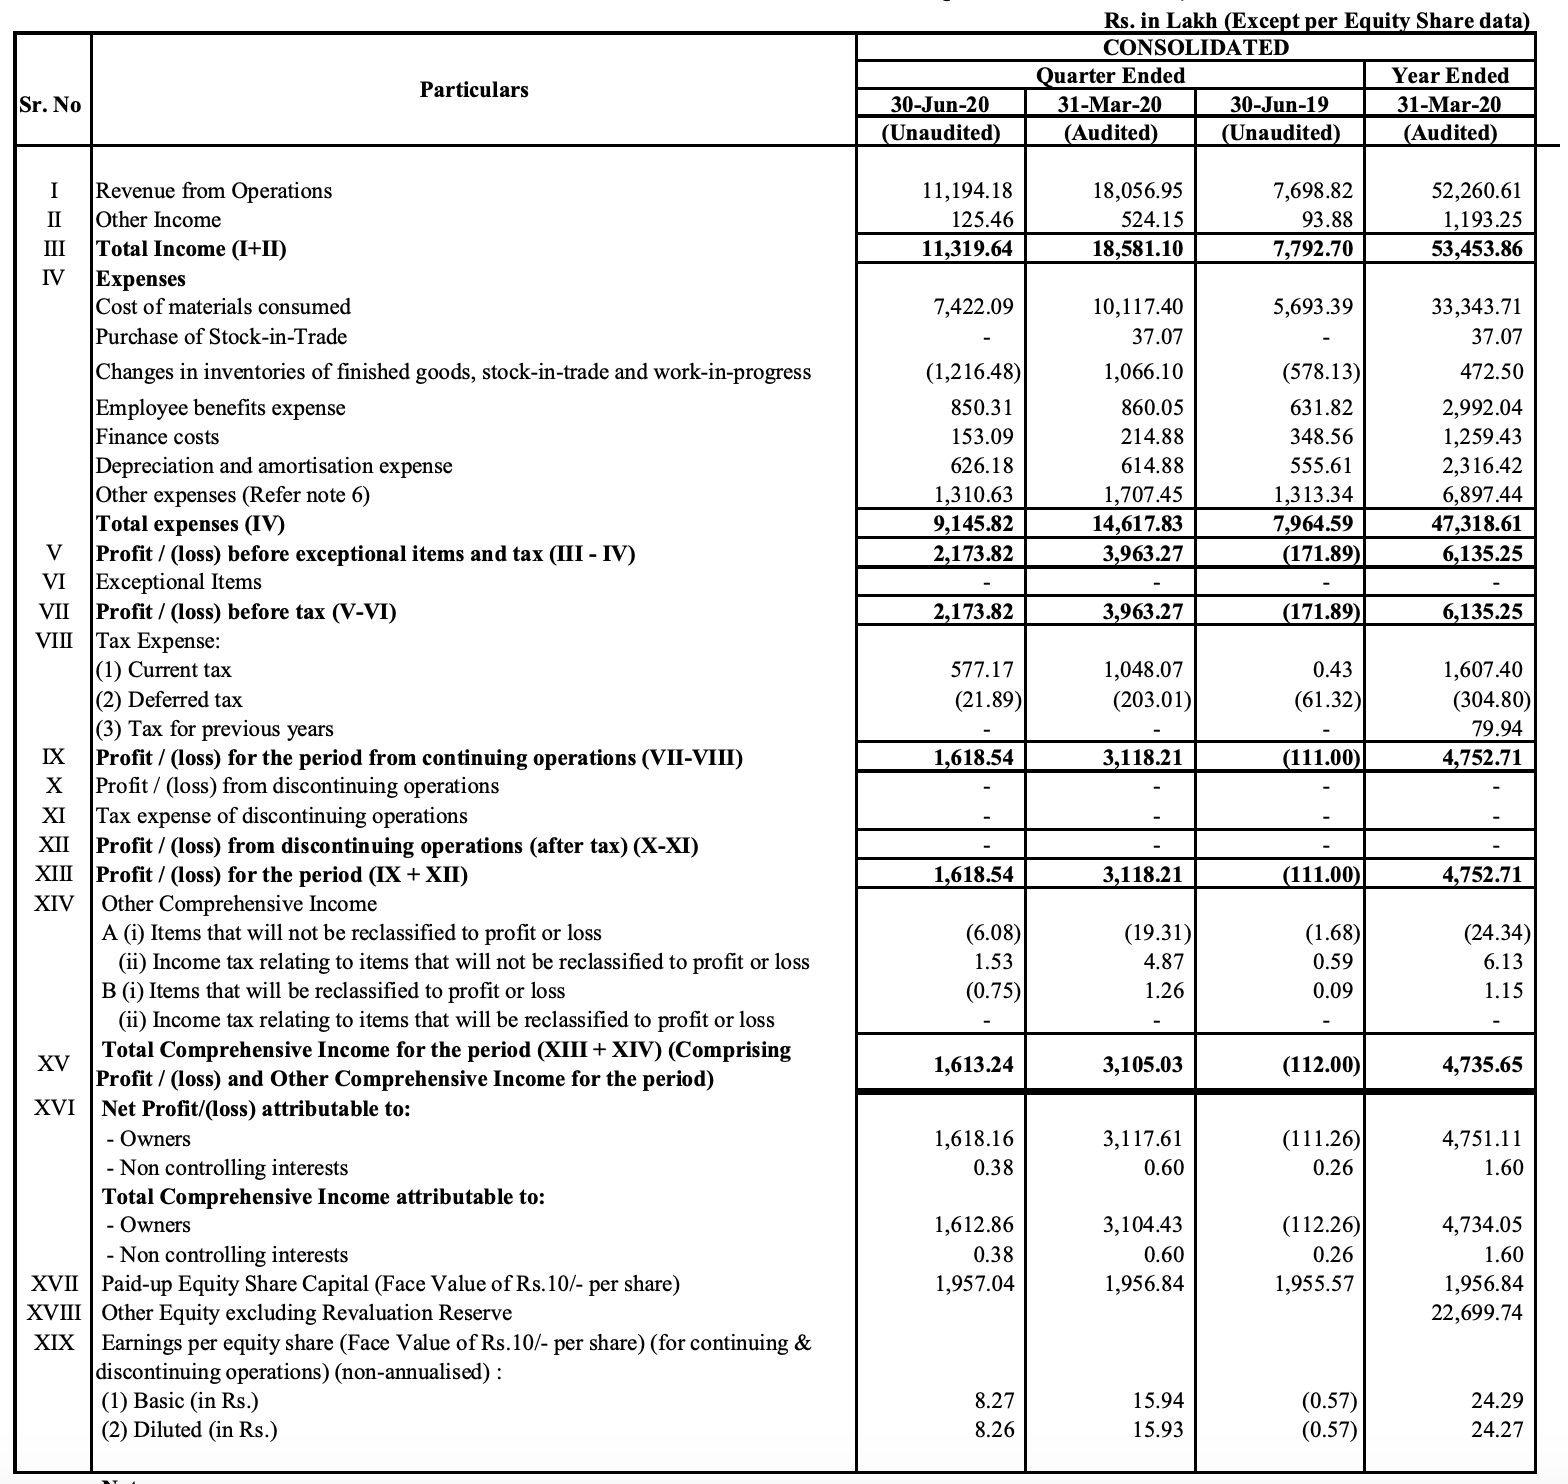
- Financial Year 2019-20 represented another year of robust growth for Astec. Total Revenues grew by 20.8% from 44,200 Lakh during 2018-19 to 53,415 Lakh during 2019-20. Exports increased by 21.6% during the Financial Year 2019-20. Profit After Tax (PAT) improved by 33.0% from 3,569 Lakh during 2018-19 to 4,747 Lakh during 2019-20. The Company was also able to reduce its borrowings from 17,567 Lakh to 9,871 Lakh. Thereby, the debt-equity ratio reduced from 0.87 to 0.40.
- Return on Capital Employed (ROCE) was 19.2% and Return on Equity (ROE) was 19.3%. The consistent performance resulted in a 4-year Compounded Annual Growth Rate (CAGR) of 19.9% in revenues and 36.4% in Profit After Tax (PAT).
Covid Related
- Our plants were shut down in the last week of March 2020 due to the nationwide lockdown. However, through proactive actions by our team, we resumed production in our plants in a phase-wise manner from April 10, 2020. Extensive precautions have been taken to ensure safety of our people. While the lockdown has been eased, we continue to be vigilant and continue to manage the changing environment.
- Your Company is ensuring utmost safety of employees and business partners at factories by strictly following safeguard measures such as usage of masks / gloves, regular temperature screening, setting up disinfectant tunnels, maintaining social distancing, allowing limited workforce and regularly conducting comprehensive factory sanitization
Contract Manufacturing
- The Company’s contract manufacturing business also performed well and we saw strong demand for our products. We commissioned two new products for multinationals. We also have several projects in the pipeline which will be rolled out over the next few years
- We have completed the design of our new state-of-the-art Research & Development (R&D) Centre, which will result in a quantum jump in our R&D capabilities. We hope to commission this facility by the end of the next year.
- The Company is able to provide its customers value addition due to its strong Research & Development (R&D) capabilities.
Miscellaneous
- Mr. Ashok Hiremath shall not be paid any sitting fees for attending Meetings of the Board of Directors or of any Committee thereof
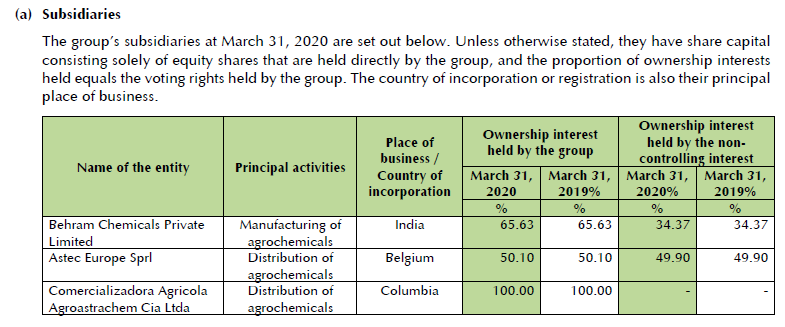
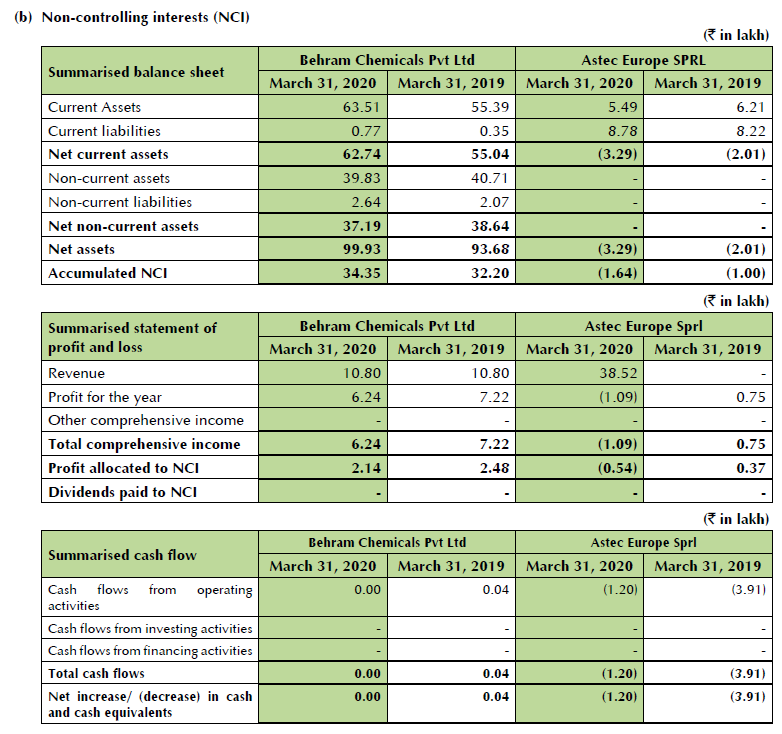
- Company has 3 subsidiaries:
1. Astec Europe Sprl (Belgium, Europe) 50% shareholding
2. Comercializadora Agricola Agroastrachem Cia Ltda (Bogota, Columbia): 100% shareholding
3. Behram Chemicals Private Limited: 65%
- Mr. Ashok V. Hiremath is a graduate from the University of Oxford, holds a Master’s degree of Arts (Engineering) from the University of Oxford and a Post Graduate Diploma in Chemical Engineering from the University of London. He has experience in agrochemical manufacturing industry. Previously, he has worked with GEA Airexchangers Limited, London and Hiremath Chemicals Limited.
- He has been actively involved in the affairs of the Company and has played a key role in the growth of the Company since 1994. He was awarded the “Dombivili Giants Award” for Industry in 2008 and the “Udyog Rattan Award” by the Institute of Economic Studies in 2010 and “National Gold Star Award & Gold Medal” from “The Indian Society for Industry and Intellectual Development” and some other international awards for his excellence in Chemical Business
- During the Financial Year 2019-20, it has been decided by the Board of Directors of your Company to withdraw the Scheme of Amalgamation of your Company with Godrej Agrovet Limited (which was filed during the Financial Year 2018-19), based on interaction with multiple stakeholders.
- Both Ashok V hiremath (MD) and Arijit Mukherjee (Whole Director) and Saurabh Bhala took pay cut of 10-15% in 2019-20.
- Ashok V hiremath holds 9.94% in the company
- R&D as a % of sales is 2.26% in 2019-20 versus 0.7% in 2018-19
Management commentary on path ahead for agrochemicals
- Opportunity for Indian agrochemical players remains high, both in the domestic and the international markets. Increasing usage of agrochemicals is needed in India, given the high focus on increasing the yield per hectare, limited arable land, rising labour costs and increase in growth of herbicides and fungicides.
- Globally, disruption of Chinese agrochemical supply chain has shifted the focus on India, thereby increasing the opportunity for contract manufacturing business for Indian players. Also, as a large number of molecules are going off-patent in the next 3 to 5 years, it further augments the opportunity for Indian players.
- Your Company is one of the leading players in triazoles fungicide and is well-placed to capitalize on opportunities arising in the domestic and the international markets.
- While in India, large number of companies are dependent for their raw material supplies from China, your Company is continuously investing in backward integration projects to reduce its dependence on Chinese raw material.
- This is not only helping the Company in reducing its reliance on China, but is also aiding in margin expansion.
- Segment-wise, revenue growth was mainly driven by enterprise sales, however, contract manufacturing business also grew, as compared to the previous year.
- Geographically, both domestic business and international business contributed to the revenue growth.
- Going forward, your Company will continue to focus on developing manufacturing capabilities which should cater to the key changes emerging in agrochemical industry, both in the domestic and the international markets
Risks
- Erratic and poor South West monsoon can adversely impact the demand for the products of the agrochemical companies. Prolonged El Nino condition also poses a risk to companies in this sector.
- A large part of your Company’s operations are dependent on exports and need raw materials which may not be available in the domestic market, therefore, risk associated with the non-availability of these materials from overseas markets and also the foreign currency volatility always exists.
- Extension of COVID-19 pandemic for longer than expected time can impact export sales and raw material availability
Source: 2020 Annual Report
Peer Comparison
| Astec Lifesciences Ltd | PI Industries in 2010 | P I Industries Ltd | |
|---|---|---|---|
| Market Cap (cr) | 1870.03 | 430 | 29426.34 |
| Sales (cr) | 557.55 | 543 | 3672.5 |
| OPM (%) | 19.21 | 16 | 21.63 |
| Stock P/E | 28.86 | 10 | 58.79 |
| ROCE (%) | 20.49 | 25 | 24.66 |
| Debt to equity | 0.4 | 0.49 | 0.19 |
| Debt (cr) | 98.71 | 62 | 507.7 |
| Operating Profit (cr) | 85 | 87 | 578 |
| PBT (cr) | 61 | 57 | 538 |
| Net profit (cr) | 64.8 | 42 | 500.5 |
| Employee cost (cr) | 30.11 | 44 | 266.6 |
| Here, I’ve compared astec lifesciences to PI industries in 2020 and PI industries in 2010. The comparison demonstrates that business wise, astec is at a place where PI industries was 10 years ago. The major difference here is the valuation. The profitability is comparable due to similar business models. Astec today is roughly 7 times smaller than PI industries. |
Valuation
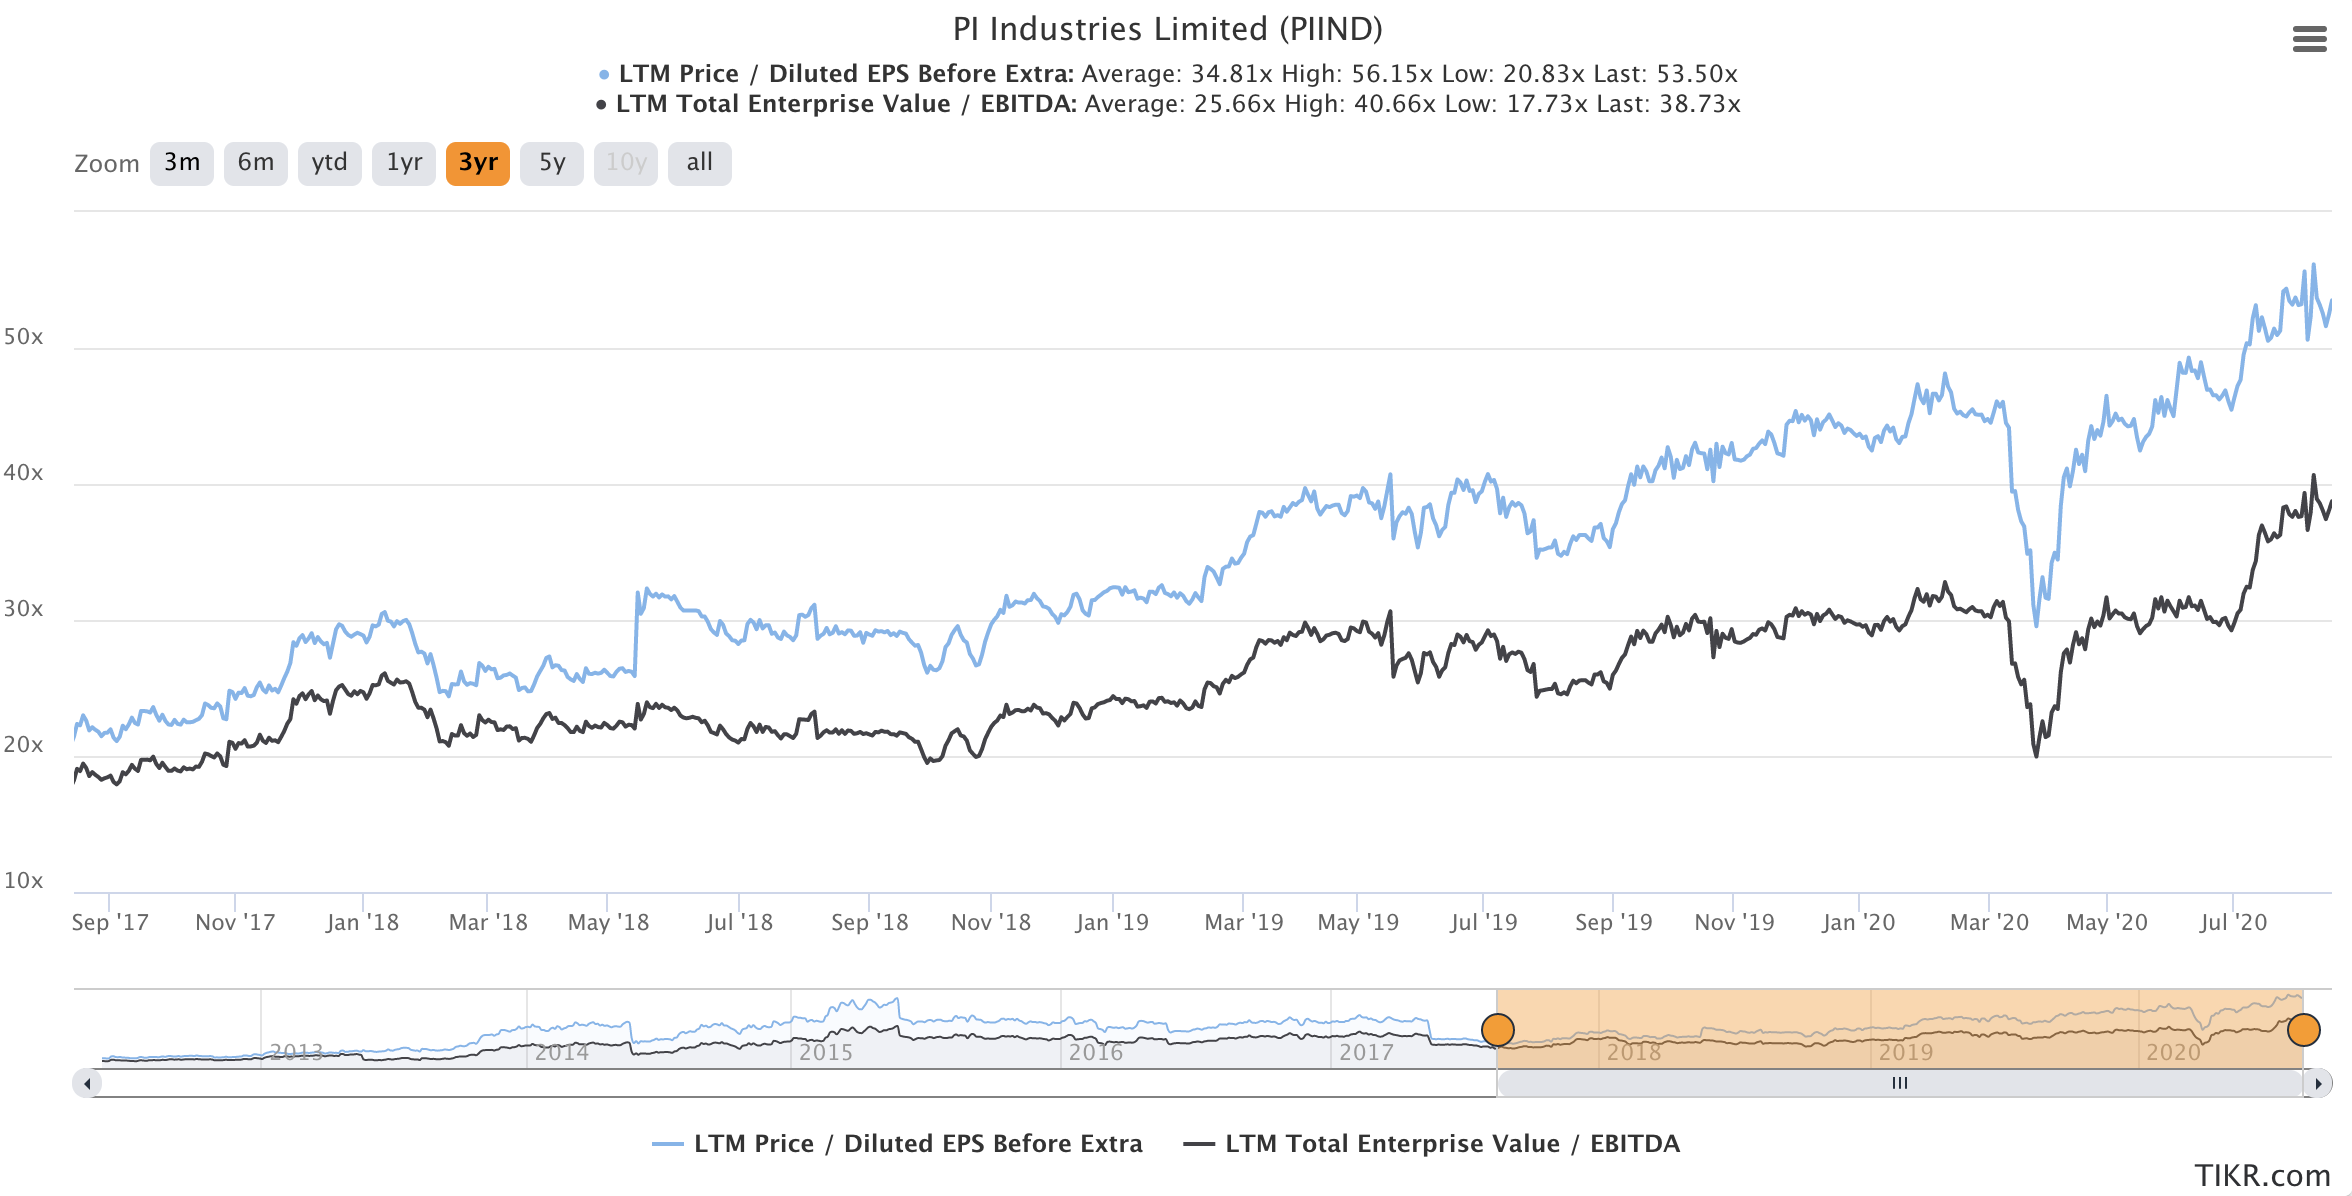
I use historic P/E and MarketCap/EBITDA plots:
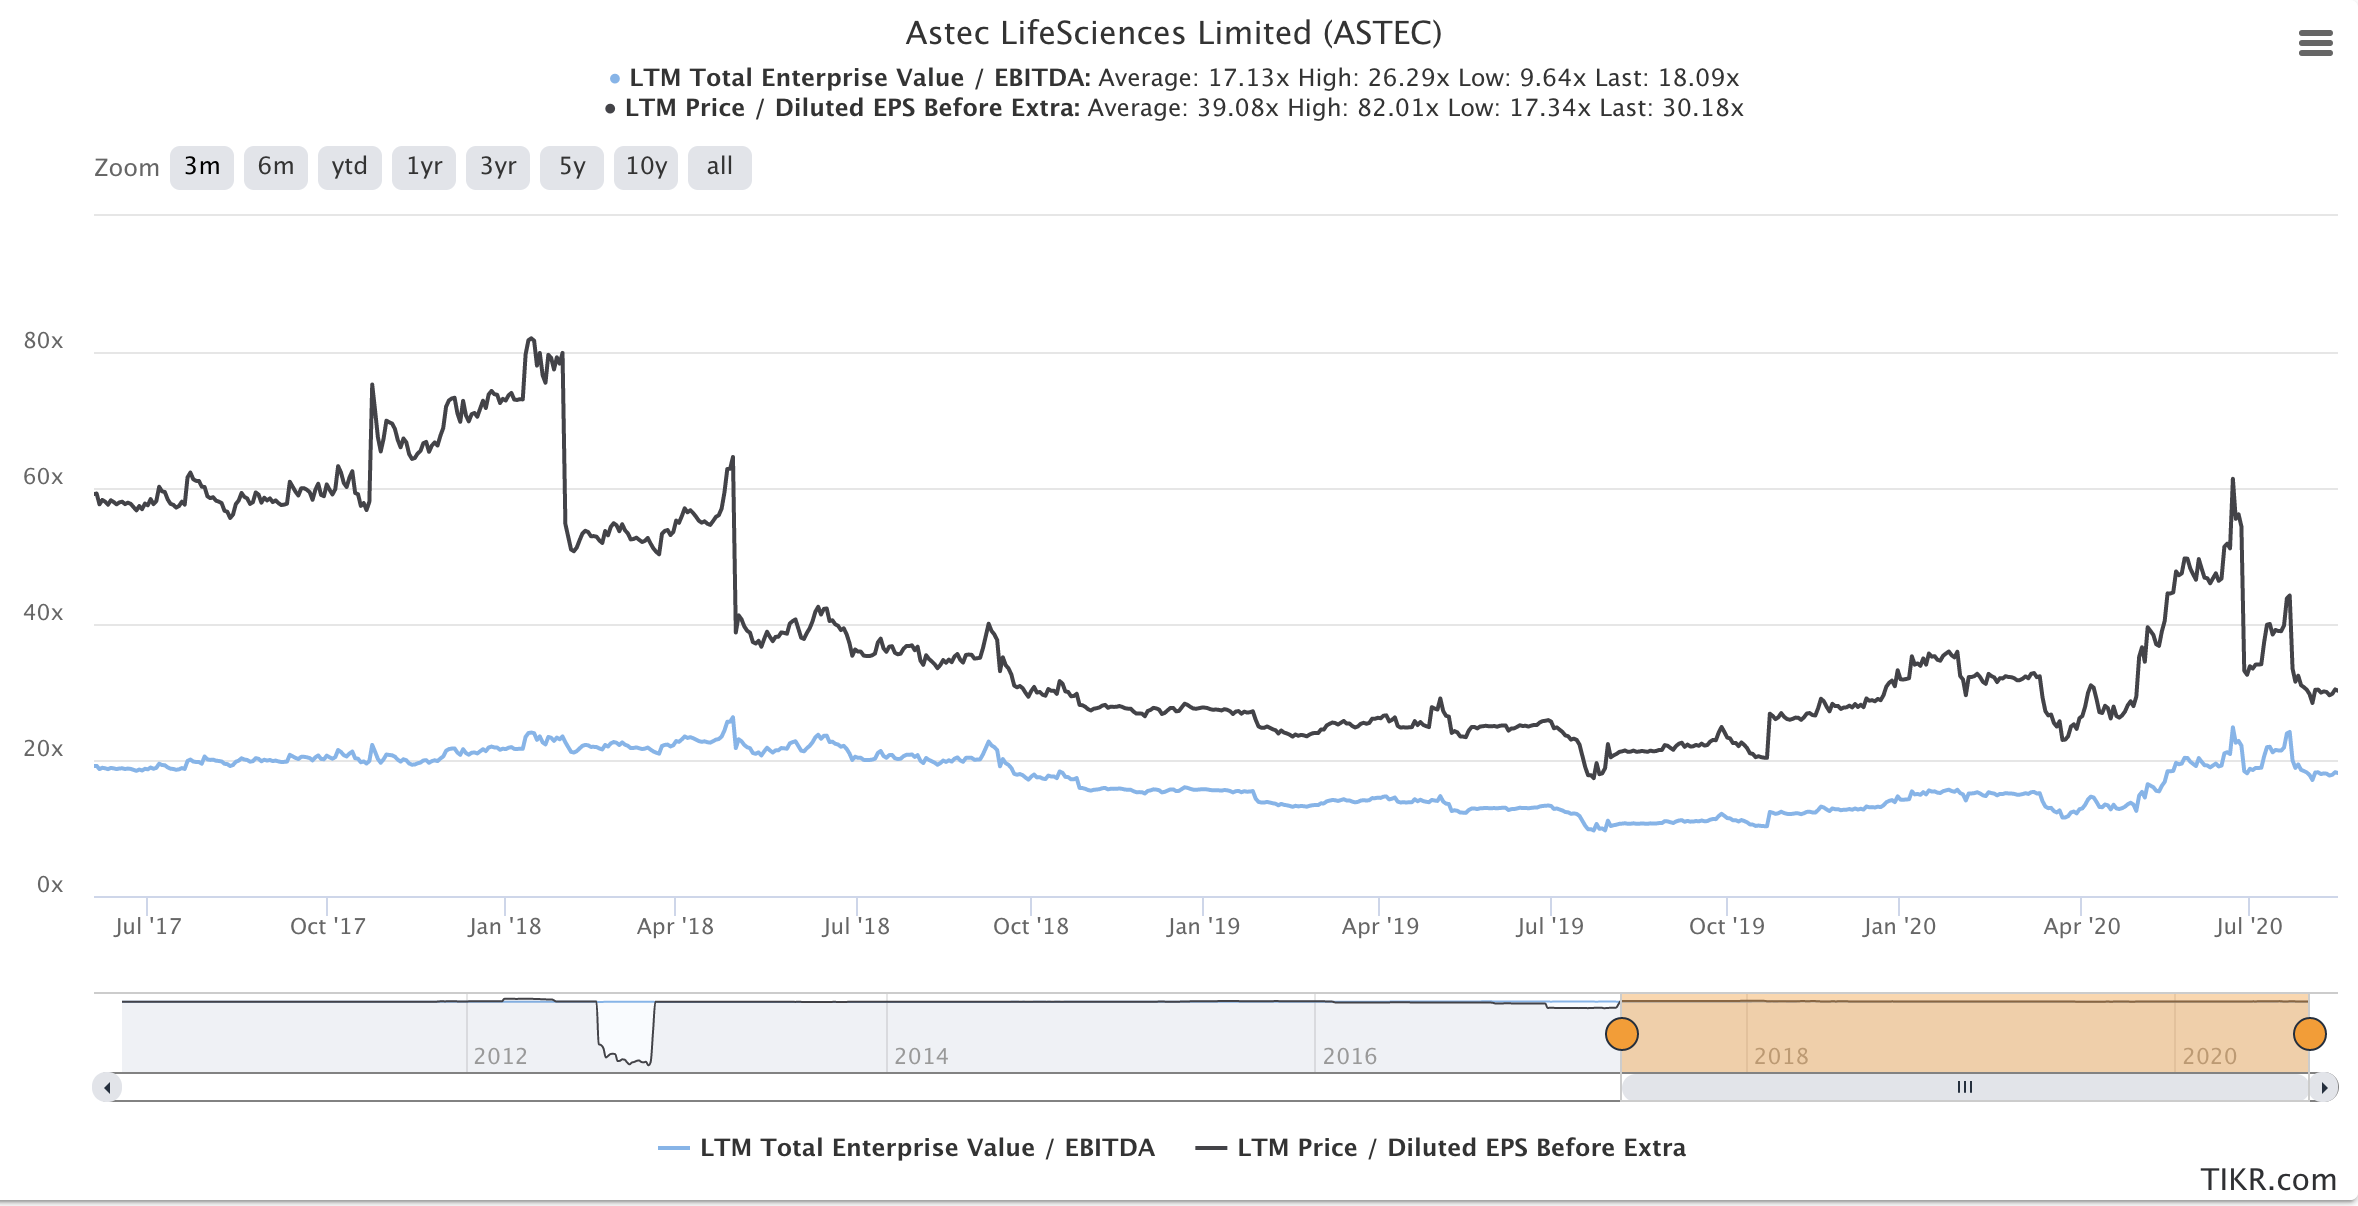
As we can see, it is available much below the average P/E and P/EBITDA multiples.
For comparison, the much larger and much more successful PI industries, is also much more richly valued:
Investment Thesis
- Chemical manufacturing migrating away from China to India (chemical manufacturers adding a backup option) is a secular multi-year trend. China is still the bulk producer and hence better able to utilize operating leverage. As indian manufacturers gain scale, our lower labor costs etc would enable us to become even lower cost producer. In recent Godrej Agrovet concall, management mentioned “So we captured a lot of Southeast Asian market. Russia, CIS market opened up very strongly. That has been one of the growth, and that will be a permanent growth, plus the U.S., Europe market.”
- Astec saw a promoter change in 2016 with Godrej group becoming the majority shareholder. The change in Astec’s management has put the CRAMS business on a strong footing. Technical expertise, credibility and financial flexibility – the three key things that global innovators in agrochemical industry look out for before entering into a contract manufacturing agreement, got a significant uplift post Godrej’s takeover.
- The CRAMS business is a steady business in terms of revenues and profitability. Since the end customers are geographically well spread across the globe, the impact of monsoons and seasonality of sales is limited, and also margins of ~20-22% are much stable on account of the stickiness of the clients, 3 to 10-years tenure of the contract agreement, and complete pass through of raw material cost. The percent of revenues from CRAMS is also increasing.
- The company has completed the design of their new state-of-the-art Research & Development (R&D) Centre, which will result in a quantum jump in their R&D capabilities. This will enable them to diversify the product line-up even more.
- Godrej agrovet (parent company)'s agrochemicals business provides new opportunities for Astec to diversify its product mix. Godrej Agrovet’s rich track record in the Indian agricultural markets will strengthen Astec’s positioning to global innovators.
- I do not mind paying up a little bit for a business with a good promoter, in an industry with strong tailwinds. it would be difficult to get astek below TTM P/E of 20 or below unless there is an overall stock market crash, in which case I would add more, knowing this is a great business.
Key Risks
- Godrej Agrovet could do a merger with Astec lifesciences, and astec minority shareholders would be at the risk of being forced to own a business they do not want to : godrej agrovet.
- Significant portion of revenue is linked to domestic sales which poses a big geographical risk with respect to the stability of the weather/seasons/monsoon/droughts etc.
- Is it richly valued on an absolute basis. This means a lower/smaller margin of safety.
- Chemical industry companies are always at the risk of being regulated from a pollution/environmental point of view (I analyzed these risks for a different company here: Chemcrux Enterprises - A dark horse? - #66 by sahil_vi).
- Since Godrej agrovet is the majority owner of Astec, they could potentially do transactions which benefit the parent company more (force astec to sell at lower margins). Although until now, all transactions have been ‘at an arm’s length’ as far as I can tell.
- We do not know precisely what part of the exports are cia CRAMS which is the most stable business segment because the company does not disclose this regularly in communication.
Disclaimer: Invested. Full portfolio here.
PS: Thanks to @Marathondreams and @YachnaBhatia for discussions offline regarding this post.
Edit:
In the initial post I’d incorrectly assumed that all of the companies exports were via CRAMS. After reading some research reports, I figured out that is not the case. Hence, updated the post accordingly.

 This is great example of promoter who is ready to listen to the minority investors. It is so refreshing in current scenario where minority investors get brushed away with impunity…