Krsnaa Diagnostics - what is the diagnosis?

While presentation is not yet out, Q4 results are assuring on buisiness model resilience

  • Receivables days reduced, one key risk on B2G model was around detoriation on it post covid era
  • Strong Cashflow to EBDITA conversion
  • Strong balance sheet being debt free
  • Healthy EBDITA despite sizable capex in ramp up phase

5 Likes

This was most heartening change for me personally. Risk with b2g business is always receivables. Seems to not be playing out CURRENTLY. With higher diversification of revenue base this should incrementally be headed in the right direction

To be personally most disappointing part was that the revenue has not grown in this Q. I know about covid impact on Q2, but last 3 Q have been stagnant now around 110cr runrate. Co will have to move to 150cr runrate in order to meet it’s 650cr fy23 guidance or come close to it. Question is, when will that happen?

Disclaimer: invested, biased

5 Likes

Last 3 Qtrs for whole industry has been flat, Krsnaa did a good job at margins relative to other players.

Dr Lalpath on concall indicated QoQ flattishness was due to Omicron wave in Mid jan to mid Feb, with March and april being good. we will know more on concall of Krsnaa.

Agree that mgmt guidance of 600 to - 650 cr revenue in FY 23 needs 150 cr runrate.

2 Likes

Krsnaa actually won Punjab contract which i was under the assumption would be productionized partly in Q4. That has not happened

Krsnaa has given 44% growth guidance, not Dr lal :sweat_smile: it’s about setting right expectations with investors If guidance is lowered it results in derating & negative sentiment if they can’t meet guidance, same outcome. Question is how they will grow 44% in fy23

Also, covid is a good excuse for q2=> Q3 bridge. Not Q3 => Q4 for krsnaaa specifically because covid was only 2% of sales in Q3 already

8 Likes

Waiting for concall, not very good margins either way.
I’m also waiting for the topline growth, seems like we are atleast 6 quarters away from seeing sizable operating leverage.

I do think capex should show results in q1.

Disc - invested(largest position)

2 Likes

This is the plan as far as Mar. 22 is consider.

  • Some of the center will start contributing from Q1-FY23.
  • Interesting to see B2C execution in coming quarter. (May be more discussion in concall)

PPT: https://archives.nseindia.com/corporate/KRSNAA_23032022172527_543328.pdf

1 Like


  1. As per the latest, press release COVID business accounted for 7% of annual revenue, which is about 32 cr.
    But as per investor presentation in Q3, 9month revenue contribution from COVID is 39.5cr
    How is this possible ?

  2. I prefer management which under promise and over deliver.
    I just don’t understand why set hyper aggressive growth target.

  3. What happens if operating leverage does not kick in, ie the existing spare capacity is not used.In order to grow they need to expand into newer geography
    B2G business is based on pull marketing strategy.
    (I know demand for diagnostic serves is high but I can’t under why the company has so low asset utilisation).

  4. If above is true, foray into B2C makes sense - in order to increase capacity utilisation.

Sorry if these queries are outright wrong.

Invested at current level (tracking position)

1 Like

Krsnaa actually won Punjab contract which i was under the assumption would be productionized partly in Q4. That has not happened

To be fair they had guided revenues accruing from Punjab only from Q1 FY2023. The following is from the last conf call.

“Yash Mutha: So Punjab as the centers are running up we should see sizeable contribution coming from Q1 FY2023. As we have mentioned earlier, the business will continue to grow and certain of the cost are already absorbed, every additional revenue will start contributing to better EBTIDA. The only thing from a project implementation perspective because Punjab and other centers are getting operationalized so in the initial couple of months the EBITDA will be a bit subdued becauseof the revenue not matching with expenses, but I think over the years they will stabilize with an improvement in the EBITDA margin going forward because our fixed cost has already been absorbed and as we go along every additional revenue will start contributing and adding more to the EBITDA and PAT.”

Topline growth is disappointing, presumably, there would have been other centres being operationalized last year which should have contributed to topline growth in FY22.

Some related news https://www.tribuneindia.com/news/himachal/govt-ends-contract-with-lab-locals-to-lose-jobs-399126

Details of B2C offering can be seen here https://krsnaadiagnostics.com/health-packages/. It is hard to compare this against competitors offerings https://www.lalpathlabs.com/onlinebooking/swasthpackages and Health Checkup Packages in Mumbai at Metropolis Healthcare - Book Blood Test Packages

1 Like

Any pointers towards how I understand more than ten-fold fall in EPS.

Pre IPO vs Post IPO shares dilution to take it public.

Continuing from this post, here’s an updated sector scan:

Topline Q4FY22 Topline Q3FY22 Topline Q4FY21 Margins Q4FY22 Margins Q3FY22 Margins Q4FY21 Covid Revenues Q4FY22 Core Business Growth Q4FY22 (YoY) Price/Sales[1]
Dr. Lal 486 497 431 25% 22% 28% 13.6% 12.2% 8.38
Krsnaa 108 106 96 26%* 29% 35% N/A 70% 3.75
Metropolis 306 293 292 24% 26% 33% 12.41% 7% 7.10
Thyrocare 123 110 139 29% 31% 35% 13.11% -9.4% 6.01
Vijaya Diagnostics 116 111 112 41% 43% 49% 15.4% -2% 8.32
  • (*) Krsnaa’s margins are 28% on a standalone basis, and 26% on a consolidated bases due to 2 Cr. of additional expenses in opening up new centres.

  • Dr. Lal’s margins are a little higher if one adjusts for CSR spend.

  • Dr. Lal, Krsnaa and Metropolis are the only companies to have grown their non covid businesses YoY.

  • Krsnaa’s covid revenue contribution is unknown for this quarter, will fill in post investor presentation. Contribution was 1.1% in Q3.

[1] I like using P/S for the sector as margins, return ratios are different across the pack. EV/Sales will be slightly misleading in this case, as the cash that Krsnaa has on hand will be used towards capex.


The discussion above is around Krsnaa’s new centres. I present a nice way of tracking Krsnaa’s new centres in Punjab:

Remember that Krsnaa has to set up subsidiaries for the centres in Punjab (explained in this post). Now, the standalone revenues for Krsnaa count all revenue from centres excluding Punjab, while the consolidated revenues capture everything.

Therefore, subtracting the standalone revenues from the consolidated figures project out all the revenue contribution from Punjab centres. One can do this exercise for expenditure too to zero in on profitability for Punjab centres.

In Q3, new centres contributed 10 lakhs of revenues. In Q4, new centres contributed 40 lakhs of revenues.

While this is miniscule, it allows us to granularly track how successful the scale up is in Punjab, and as companies are expected to post audited financial statements of subsidiaries, we should be getting a smaller annual report for Punjab centres with granular details.


Now, addressing some concerns in recent posts:

I contend that the standalone EBITDA margins of 28% are marginally third best in the industry according to our sector scan, and in line with Q3. These are the margins that account for 99.6% of the business, discounting the additional 2 Cr. spend on Punjab.

@Dev_S put a lot of effort into this post from three months ago, answering this very question: what happens to the economics should capacity utilisation remain where it is.

Dilution isn’t the full answer. It has to also do with compulsory convertable preference shares, which added on an additional 265 Cr. of income in FY21. Please see this post and relevant discussion:

Nice observation, I’d guess there’s an error in one of the disclosures, or there’s a difference in definitions. We’d need to wait for the latest presentation.


For those that have just started reading the thread, we’ve spent a lot of time thinking about the business, and addressing FAQs higher up. Please acknowledge work done in carrying the thinking forward and take the time to read what’s been said before.

D: invested, as above.

Will edit in KPI like test volumes, revenue per test and footfall data post investor presentation.

33 Likes

Q3 FY22

Q4 FY22

We can see some of the project they mention will be operational in last quarter but now with new presentation they are in WIP. Some discrepancy.

Ex: MCGM Mumbai: As per Q3 → Construction completed 2 and to be operational in Feb And March. But in Q4 that become → 1 become To be Operationalized in Q1 FY23 and another one straight into the construction WIP.

Lets see if management can talk about this. Also point to follow in future presentation.

But like the Q4 PPT, as they are giving more disclosure.

6 Likes

Before we move on to the learnings from the concall, I think it’s important to pause for a moment.

The investor presentation this quarter gave me a lot of important details to some unanswered questions from higher up in the thread.

1. On the RoCE profile of mature centres

An important concern for me was around the RoCE profile and asset turns.

  1. As a reminder, due to the higher receivable days, (and a percentage of payables being vendor financing), RoCE profile would be lower than the industry standard.

  2. Since they’ve been rapidly expanding, a key question for me was what their most successful centre was, and the utilisation / asset turns in those centres. Or in other words, what’s the best case scenario for their newly opened centres, as they mature?

Sahil remarked in this post that the RoCE profile of the business could be in the 30% range, especially from mature centres.

In the investor presentation, we got an answer to these questions, and this observation was very close!

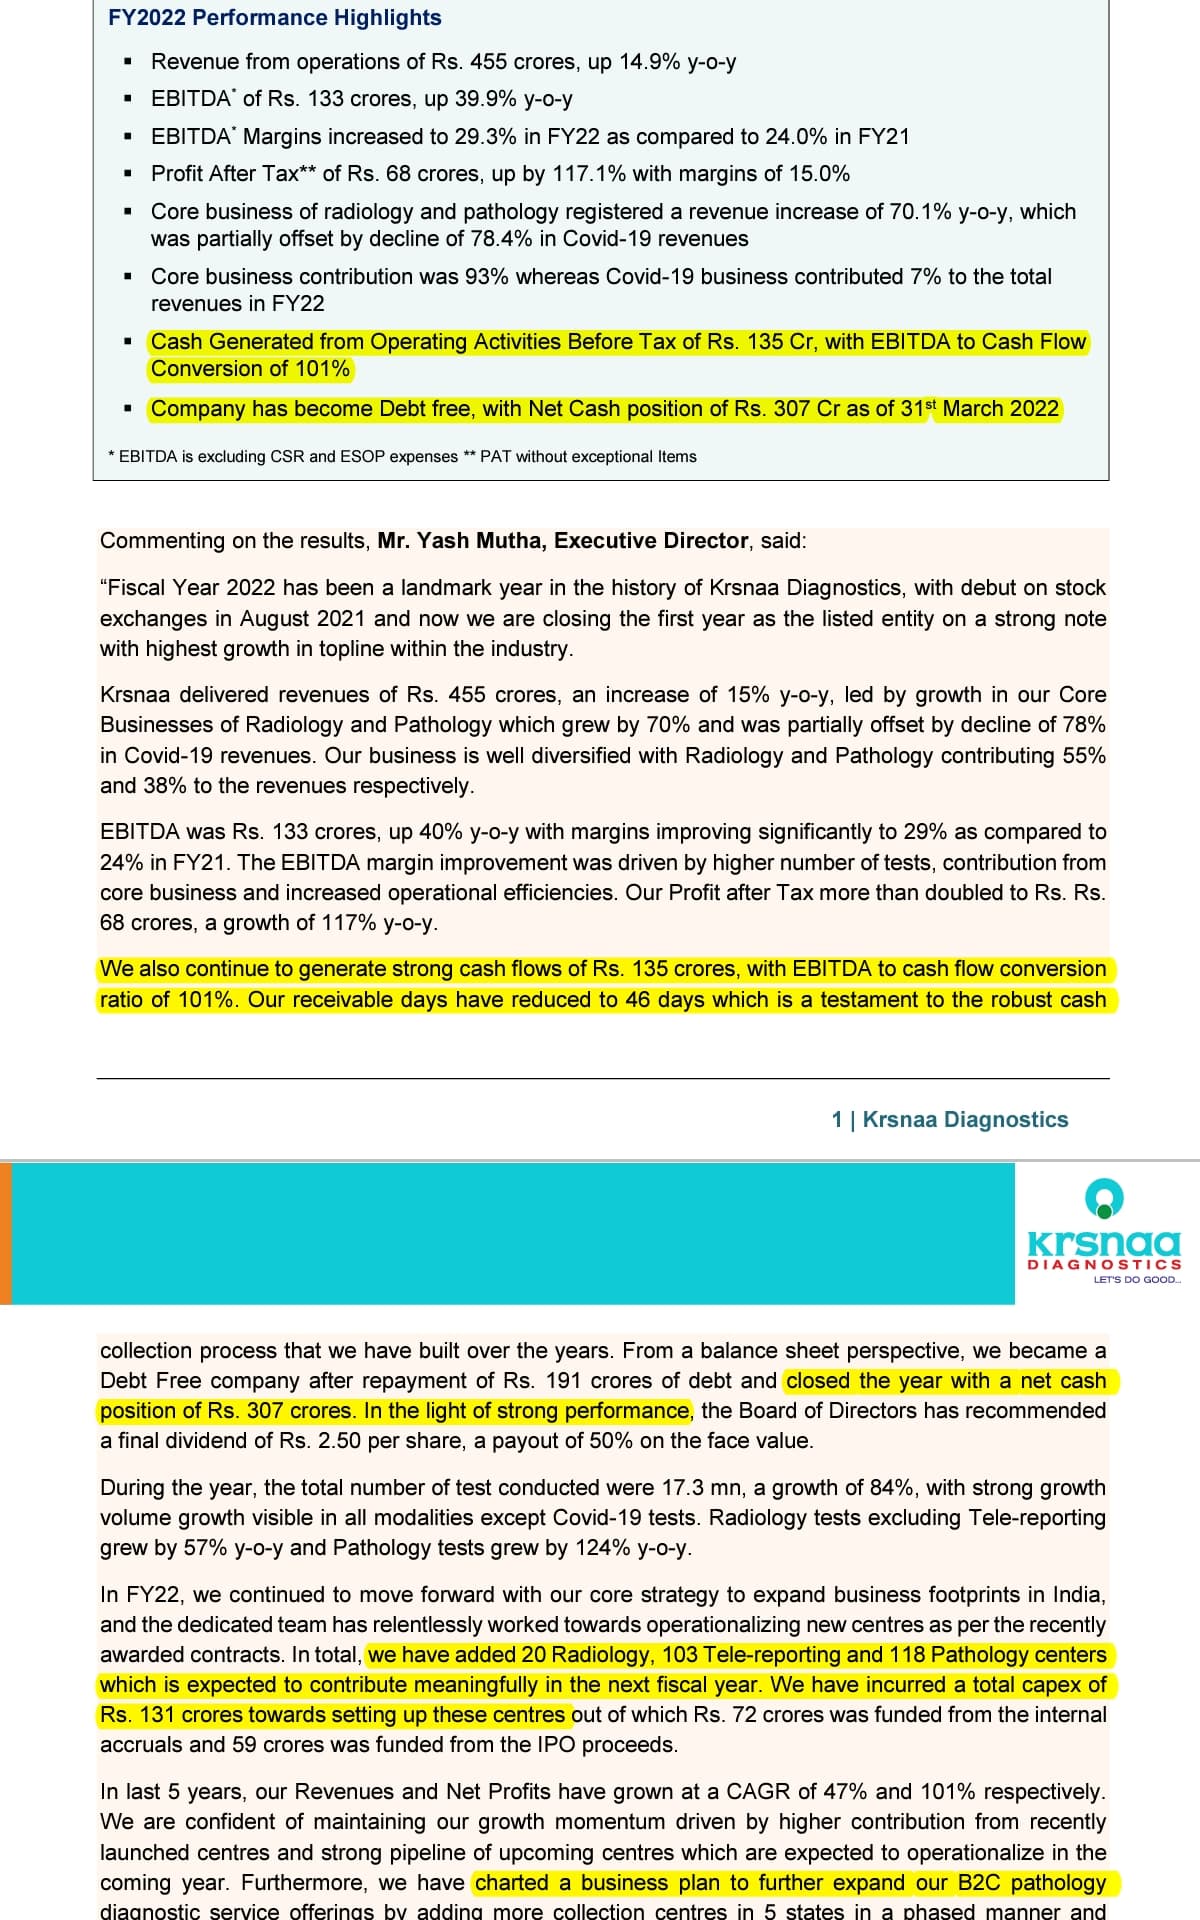
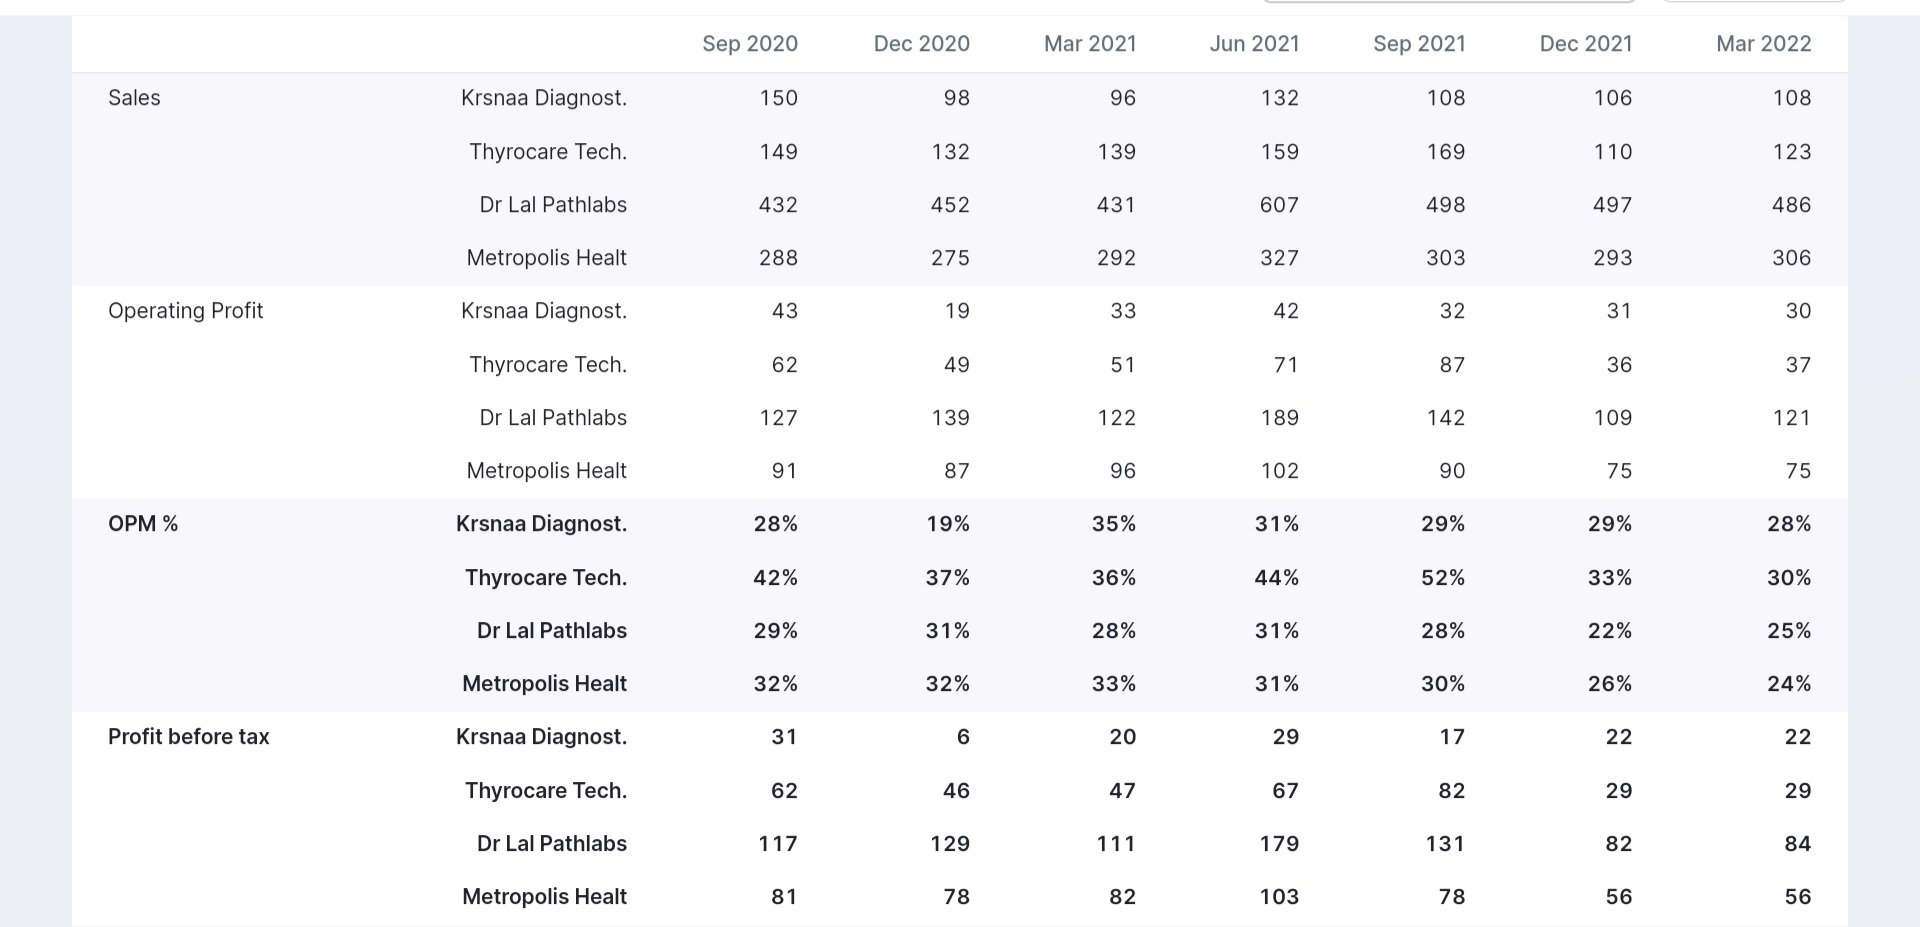
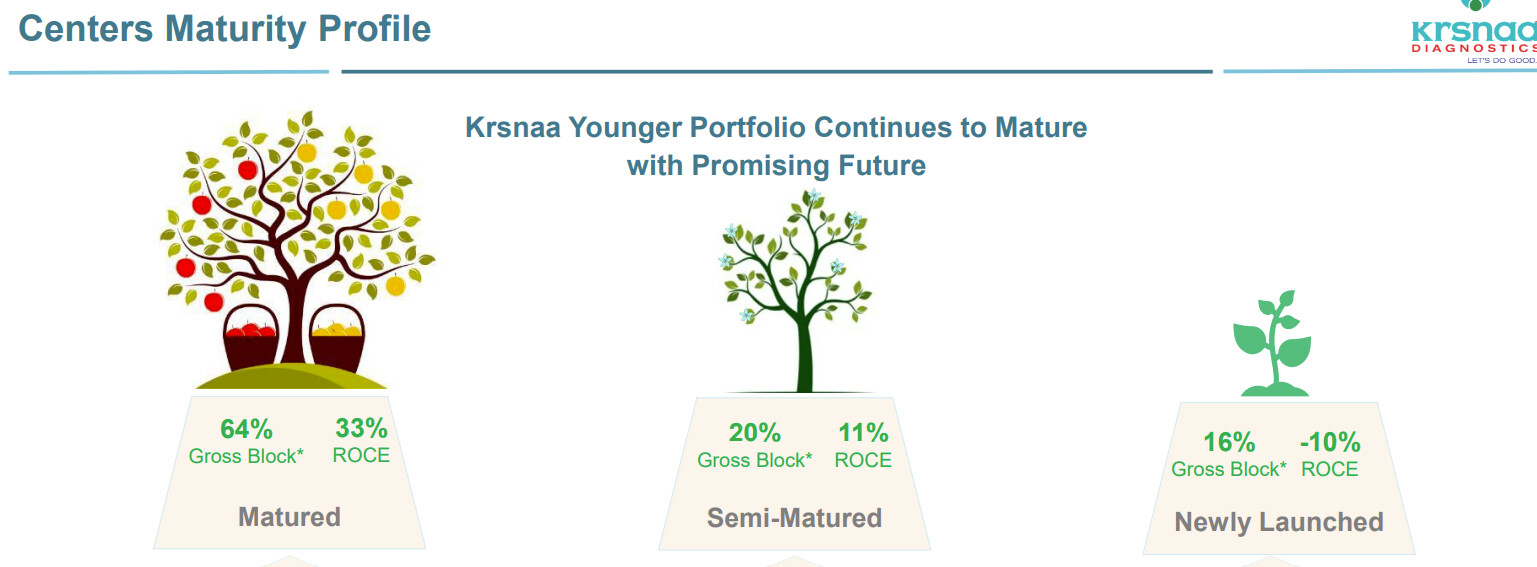
They tell us that the mature centres generated 33% RoCE profiles (in a year where covid revenues were 7% of the pie), and since the consolidated RoCE is 18%, we should be seeing a gradual increase over time as the centres mature, or as operating leverage kicks in. This is in line with Dr. Lal that puts out 32% and Metropolis’ 28.5%.

In addition, there’s been a downward trend in receivables, but this has been pointed out in previous posts.

2. What about 1mg and the competitive landscape?

There are two answers to this question. On the difference between rural/urban competition, and pricing.

We know that Krsnaa has a radiology mix that traditional pathology players don’t offer. I’m uncomfortable with the characterisation currently on Twitter that 1mg and Healthians have priced tests so low that it’ll run all the other players (including Krsnaa) out of business, or will hurt their margins.

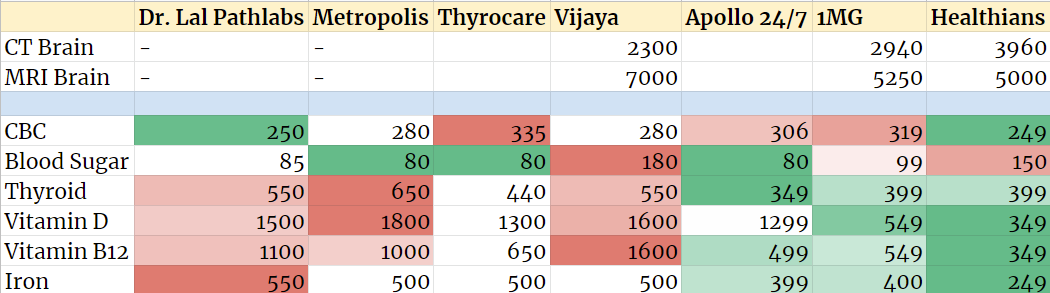
Here are the prices of some common path tests taken. I took the prices off the websites for these different players and I’ve colour coded them to differentiate between cheap and expensive providers. Take a moment to notice how 1mg and Healthians offer much better rates on tests like Vitamin B12, Vitamin D and Iron. Thus, the observation could be true for the players offering tests marked in red.

This is where nuance is important. Here’s the same price list, but now with Krsnaa included:

It’s clear that 1mg and Healthians lower pricing is nowhere close to the offering Krsnaa brings. If we’re calling Tata 1mg and Healthians disruptors, Krsnaa belongs to this list.

Here’s the second bit of nuance. Metropolis’ investor presentation (based on a report from Bain) tells us that price isn’t everything. An analysis on just price is unlikely to be accurate, and it isn’t the sole determinant of success.

Focus on the top half first.

  • Note how doctor recommendations in urban areas is important for acute illnesses. Price isn’t on the map at all.

  • For chronic and preventative illnesses, convenience takes top priority.

Now for Krsnaa, the bottom half of the page is relevant.

  • Doctor’s recommendations are important in non-metro cities, and Krsnaa has a presence in government hospitals, the first port of call.

  • Price now plays a more important role in preventative and chronic illnesses.

  • The relationship with the lab, convenience, are soft data points (apart from things like Google reviews, and data derived from footfall like repeat customers).


It’s really interesting that two different companies have different strategies on beating new entrants with attractive pricing. This is a nice live case study (as is the paints industry) as @Worldlywiseinvestors has been writing about to see which of these strategies wins. Lower pricing vs. the doctor’s recommendations / branding…

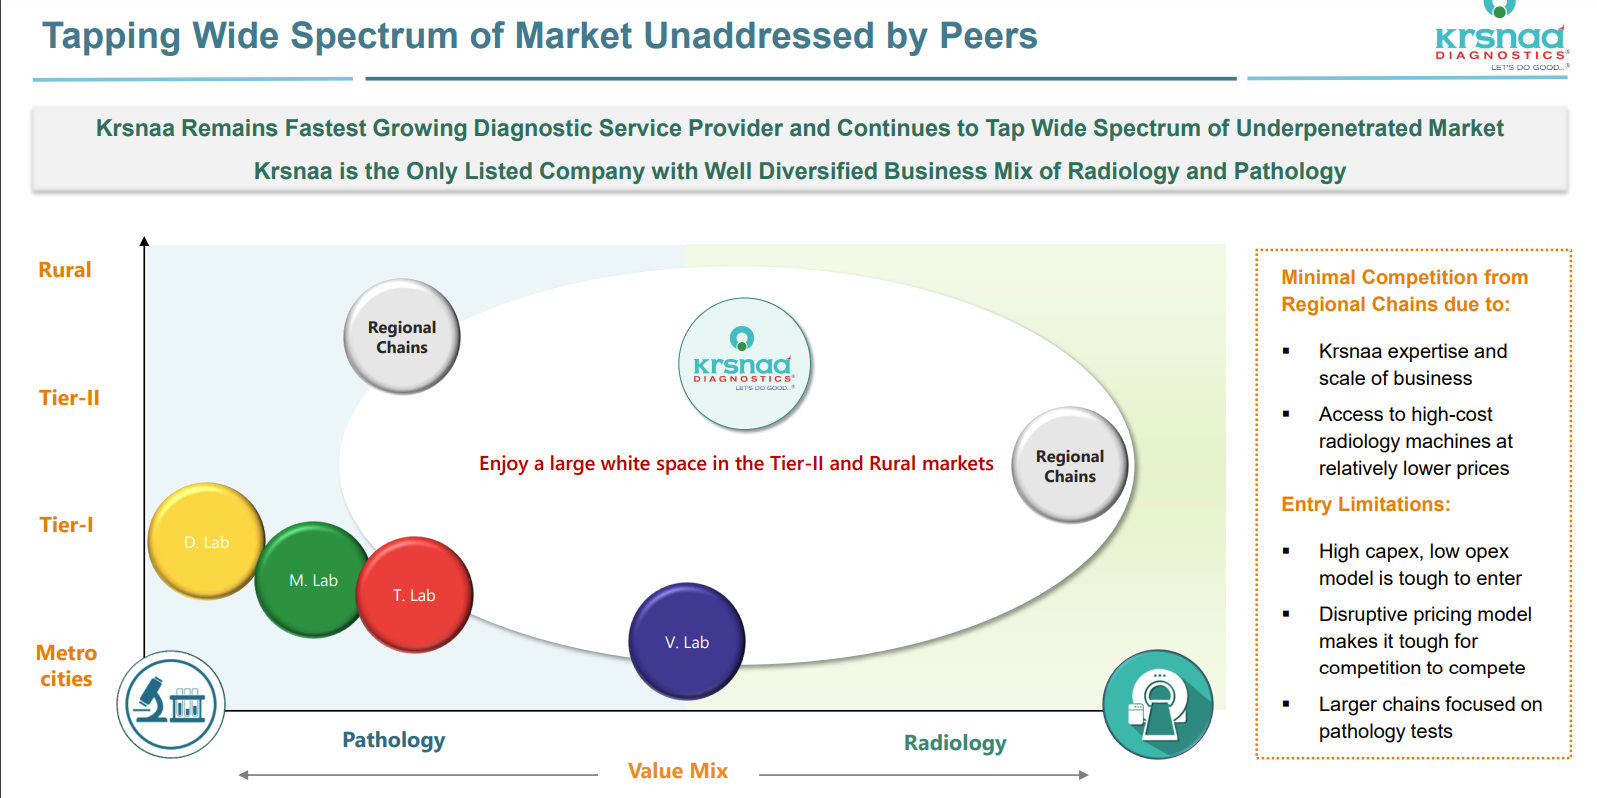
Krsnaa’s investor presentation wonderfully captures the whitespace it is targeting:


For a brilliant page by page by page walkthrough of the investor presentation, please see @sahil_vi’s thread on Twitter:


37 Likes

I had some doubts about Krsnaa’s proposed retail market expansion aka B2C strategy. It is a bit clear for pathology tests as samples for these are collected at home and one can justify added costs, but just a bit unclear about how B2C would work for radiology. Does anyone have thoughts on this, will try asking investor relations too?

  • Are there any clauses in the PPP contracts that prevent Krsnaa from differential pricing or charging convenience fees for collection? I saw the mention of a 20% convenience fee in one of the broker reports.

  • If there is a percentage-based convenience paid to the collection/pickup point partner, why would a partner choose Krsnaa over one of the other providers whose test rates are higher?

  • Will Krsnaa be utilising centres in government hospitals and existing private hospitals to serve B2C patients?

  • Pricing Walkins vs. B2C - in the previous presentations you mentioned that the same price was charged to both government hospital referred patients vs. walk-in (Except for Pune). If so how will be the additional expenses for collection network/pickup points/KBAs met?

  • Pricing Radiology - How is the pricing set for the B2B offering as compared to the walk-in radiology patients? Presumably, they have to come to the same centers for carrying out the scans and can see the walk-in price list?

  • Is Krsnaa going to offer referral fees or other incentives to doctors?

  • Is the B2C test menu and pricing the same across states? How does this work if the rates on different PPP contracts differ.

  • Are the health packages part of the B2B offering Health Packages - Krsnaa Diagnostics - Radiology, Pathology & Teleradiology in Pune?

  • Are Krsnaa margins going to be the same for walk-in vs B2C customers?

3 Likes

Market has been brutal to Diagnostics sector as visible in below charts since last Oct 21 when markets peaked,

Last 1 month view( post Q4 performance) - Krsnaa outperformance relative to sector is visible. Given the uncertainties all around, collective wisdom of market is telling us something. Sound fundamentals ( Krsnaa) and pessimism around sector, good cocktail for investors? We may have a big winner on our hands - we will know by Q1 or sooner depending on market mood.

While PPP is core biz and need to deliver QoQ in line with guidance ,
Something to track on B2C front ( given their B2C push is a clear driver for operating leverage and rerating over med term, if they succeed given lowest cost advantage)

Invested

14 Likes

2x Capacity in radiology but tests conducted went 5x during this period. Ideally in such a scenario margins should expand but it didn’t because realisations in radiology more than halved. What explains this? Pardon my ignorance. I haven’t read anything on this company besides what is available on this thread. Really good discussion though. Got me interested

2 Likes

Take centers as front end, Utilization is on actual MTI and CT scan machines and each has a theoretical capacity, recent Qtrly presentation and thread above has latest and earlier data on same.

Margins are at consol and given rapid expansion they do, new asset ramp up is compensated by mature asset Utilization hence at consol they may look flat.

Realization drop isnt right, key aspect of their biz model is discounted rates from mkt to sattt with and every year marginal increase per contract. Understanding mix is imp e.g. High no of Xrays in mix will dilute realization.

6 Likes

I am aware margins are at consol level but nothing about growth in pathology tests stood out. I get that new centers supress overall margins but when I saw a 5x jump in radiology tests vs 2x in capacity i assumed that there had been significant ramp up in utilisation across centers. anyway i found the answer. Thanks

1 Like

Recently found out that Dr Lalpathlab offering some common blood tests like fasting sugar, HbA1c, cholesterol level at Rs 10 each. Myself underwent tests.

Disc: Not invested.

1 Like

These rates are entry strategies and code is activated only on weekends.

It helps them to make an entry in new areas and gives the CC partner a good chance to negotiate with society to conduct camps.

3 Likes