
Sharing some reading I’ve done on recent news.
Krsnaa won a tender in Himachal Pradesh:
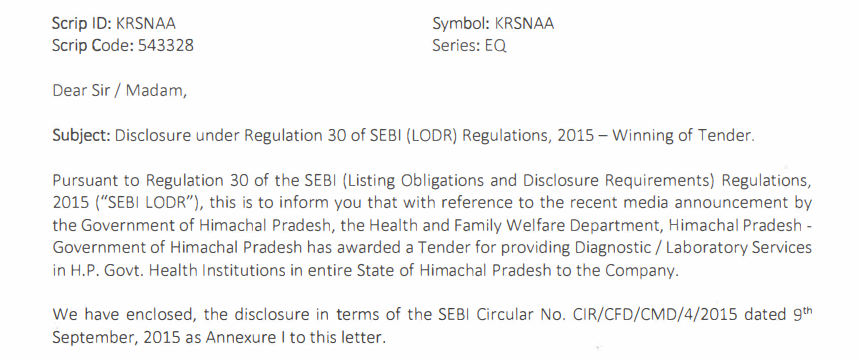
Notice the wording of the release, it’s for diagnostic/laboratory services, with no mention of radiology. I found this tender from a few years ago that I believe is the same one as the wording and tenure matches with the exchange filing:
Details:
- Contract has been won for 5 years.
- Tender requires setting up pathology clinics in 50+ government hospitals based on hub and spoke.
- There are no price hikes in this specific contract.
- Contract stipulates receivables will be settled monthly.
- Details of path works are mentioned in the tender.
If this is the same tender mentioned in the exchange filing, it becomes very interesting as Krsnaa already has a presence in some of these hospitals for radiology work.
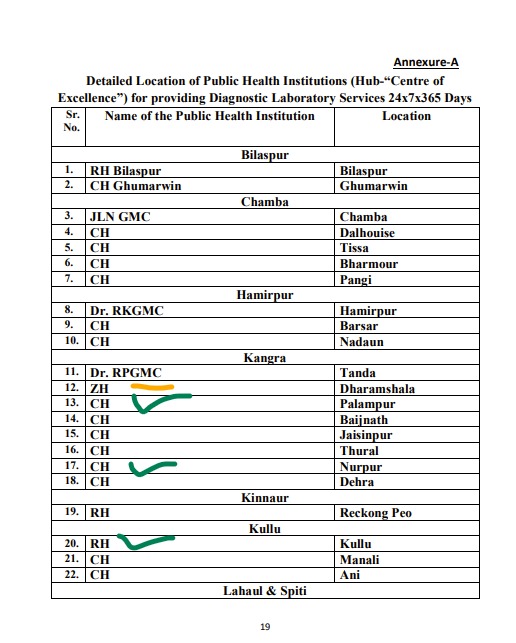
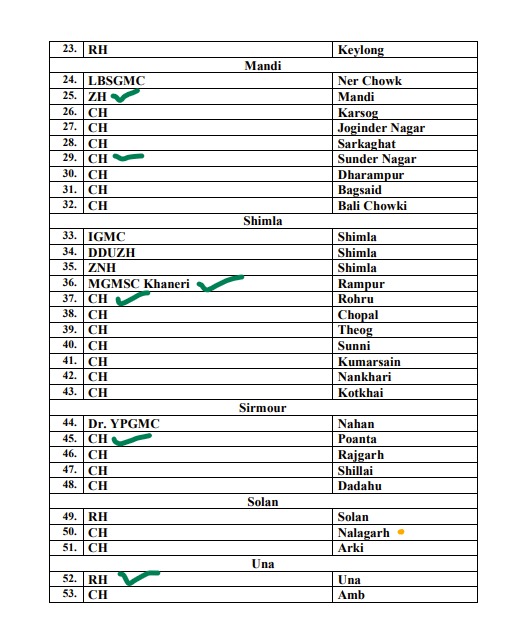
Krsnaa has a radiology center set up in the centers marked green. Yellow indicates that they have a presence in the same district, but at a different hospital. (Edit - they’ve also just inaugurated a center at Bilaspur, #1 on this list.)
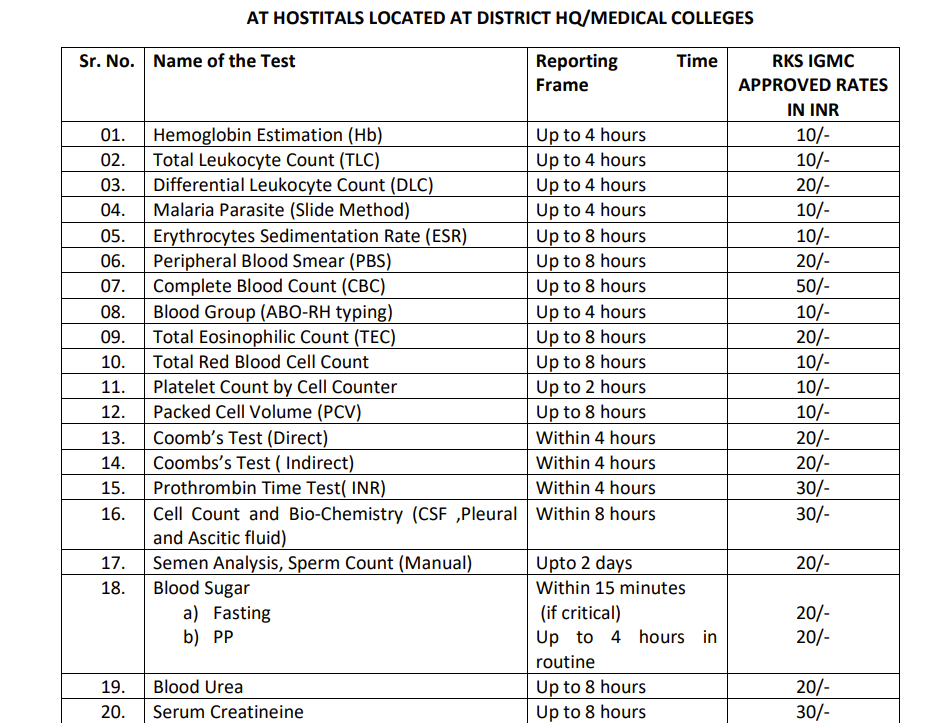
Now, radiology tests have lower volume but high realisation per test, while pathology tests have high volumes and low realisation. Here are the benchmarked prices that Krsnaa had to discount in order to win the tender:
These prices are lower than what Krsnaa has offered in Pune:
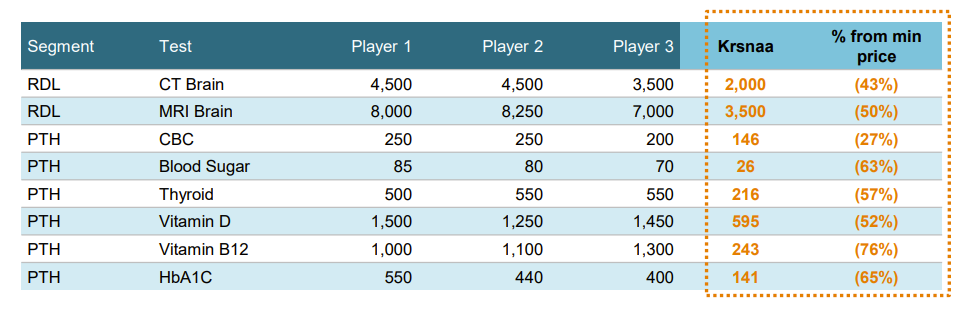
Note that the price for a CBC in Krsnaa’s presentation is Rs. 146 (Pune), while the IGMC benchmark in Himachal Pradesh is Rs. 50. IGMC benchmark price for a CT scan is 1500, so one would need roughly 30 CBC tests to offer the same revenue as a CT scan, before considering operating costs. I also believe that path works are bundled together, and often patients don’t undergo one singular test, but 2-3 to make a diagnosis.
Thanks to @Dev_S and @sahil_vi for adding so much value to this thread and more exposition on thesis/anti-thesis pointers.
Screener’s PE calculations for Krsnaa are currently based on FY21 numbers, not trailing twelve months. Note how there was a huge loss in FY20 followed by a significant entry in the other income for FY21. These were due to a one off (two off?) issue compulsory convertible preference shares, and won’t be seen again.

Due to the extra 265 Cr. of income in FY21, the PE looks like it’s in single digits. In reality, if we ignore the other income entry, we’ll have a realistic picture of what we’re paying. FY21 without the other income would have a PAT of ~20 Cr. Against a market cap of 1868, this is an FY21 adjusted PE of 93.4
Now, Q3FY22’s PAT was 17 Cr. This is a steady state quarter since we don’t have covid revenues, and we don’t have interest payments. Annualising this through FY23 gives us an FY23E PAT of 68 Cr., against a market cap of 1868 Cr., or a PE of 27.5. If we think Q4 and Q1 will offer better realisations than Q3FY22, (or in other words management delivers 600-650 Cr. topline) PAT can be significantly higher than 68 Cr. in FY23…
PS: I believe they’ll do around 68 Cr. of PAT in FY22 itself, so FY23 should have 68 Cr. as a base, and we can consider FY22E PE to be 27.5…