
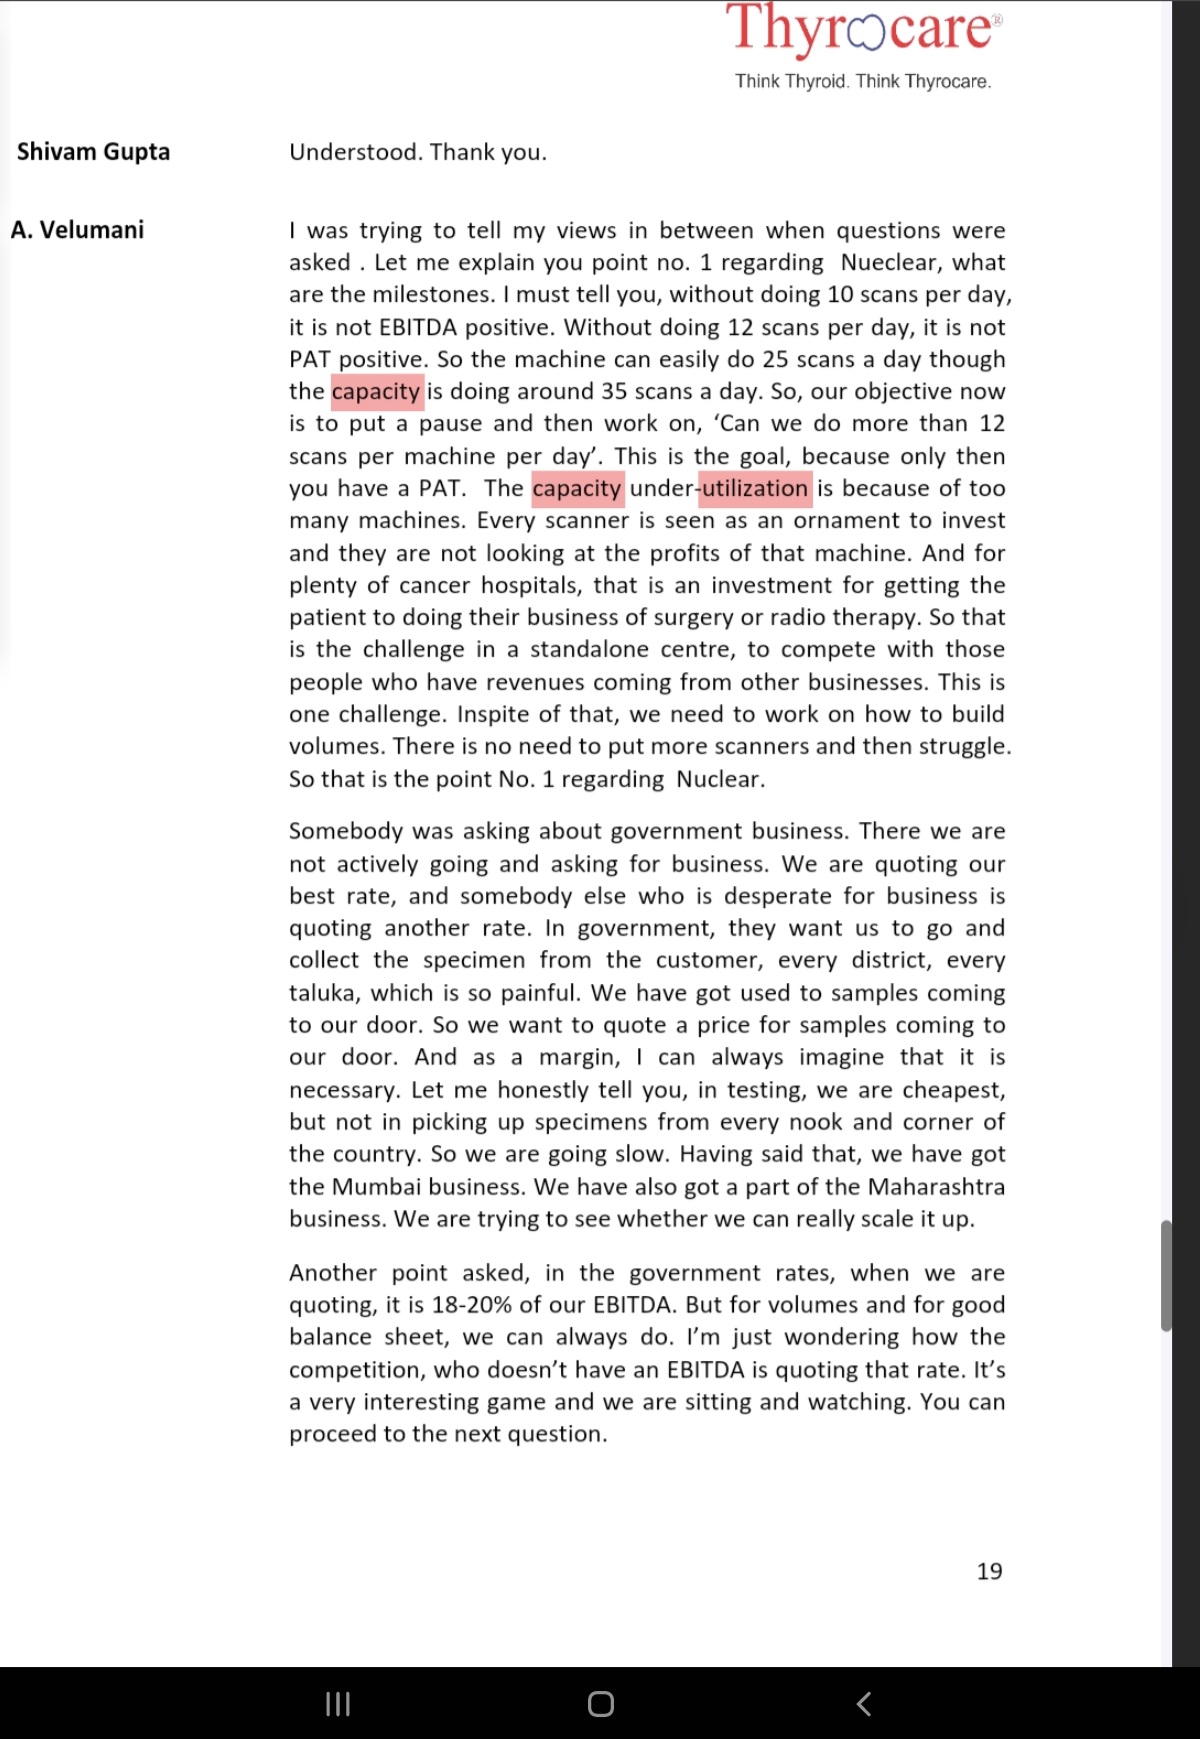
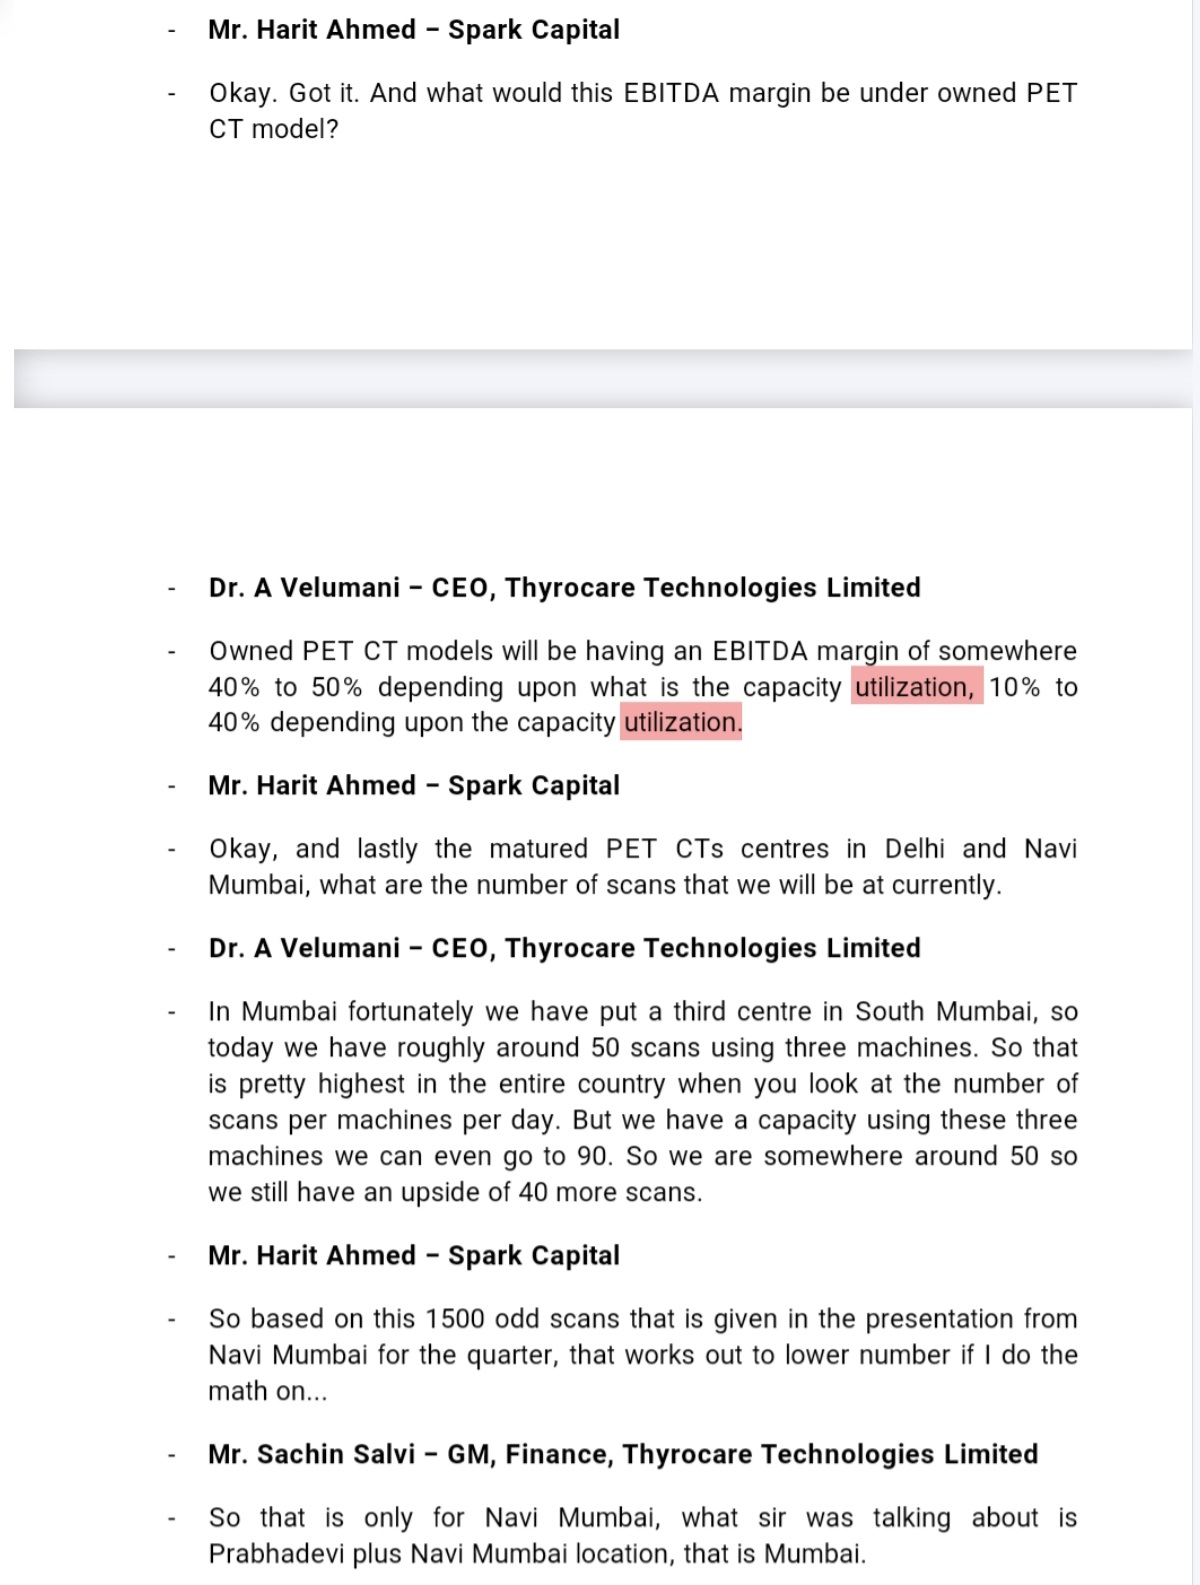
- Capacities utilization - peer view - Dr Velumani( Throcare) has shared some good insights on Radiology capacity utilization model, Govt business uniqueness( and admitting lower EBDITA for their way of working)
-
Another observation from Velumani response in above on Govt business being low margins and model challenges is equally imp to appreciate Krsnaa model success
-
Capacity utilization in Radiology seems to be low as model itself, and still possible to do healthy margins- Thyrocare view here
-
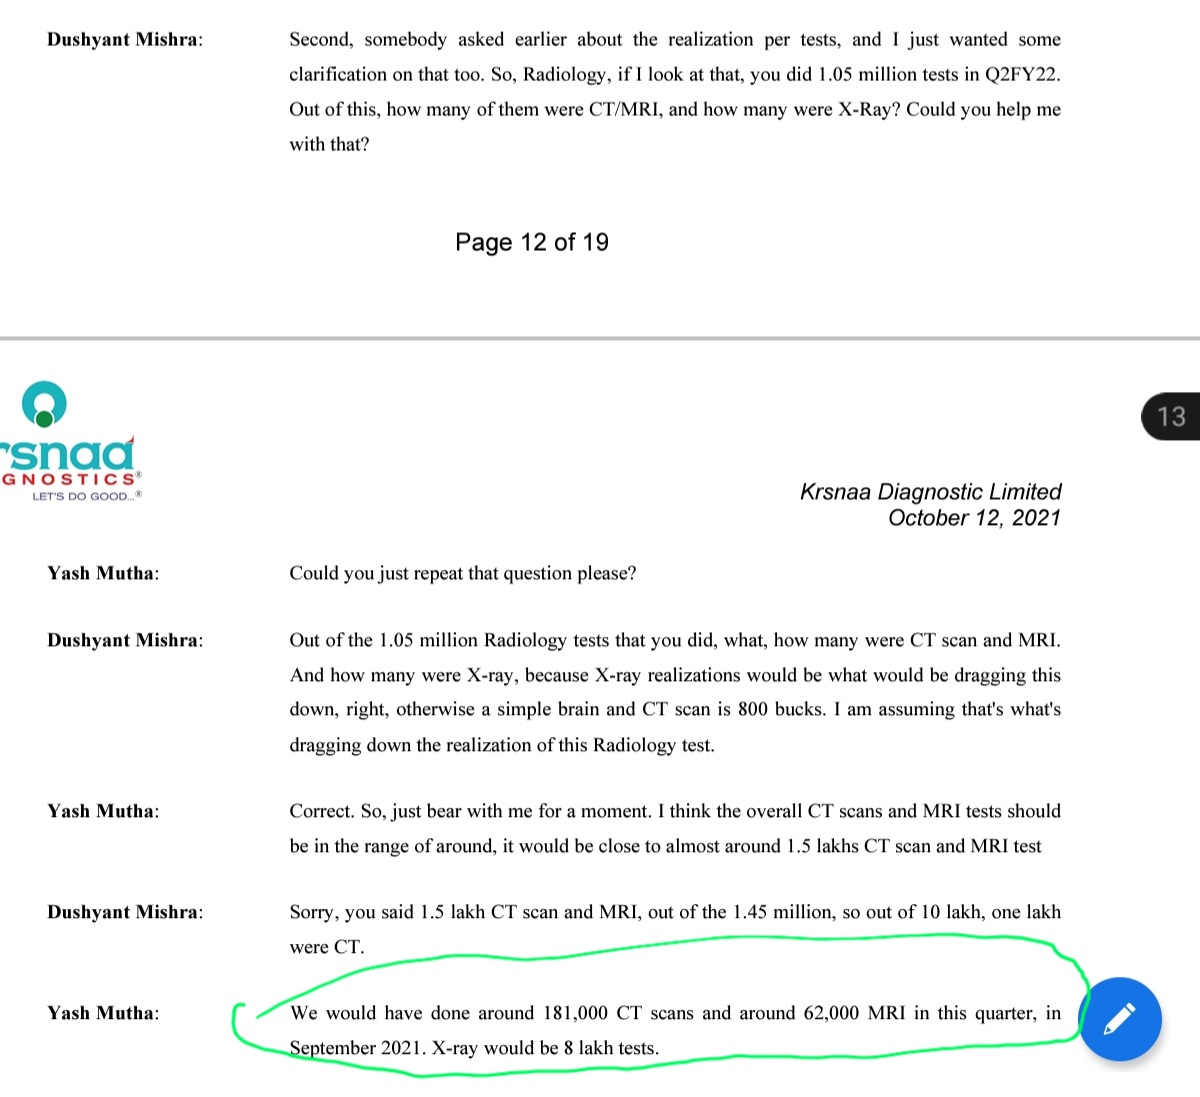
Lest see if Krishna used capacities alright - in Q2 22 Krisnaa had 65 CT machines and they did total 181000 CT scans in 90 days, I.e. average 2000 CT scans per day , 30 Scans per CT machine per day = now compare that to Thyrocare commentary of peak 90 scan capacity by 3 scanners. Krsnaa seem to have got execution right as those who follow Thyrocare, their Radiology business was considered a mis allocation due to losses pre corona
Krsnaa historical performance Capex vs Margins - Capacity utilization - Test realization vs EBDITA
-
Now let’s see their growth trajectory pre corona and how it impacted margins, remember key growth focus is Radiology as shown
-
2018 to 2020 - near 2X capacities in Radiology ( centers, equipment) and still margins were 28% vicinity - magic lies in no of tests and utilization **
-
Let’s revalidate if current Equipment base utilization and FY 2020 are comparable
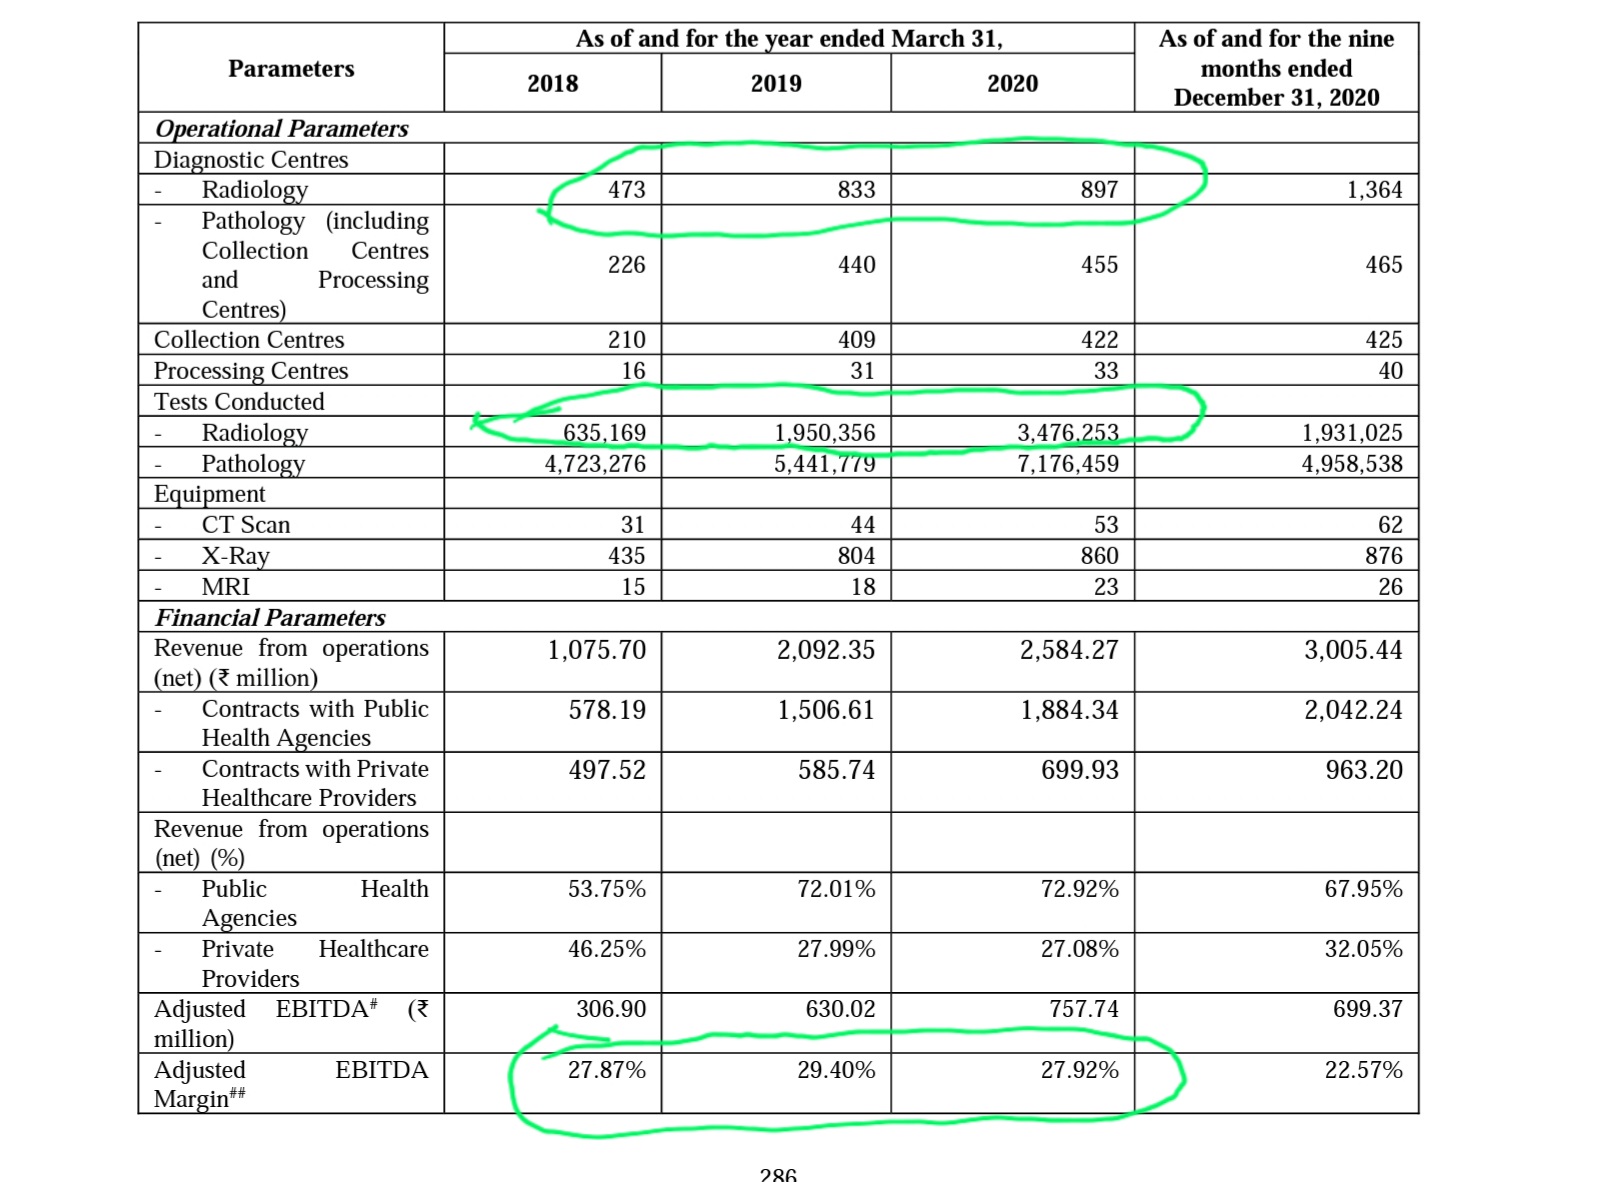
3.5M Radiology tests in FY 20, 4.2M Radiology tests ( Q2 22 annualized ) - Given similar capacity increase( e.g. FY 22 - 53 CT & 23 MRI - 65 CT & 30 MRI now)
- Let’s do another validation on capacities utilization vs theoretical through put possible
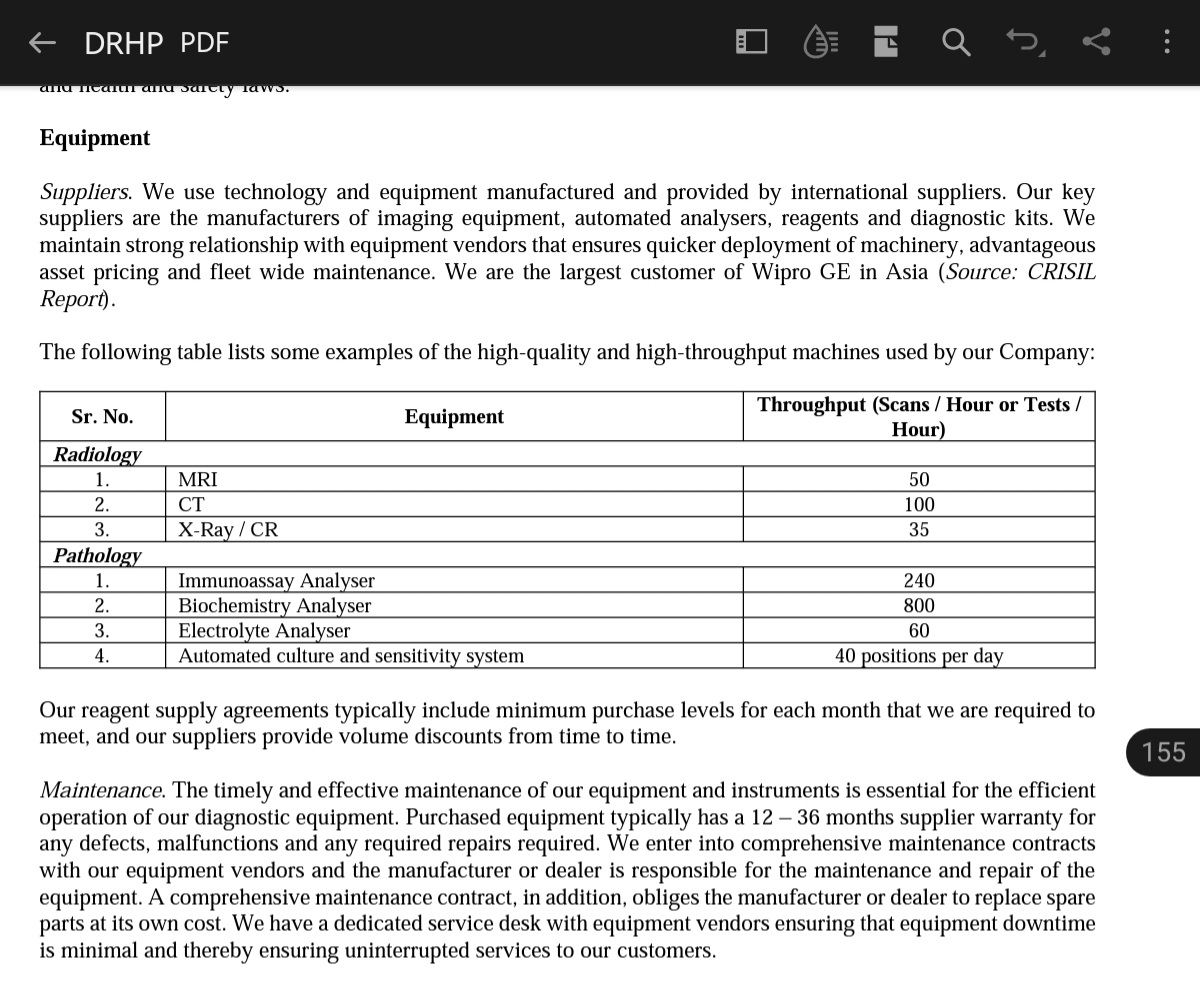
CT scan they are doing 181000 in Q2 on 65 CTs = 30 scan( against benchmark of 100)
MRI scan they are doing 62000 in Q2 on 30 MRIs = 23 scans( against benchmark of 50)
Significant upside of operating leverage, also considering the Pune central model making scale in terms of Radiologist non linear.
-
Blended realization and co relationship with EBDITA - Let’s also see blended realization trend in FY 18, 19 ,20 was respectively 200, 280, 250. Same in Q3 22 is 230. For these periods EBDITA is 27.9, 29.4, 27.9 and 30%+ currently - there is certain degree of range consistency - irrespective of growth capex.
-
How to see if current round of expansion will/will not affect margins - by Q4 22 from IPO proceeds they are adding 29 CT & 8 MRIs - thus approx 40% and 25% respectively capacity increase - we know that they did 181000 CT & 62000 MRI in Q3 at current capacities.
Key monitorable will be corresponding growth in tests with some lag, and short term quantum of EBDITA in ramp up phase - in past margins in growth spikes have been stable at annualized basis