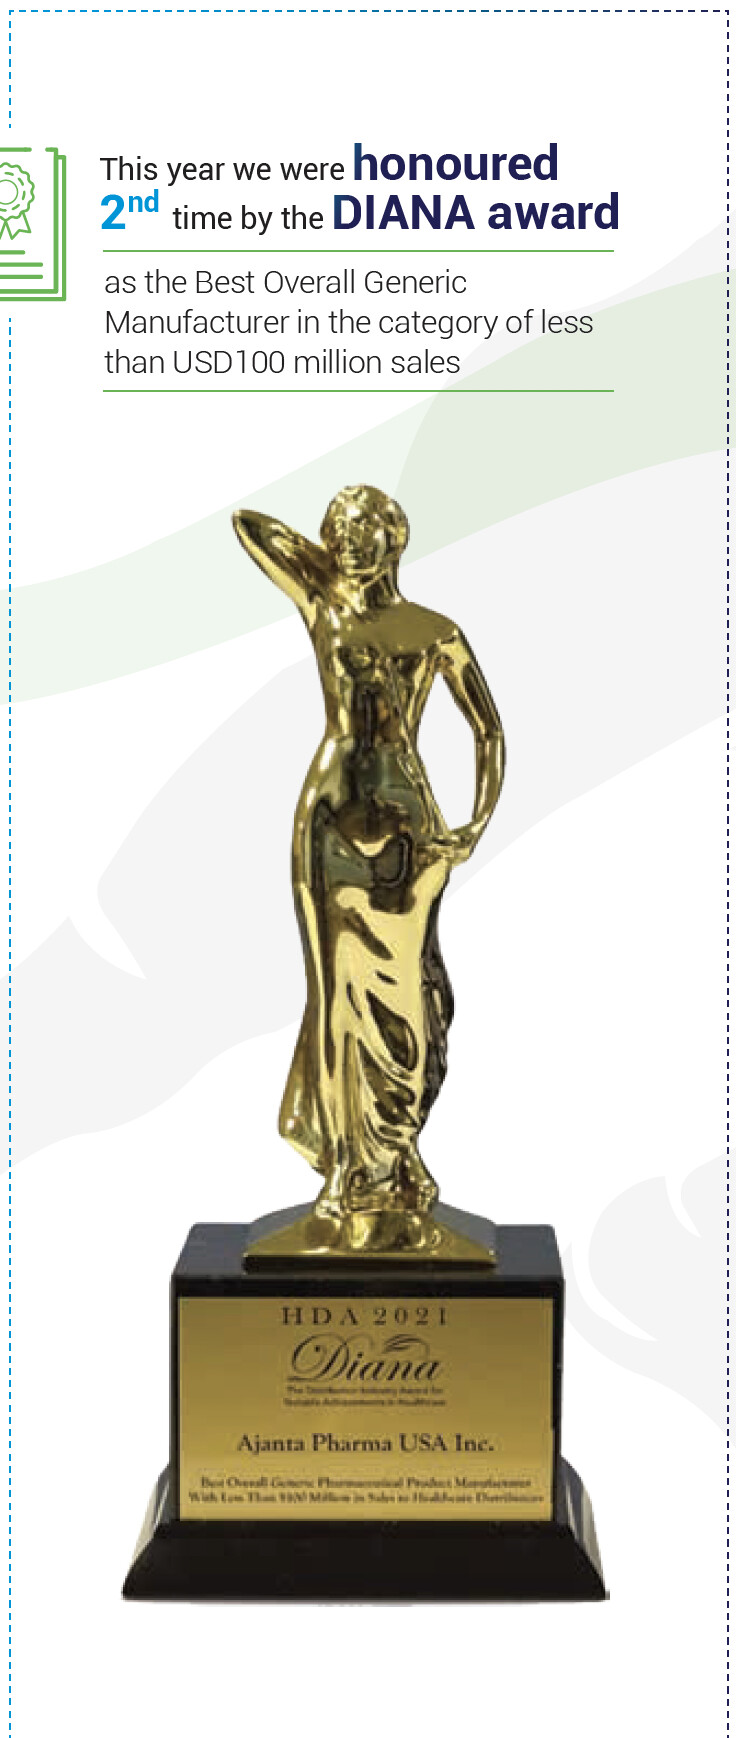
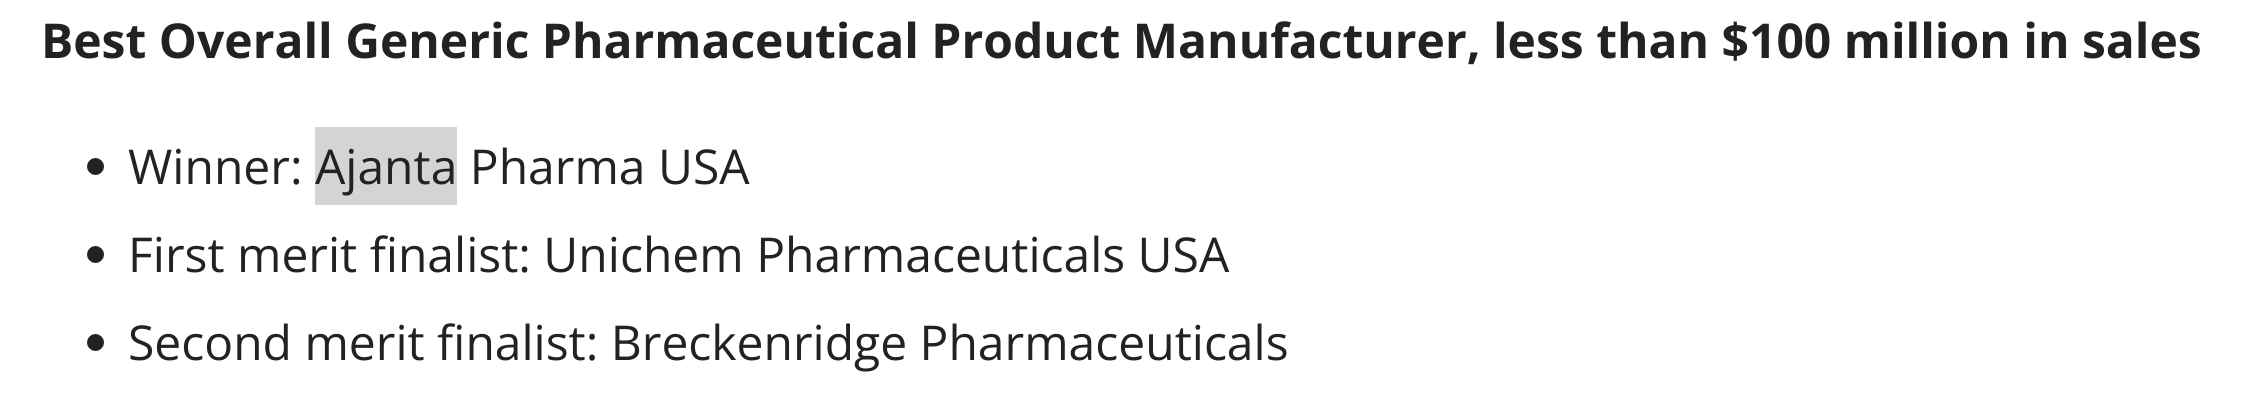
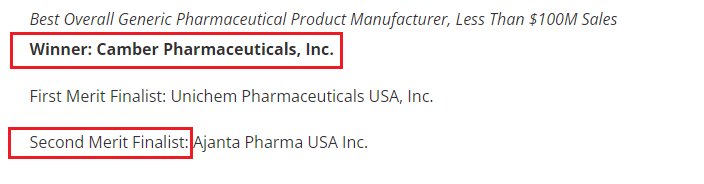
What they have mentioned in the Annual Report may be slightly misleading as they are the second finalist ![]()
HDA Recognizes Pharmaceutical and Consumer Product Manufacturers With DIANA Awards
What they have mentioned in the Annual Report may be slightly misleading as they are the second finalist ![]()
HDA Recognizes Pharmaceutical and Consumer Product Manufacturers With DIANA Awards
The award mentioned in the annual report is for 2021. If you look carefully at the picture shared in the annual report, its mentioned that the award is for 2021. The 2021 links are also below.
For 2022, the prize has gone to Camber, as shared in your link.
Another strong set of results from Ajanta, sales grew at 27%, there was margin compression which led to PAT being flat. Management is confident of getting back to 25-26% EBITDA margins in FY23. Notes from concall below.
FY23Q1 concall
Disclosure: Invested (position size here, no transaction in last-30 days)
Probably a elementary question, what does “tentative approvals” mean here chief ?? @harsh.beria93
In tentative approval, your molecule is approved but you can not market it as there is existing patent/exclusivity for that molecule. You can start marketing as soon as patent expires.
Insightful ratings report (link)
Disclosure: Invested (position size here, no transactions in last-30 days)
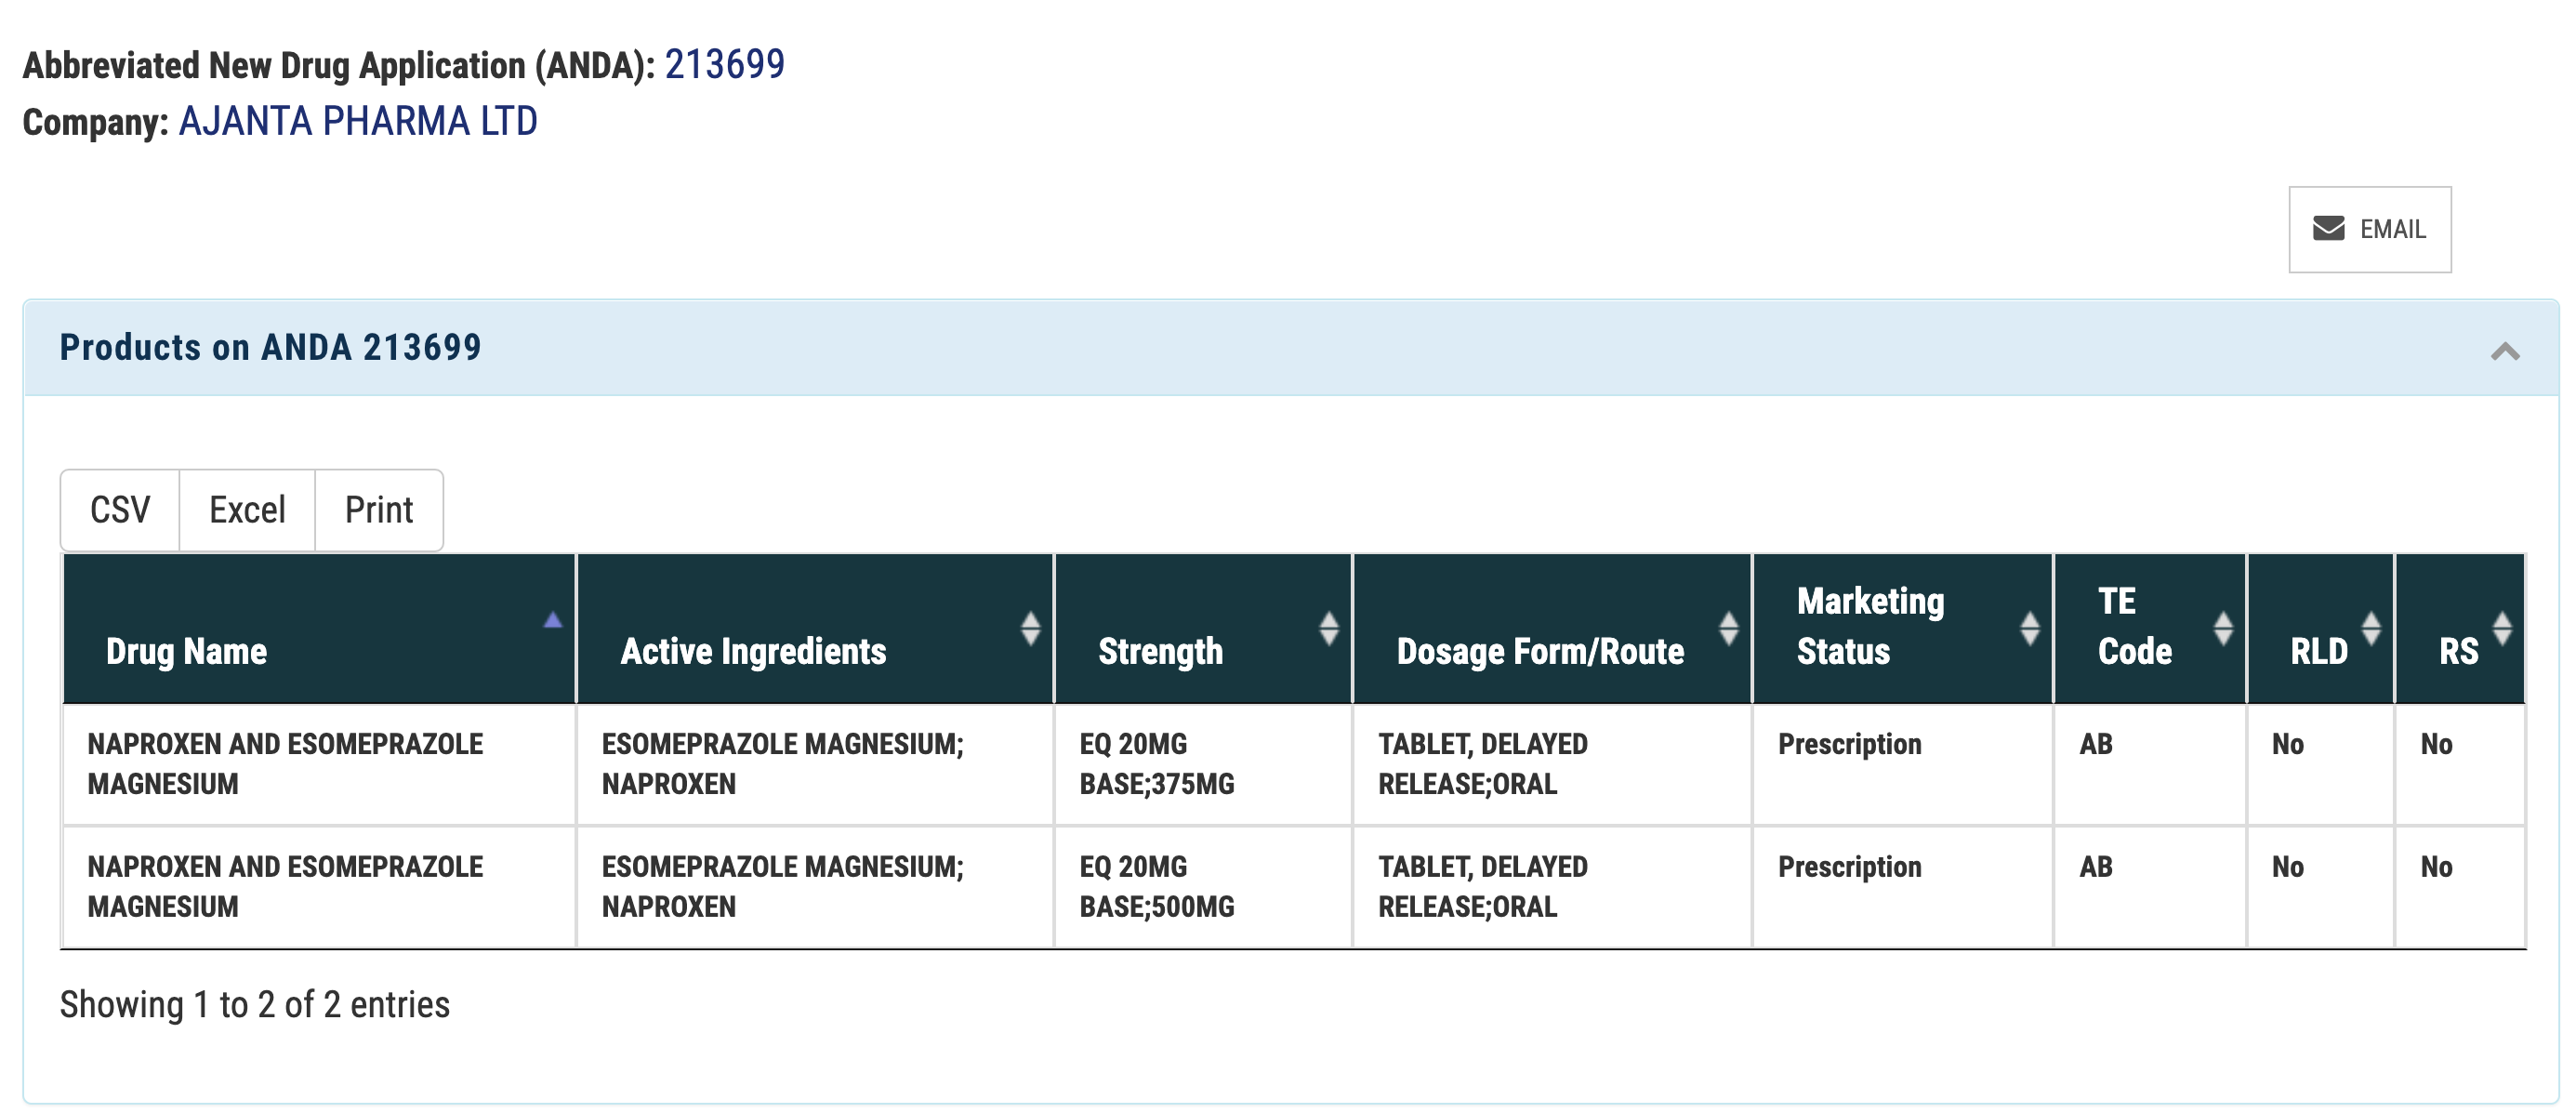
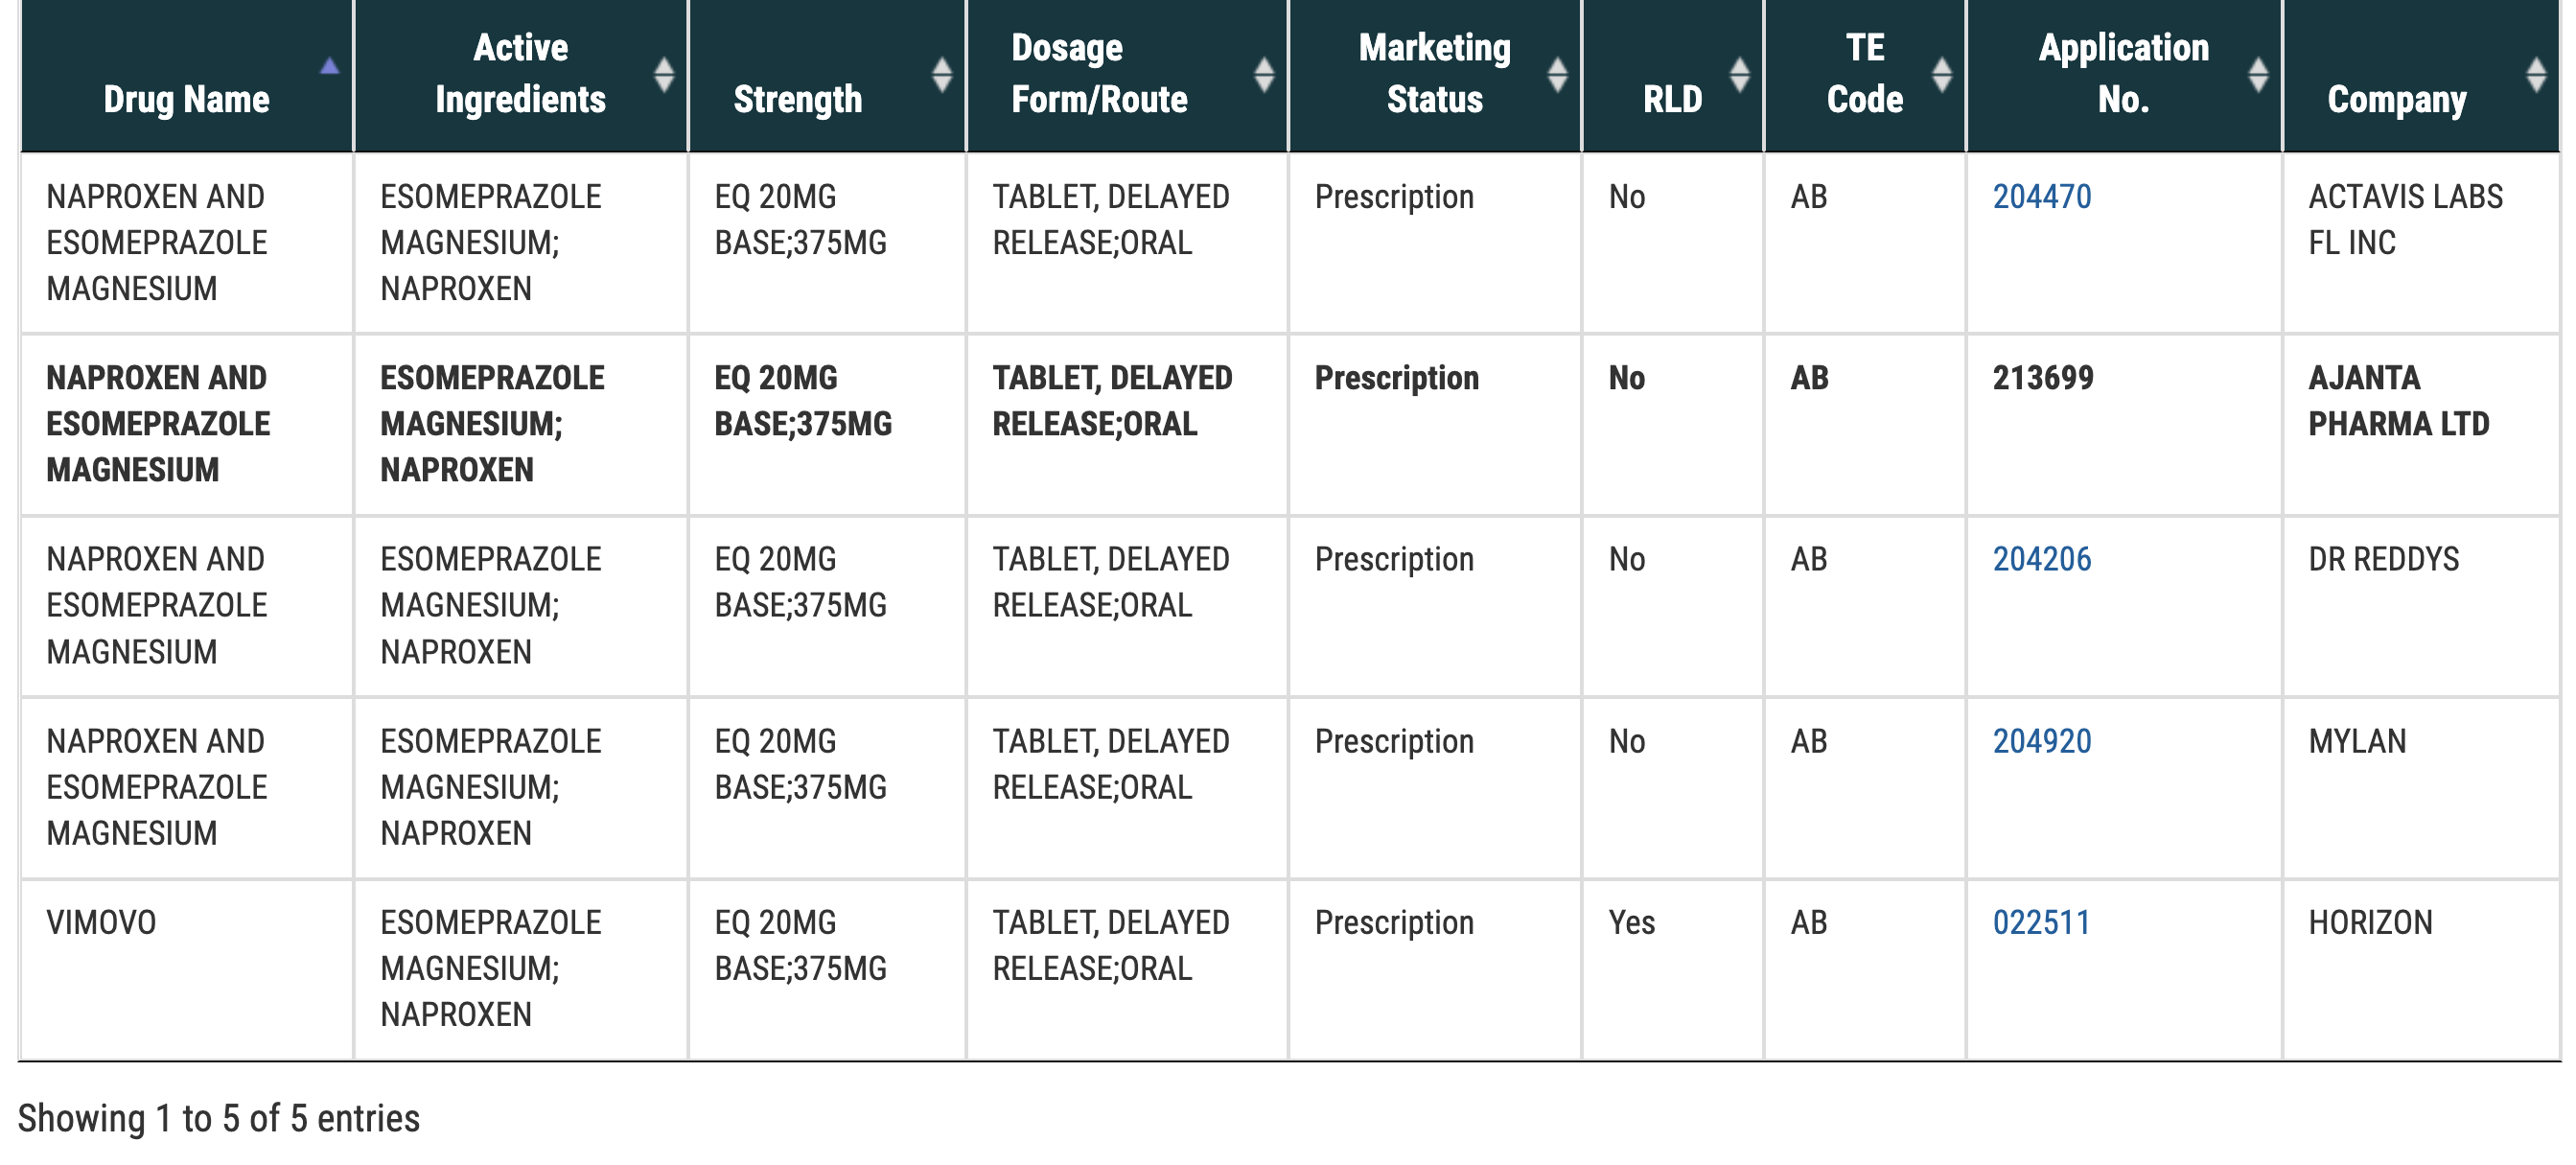
Ajanta gets approval for Vimovo and it can be a material opportunity as there are limited competitors in the market.
I dont know the current market size, it used to be $400mn in 2020. Since 2020, there have been multiple players entering the market (Dr. Reddy, Lupin).
Disclosure: Invested (position size here, no transactions in last-30 days)
Very average set of results from Ajanta with sales growing by 6% and EPS declining by 20%. Company is facing margin pressure from high raw material prices and elevated shipping costs. This margin pressure has now been ongoing for last 3 quartes, we are probably left with 1 more quarter of PAT decline which will reset the base.
In terms of actual business, Ajanta is doing exceptionally well in Indian and Asian market. They have been outperforming IPM by a large margin since 2020. Most of their IPM outperformance have come from pain and derma therapies. Additionally, an EIR for Dahej facility should lead to resumption of growth in USA. My concall notes are below.
FY23Q2 concall
Disclosure: Invested (position size here, no transactions in last-30 days)
After bad results, Ajanta Pharma continues to disappoint with their guidance.
![]() 1-2 product launches vs earlier guidance of 3-4
1-2 product launches vs earlier guidance of 3-4
![]() EBITDA margin guidance of <25% vs earlier guidance of 25-27%
EBITDA margin guidance of <25% vs earlier guidance of 25-27%
![]() Capex of Rs. 150 crores vs earlier guidance of Rs. 200 crores.
Capex of Rs. 150 crores vs earlier guidance of Rs. 200 crores.
Fresh presentation from the company with some new information.
https://www.bseindia.com/xml-data/corpfiling/AttachLive/5f3106e6-fcd0-4299-acef-022c453e8b91.pdf
If this puts an end to the constant pledging, it might actually turn out to be a good thing in the long run.
Very good revival in sales from Ajanta, however some part of this growth is one-time due to the flu season in US. They had massive margin pressure due to losses on currency hedges, higher freight costs due to air freighting and large increase in MR strength. Ajanta has increased their MR strength by 50% in International markets. Concall notes below
FY23Q3 concall
Disclosure: Invested (position size here, no transactions in last-30 days)
FY23Q4 concall
US:
Domestic:
Emerging market (branded generics)
Africa institution
Disclosure: Invested (position size here, sold few shares through participation in buyback in last-30 days)
FY23 annual report notes
Product launches:
Branded Generics (72% of revenues; grew @13% to 2’690 cr.):
Generics and Institutional (27% of revenues; grew @13% to 1018 cr.):
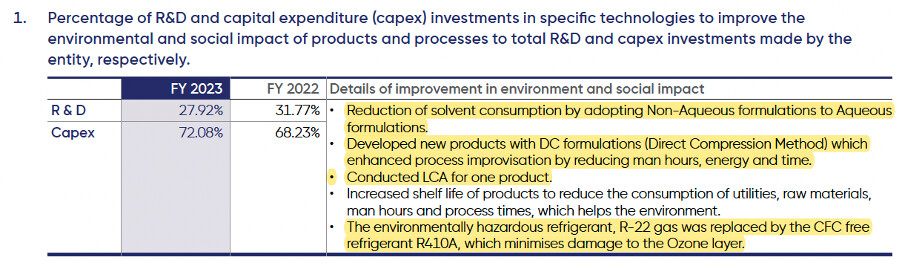
R&D
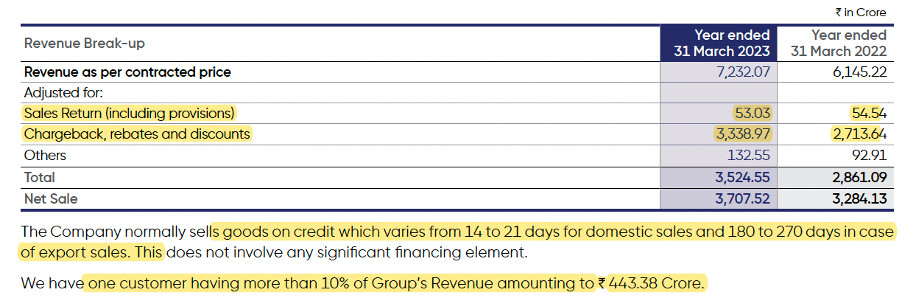
Financial Performance:
Strategy:
Share issuances:
Other Points:
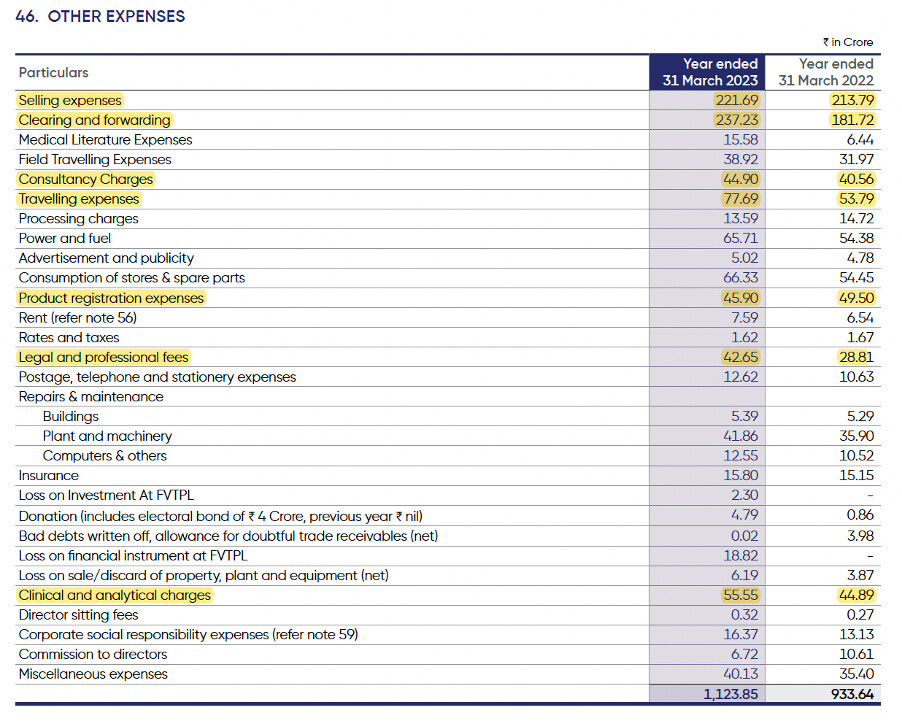
Other expenses
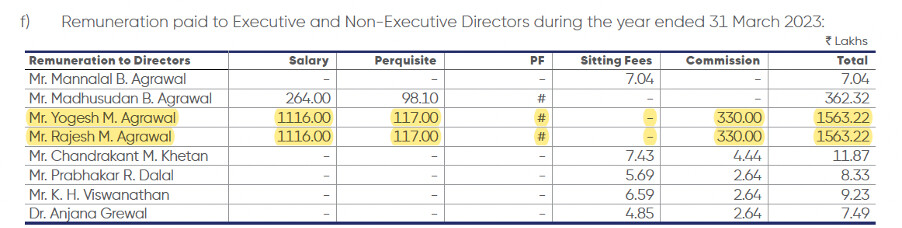
Management Remuneration
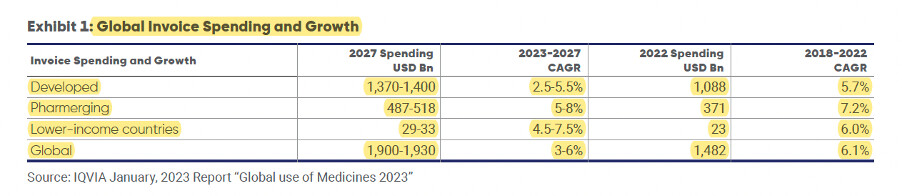
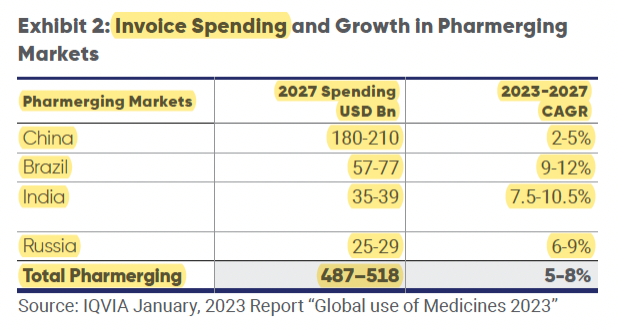
Global trends:
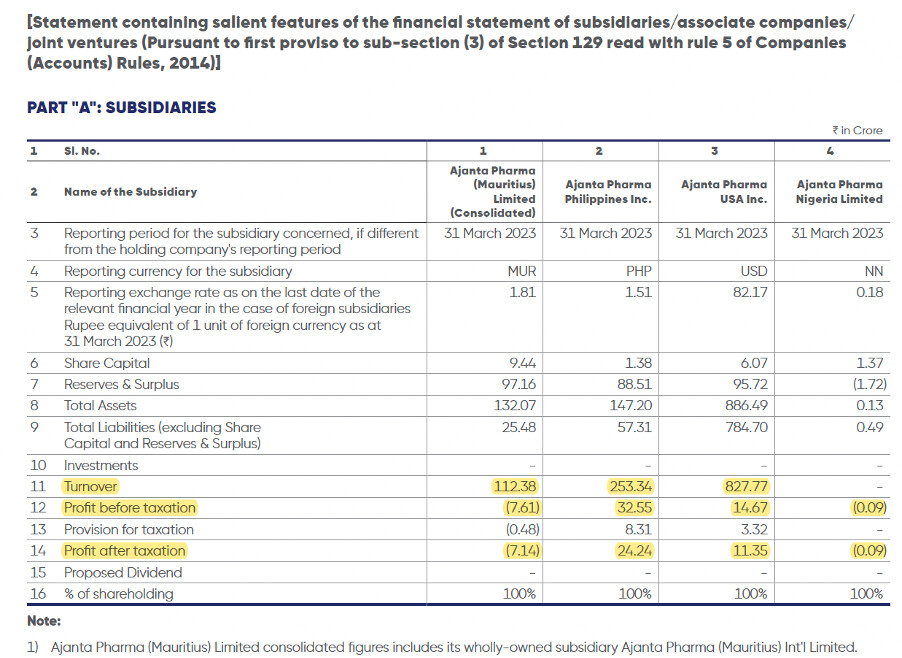
Subsidiary
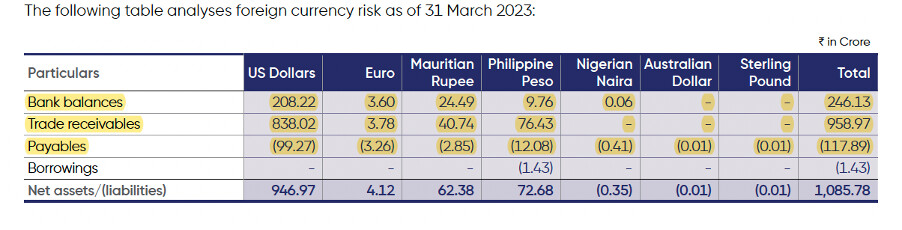
Foreign currency exposure
Disclosure: Invested (position size here, no transactions in last-30 days)
Posting on behalf of @harsh.beria93 as he can not post more than 3 consecutive messages
FY24Q1 concall
Q1FY24: Sales grew at 7%, Gross margin 75%, EBITDA margins ~ 26%, PAT margins ~ 20%
Gross margin improvement was due to softening of API prices and recovery in EURO/INR. Reduction in freight costs was 2.5% of export sales
Will maintain 25±1% EBITDA margin in FY24
FY24: expect mid teen growth
US:
o 19% growth in Q1 (1 new launch; 41 launched products; plan to launch 4-5 products in remainder FY24)
o Filed 3 ANDA in Q1 and received 3 approvals; plans to file 6-8 ANDAs during FY24
o Expect quarterly revenues to remain at similar levels (213 cr.)
o Price erosion has stabilized, expect high single digit price erosion
o gVimovo has been commercialized
o gChantix: waiting for approval, hoping to launch in Q4FY24 or Q1FY25
o 14% growth in Q1, launched 3 new products (1 is first launch in India)
o Trade generics: 36 cr. (vs 33 cr. in Q1FY23). Expecting 10-12% growth
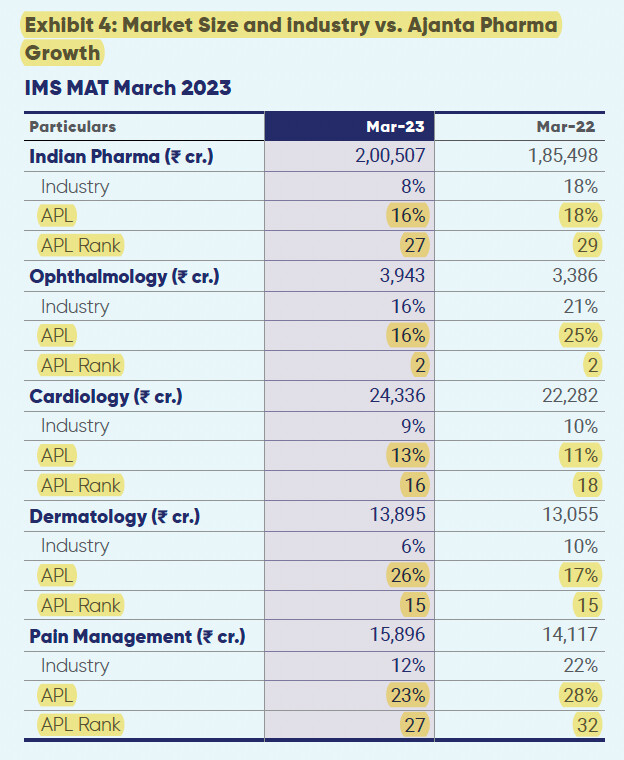
o IPM rank 26 (gained 1 rank)
o In MetXL, have been able to nullify impact of price cuts by growth in volume
o MRs: 2800
o Africa branded de-grew by (-5)%. Expect mid teen growth in FY24
o France disruption ended in mid May and has normalized since June
o Asia branded grew by 6% in Q1. Expect mid teen growth in FY24
o Launched 2 products in Q1
o De-growth of (-16%) in Q1
CAPEX of 26 cr. in Q1. FY24 maintenance capex + corporate office will be 200 cr.
R&D stood at 5% of sales
Ajanta Pharma Q1 highlights -
Breakdown of business revenues -
Branded business -
India - 32 pc
Asia - 26 pc
Africa - 15 pc
Total branded business - 73 pc
Generic business -
Africa Institutional - 5 pc
US - 22 pc
Total generic business - 27 pc
Total MRs across geographies - 4500 +
Presence in 30+ countries
Total products- 500 +
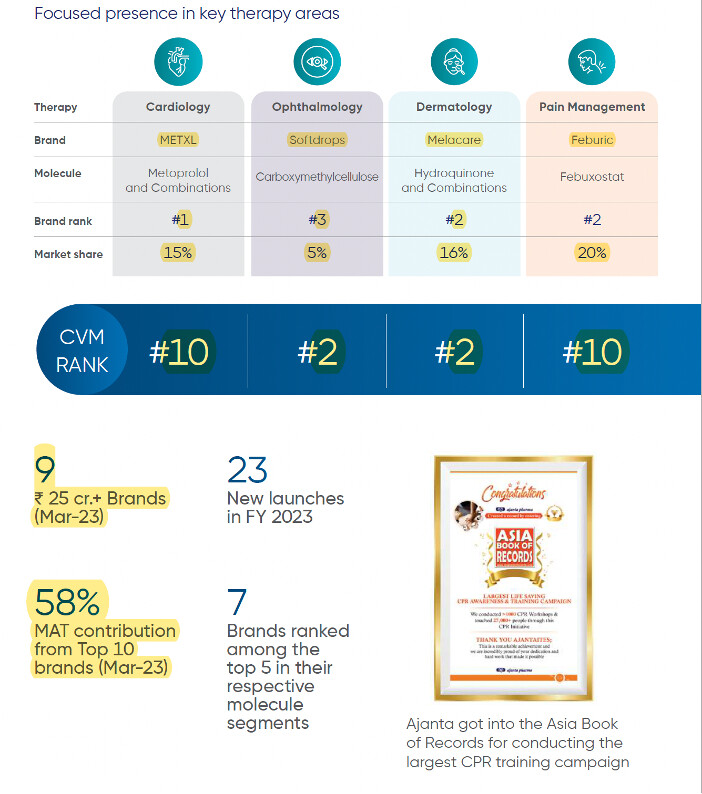
India business -
Cardiac- 39 pc
Opthal- 31 pc
Derma- 21 pc
Pain- 9 pc
Total - 10 brands with sales > 25 cr, 52 pc business from top 10 brands. 03 launches in Q1, 01 launch was first to Mkt
Last 4 yr’s India sales CAGR @ 14 pc. Only behind - JB Chen, Dr Reddy, Eris, Ipca, Aristo
Asia + Africa branded business -
Major presence in - Philippines, Middle East & CIS countries, Kenya, Tanzania, West Africa
4 Yr sales CAGR in Asia-12 pc
4 Yr sales CAGR in Africa-16 pc
Africa Institutional business FY 23 sales @ 190 cr, down @ 8 pc CAGR in last 4 yrs
US Generics-
52 ANDAs approved
6-8 filings/ yr
Last 4 yr sales CAGR @ 17 pc
R&D-
FY 23 spend at 237cr
Employing 850 scientists
Q1 financial outcomes-
Branded business sales @ 732 vs 688 cr
Generics sales @ 278 vs 258 cr
Total sales - 1010 vs 944 cr, up 7 pc
EBITDA - 271 vs 222 cr, up 22 pc
PAT - 208 vs 175 cr, up 20 pc
Announced a special dividend of Rs 25/share as it was company’s 50th yr since inception
Ajanta out-grew India Mkt by 400 bps in Q1
Gross margins in Q1 improved by 200 bps to 75 pc
Guiding for 25+/- 1 pc EBITDA margin guidance for FY 24. Also guiding for Mid teen sales growth
Capex guidance for FY 24 @ 200 cr ( including maintenance capex and new corporate building )
Capex to remain muted in FY 25-26
Don’t see any addition in Indian field force in near future
Expect significant ramp up in Africa branded sales wef Q2
A back of the Envelope calculation suggests an EBITDA of around 1050 cr and PAT of around 750 cr for FY 24 - Rough estimate
Disc: plan to take up a tracking position
Company came up with a good set of nos in Q2, with sales growing by 10% and EPS by 25%. Its good to see come back to their normal EBITDA margins of 25-30% after a gap of a few quarters. A very interesting piece of commentary was their US generics business, where they are seeing much more opportunities and lower pricing erosion, leading to 20%+ growth. Concall notes below.
FY24Q2 concall
Disclosure: Invested (position size here, sold shares in last-30 days)
Ajanta came up with a good set of nos in Q3, with sales growing by 14% and EPS by 59%. They have increase their EBITDA margin guidance to 28% EBITDA for FY24 and subsequently to 30%+ in the next few years. Concall notes below.
FY24Q3 concall
Sales grew at 13%, Gross margin 73%, EBITDA margins ~ 28%, PAT margins ~ 19%
Paid dividends of 642 cr. in 9MFY24 (51/share)
Expect significant increase in logistics cost in Q4 due to Red sea crisis (7% QoQ increase in other expenses over Q3), EBITDA margin will be lower in Q4 vs 9MFY24. Expect 27±1% EBITDA margins for FY24
Will see some increase in inventory due to transit time increase
US:
(-5)% YOY decline (2 new launches, 44 launched products, plan to launch 1 products in Q4). Decline in sales was because of higher flu season last year
Filed 1 ANDA (22 under approval), will file 8 ANDAs in FY24
Plan to file 8-12 ANDAs in FY25
High single digit price erosion, market is favorable
Domestic:
5% YOY growth, launched 3 new products (0 first launch in India)
MAT December 2023: Volume 4% (vs 2.6% IPM), Price: 3.9% (vs 4.3% IPM), New product: 3.7% (vs 3% IPM). Price growth is lower for Ajanta due to NLEM impact in MetXL
Cardiac MAT growth of 6% in December 2023 (vs 10% for IPM). MetXL NLEM price impact was in December 2022
Competitive intensity has increased dramatically in cardio division (have seen some market share loss in statin combinations)
Looking to regain market share through more doctor outreach activities. This is the current focus
In ophthalmology division, have been #1 in generating prescriptions for quite sometime
Covered market IPM rank: 4
Trade generics: 38 cr. (vs 38 cr. in Q3FY23)
Emerging market (branded generics)
Africa branded grew by 7%. Growth was lower this year because of rationalization of inventory to distributors. Confident of regaining growth momentum in FY25 (launched 5 new products in Africa in 9MFY24)
Asia branded grew by 28% (launched 15 new products in Asia in 9MFY24)
Launched 10 new products in emerging markets
Africa institution
Growth of 179% YOY (9M growth of 33%). Preponement of few supplies from Q4 led to higher growth
Anti-malaria vaccine rollout has been very slow in Africa and its efficacy is also lower (GSK + 1 other company has rolled out). Don’t expect meaningful impact in next 3-5 years
CAPEX of 80 cr. in 9MFY24 (full year planned capex of 125 cr., revised from 150 cr. earlier)
R&D stood at 5% of sales
Disclosure: Invested (position size here, sold shares in last-30 days)