AJANTA PHARMA -
Q4 and FY 25 results and concall highlights -
Q4 outcomes -
Revenues - 1170 vs 1054 cr, up 11 pc
Gross margins @ 76 vs 75 pc
EBITDA - 297 vs 278 cr, up 7 pc (margins @ 25 vs 26 pc)
PAT - 225 vs 203 cr, up 11 pc
FY 25 outcomes -
Revenues - 4648 vs 4209 cr, up 10 pc
Gross margins @ 77 vs 75 pc
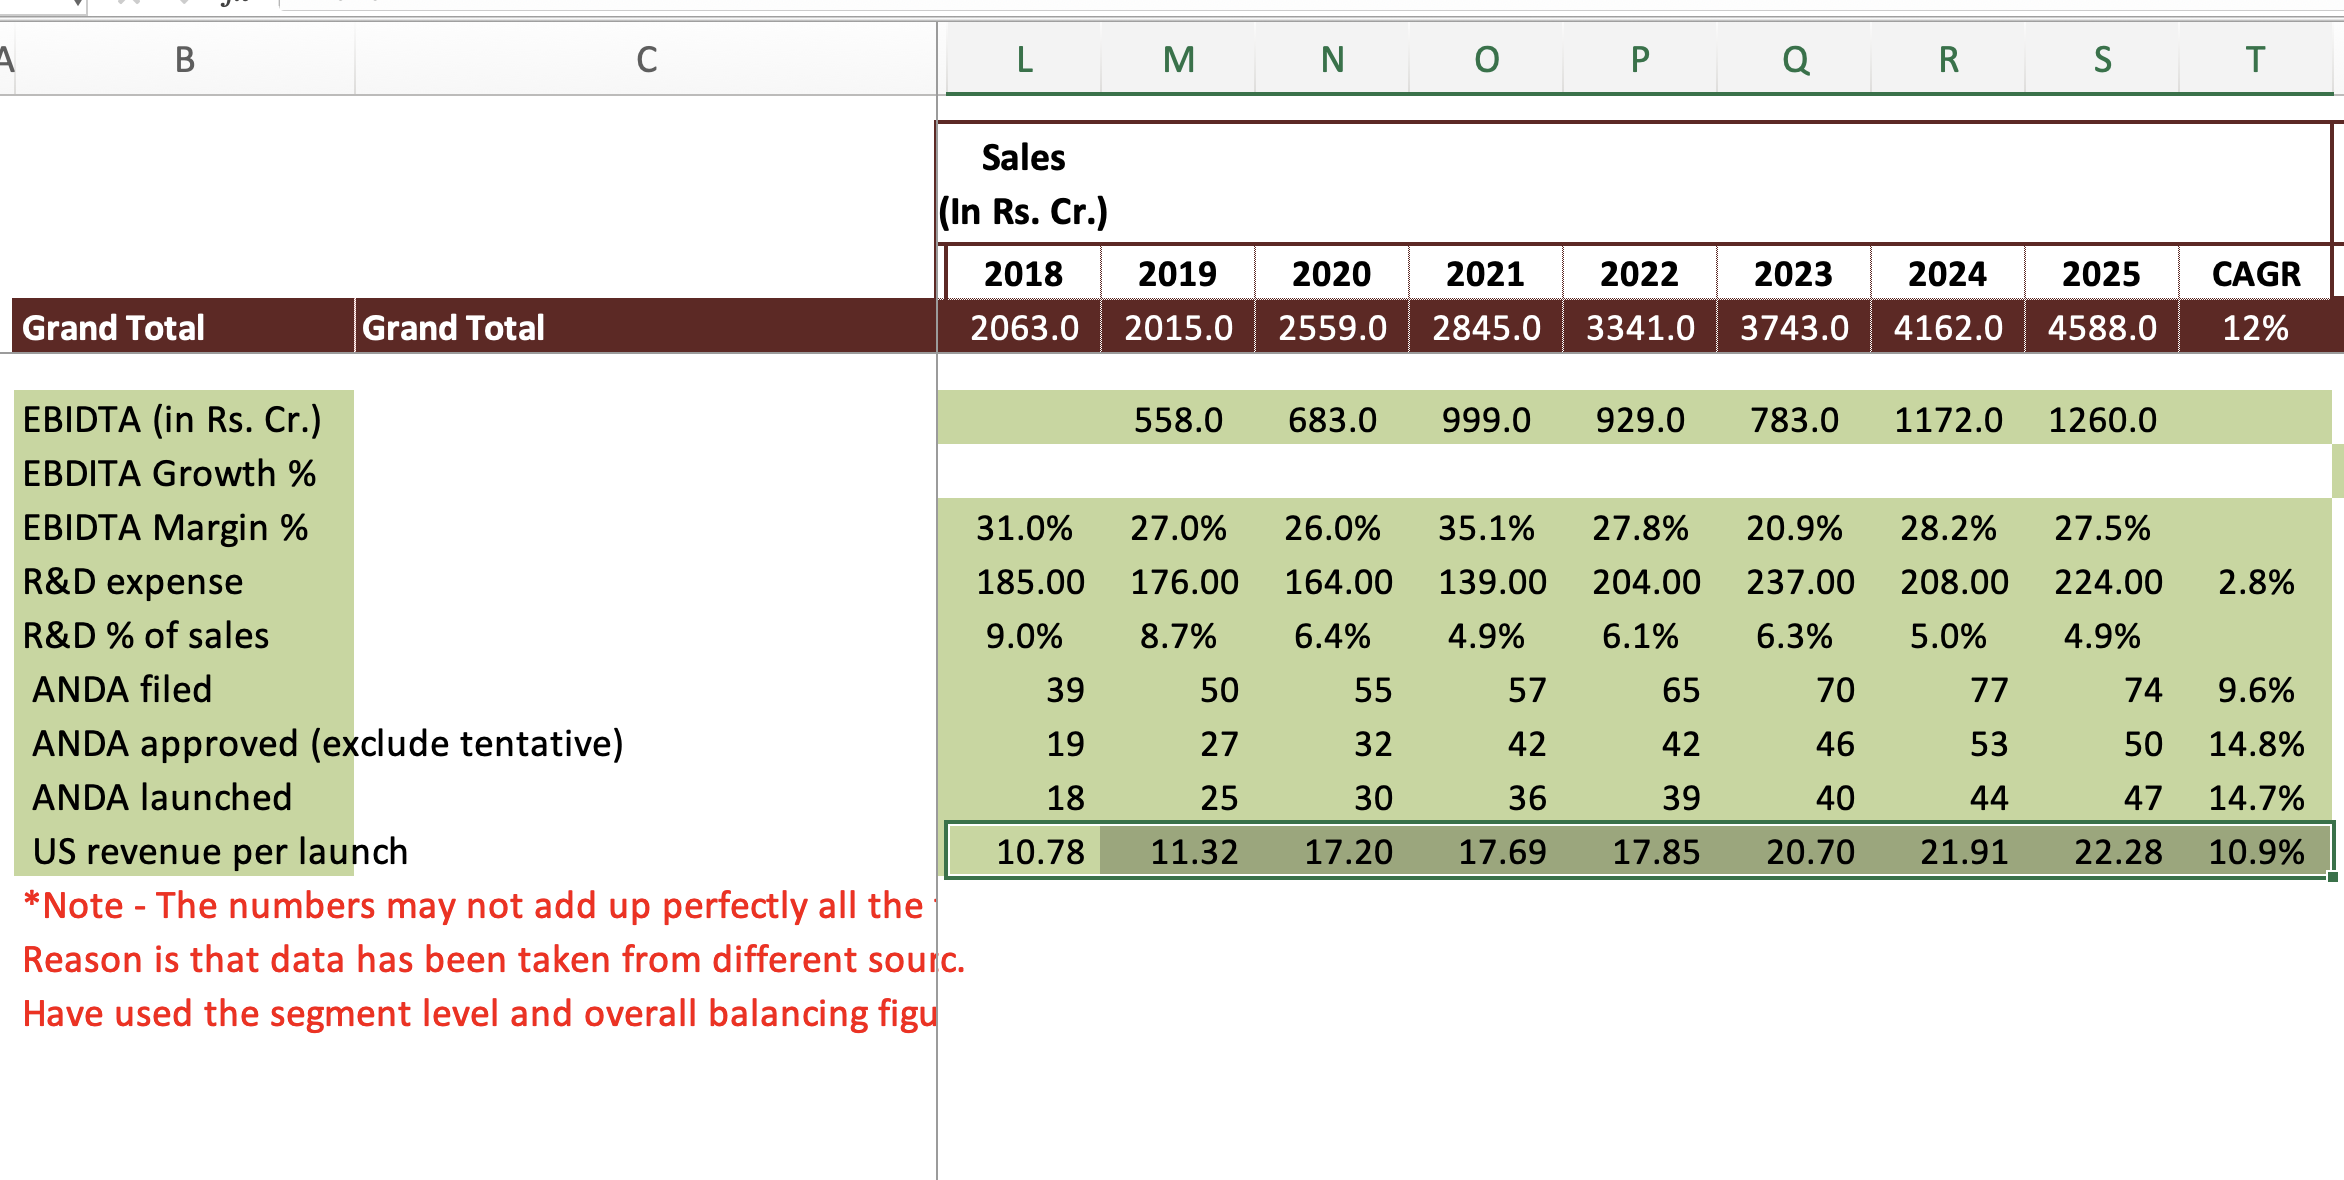
EBITDA - 1260 vs 1172 cr, up 7 pc ( margins @ 27 vs 28 pc ) Lower EBITDA growth is due to accelerated increase in personal costs @ 21 pc due change in Gratuity policy. This should get normalised in next FY
PAT - 920 vs 816 cr, up 13 pc
Q4 segmental performance -
India branded formulations - 369 vs 326 cr, up 13 pc
Asia branded formulations - 303 vs 281 cr, up 8 pc
Africa branded formulations - 133 vs 113 cr, up 17 pc
US generics - 325 vs 261 cr, up 25 pc
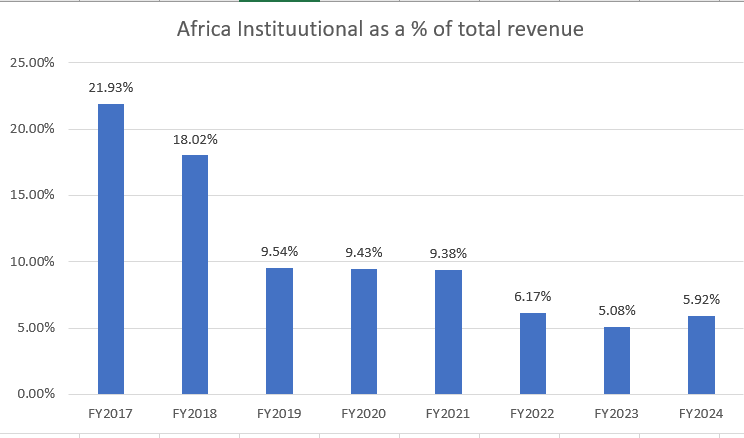
Africa generics - 28 vs 61 cr, down 53 pc
FY 25 segmental performance -
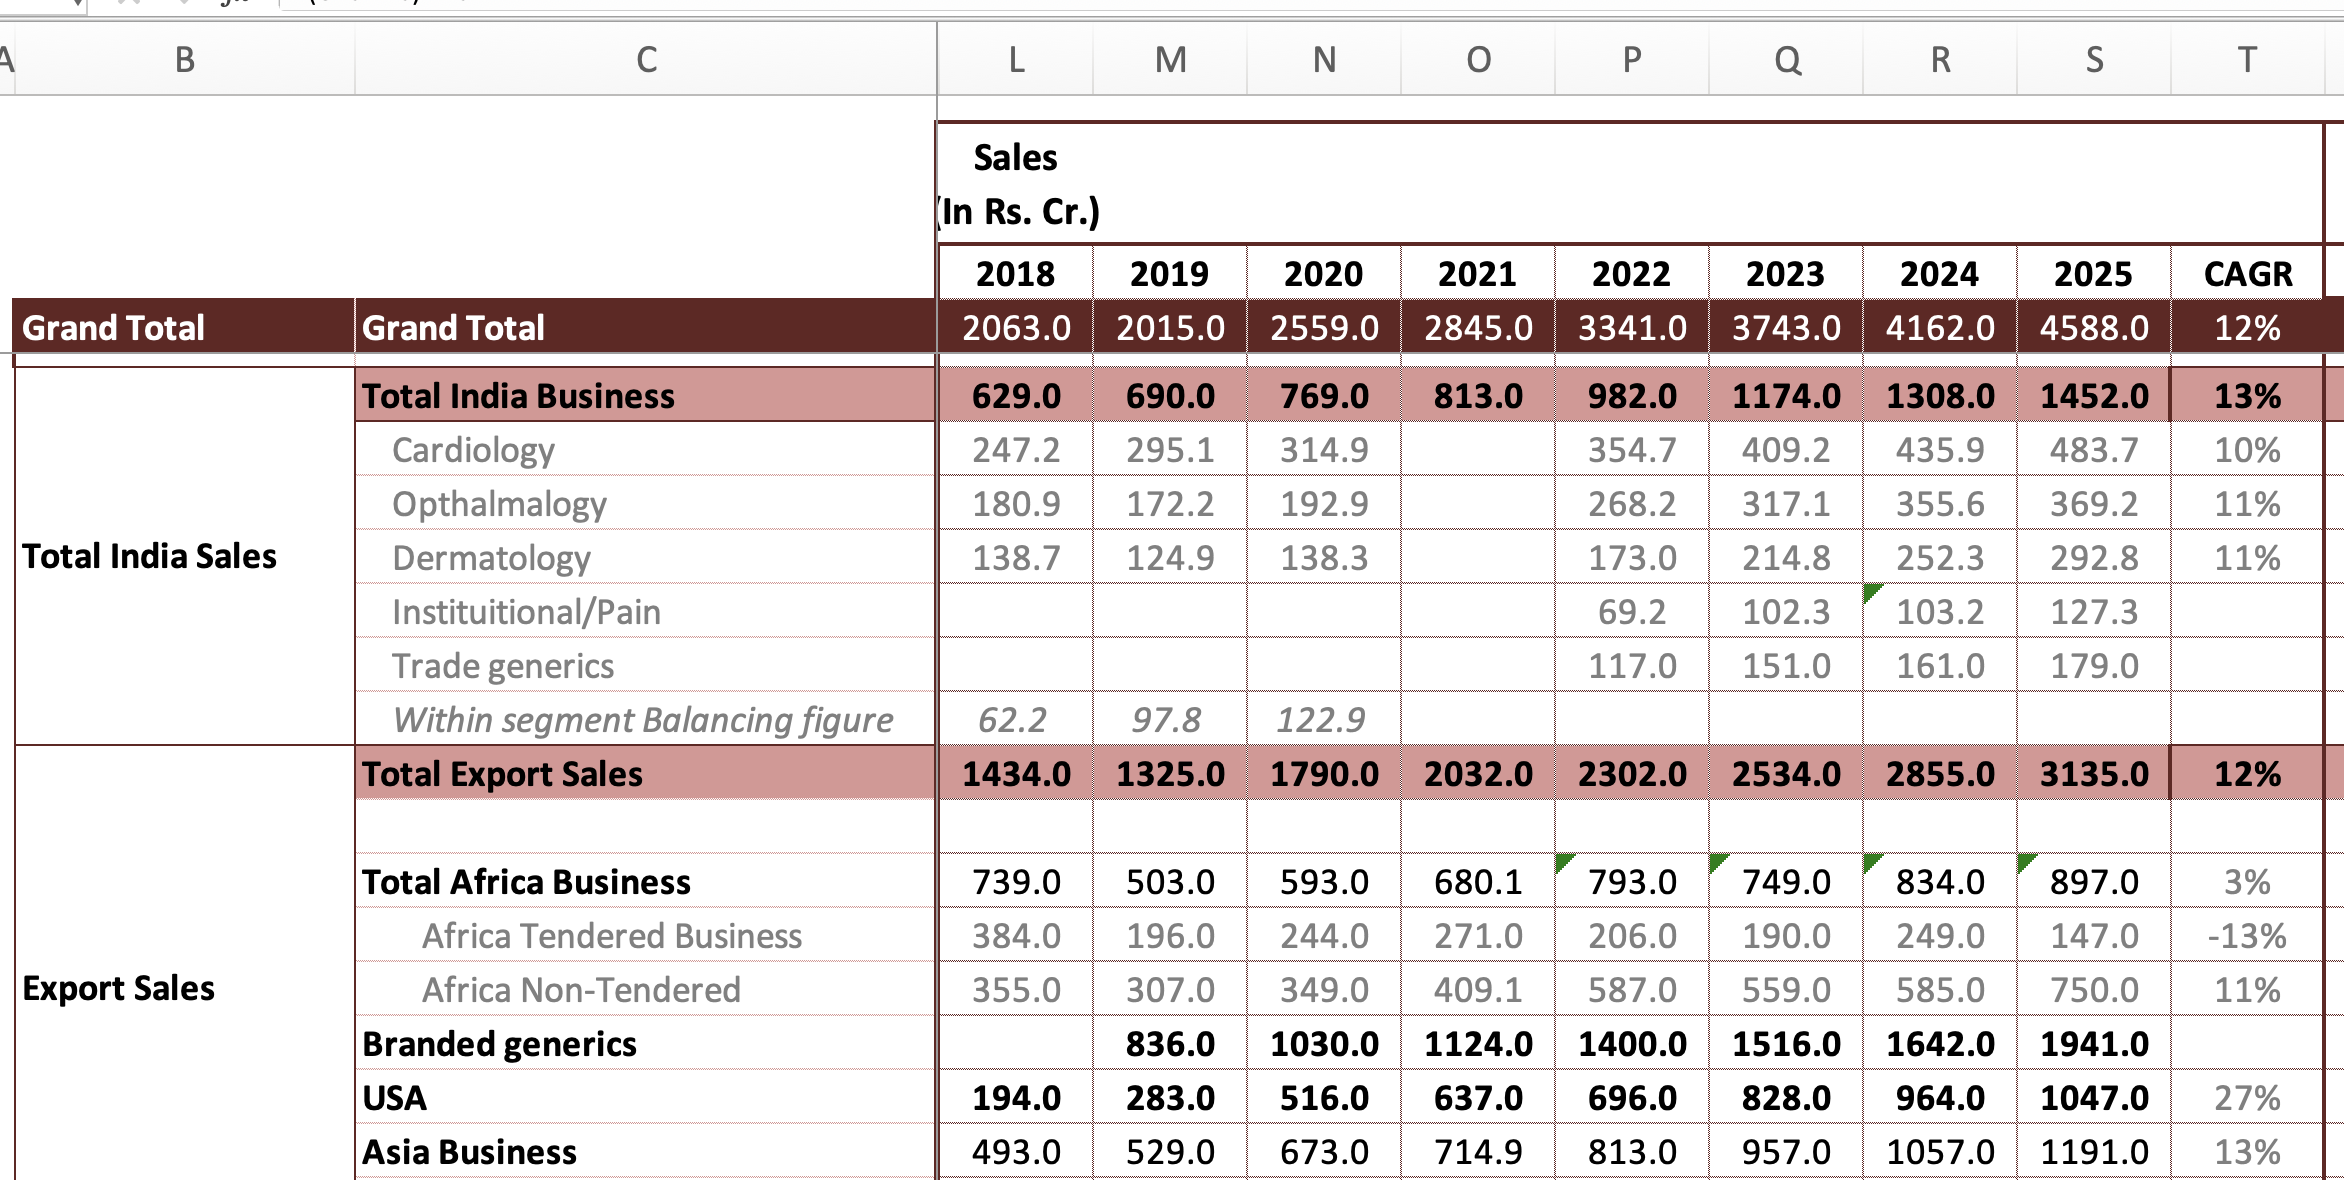
India branded formulations - 1452 vs 1308 cr, up 11 pc
Asia branded formulations - 1191 vs 1057 cr, up 13 pc
Africa branded formulations - 750 vs 585 cr, up 28 pc
US generics - 1047 vs 964 cr, up 9 pc
Africa generics - 147 vs 249 cr, down 41 pc
Full yr R&D expenses @ 224 vs 208 cr
US generics business has witnesses 13 pc CAGR growth in last 4 yrs. Company has a total of 47 products on the shelf ( including 5 products launched in FY 25 ). Filed 6 products in FY 25. Aim to file another 8-12 products in FY 26
Asia and Africa branded businesses have grown @ 14 pc and 16 pc CAGR respectively in last 4 yrs. Company launched a total of 38 new products in Asia + African mkts in FY 25. Key mkts include - Africa, SE Asia, ME, East and Central Asia
India branded business has grown @ 12 pc CAGR in last 4 yrs. Company’s main therapies in India include - Cardiac, Ophtal, Derma and Pain management
FY 25 India growth @ 10.6 pc. Breakup of growth - Volume @ 2.5 pc, Price @ 5 pc, New Products @ 3.1 pc
14 of company’s brands in India now clock an annual sales of > 25 cr. 65 pc of company’s India sales come from Chronic therapies. 11 pc of company’s India sales are under NLEM. Company’s MR strength stands @ 3450
Some of company’s popular brands include -
Aquasoft ( moisturising cream and lotion )
Feburic ( to treat Gout )
Apdrops ( Ophthalmic antibiotic )
Met XL ( anti Hypertensive )
Soft Drops ( used to treat dry eyes )
Company has ventured into Gynaecology and Nephrology in the Indian mkt in FY 25. Have hired 200 MRs for the same. Added another 250 MRs in the 4 traditional therapies. Company acquired 3 brands in the pain management segment in Q4
Out of a total sales of 1452 cr from the India business in FY 25, Rs 170 cr sales came from trade generics segment
Breakup of India sales -
Cardio - 38 pc
Opthal - 29 pc
Derma - 23 pc
Pain management - 10 pc
Company expects EBITDA margins to expand to around 28 pc levels in FY 26 vs 27 pc in FY 25
Capex @ 318 cr in FY 25. Expect Capex for FY 26 @ 300 cr
Have added 450 MRs in FY 25. This should offset some of the gains in margins that would have otherwise accrued to the company in current next next FY due increased percentage of sales from Branded formulations
Expect the US business to grow in mid to high teens and the branded formulations business to grow in low teens in FY 26
Expecting R&D spends to continue to be around 5 pc of sales for next FY as well. Half of R&D expenses are directed towards US business
Company launched 4 new products in US mkt in H2 FY 25 and is planning to launch 7 new products in FY 26. These two factors combined give them the confidence of being able to grow @ mid to high teens in US in next FY
In India, company aspires to keep growing @ 2-3 pc higher than IPM growth rates. It should take 3-4 yrs for the company to make a meaningful mark in the new therapies that they have recently entered in India mkt ie Gynae and Nephro
The pain management brands that the company has acquired in Q4 have an annual revenues of 17 cr. Aim to grow them @ fast pace
Company believes, there r only 3 ways to spend their accumulated profits ie Capex, Dividends and Acquisitions. As long as they r not making any significant acquisitions, the dividend payments r likely to be liberal
Company believes that company should be able to keep growing in low to mid teens in the African and Asian mkts for foreseeable future - on the back of new products and deeper mkt penetration
At present, the tariffs on China vs India on Pharma product sales to US are @ 20 pc vs NIL. However, India is already far ahead of China in US mkt wrt formulations
Disc: holding, biased, not SEBI registered, not a buy/sell recommendation