
As of today, I have created a 2% position in Aptus Value Housing which reduces cash to 3%.
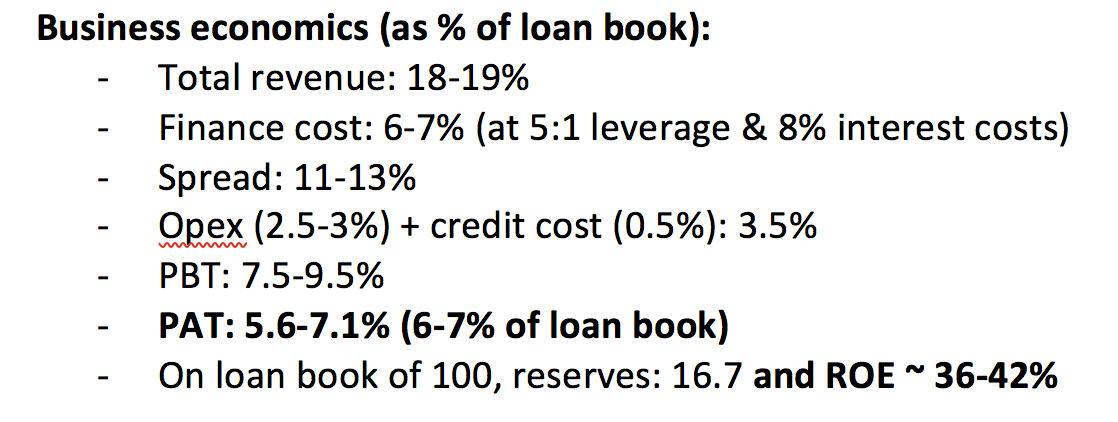
I have been working on Aptus’ value proposition for the last couple of years and have been very impressed by the kind of lending model they have built. Their niche lies in maintaining a balance of high yielding business loans (20%+) and medium yielding affordable housing loans (14-15%), which gives them higher blended yields (17%) while maintaining an ultra low cost structure (2.5-3% opex). Their cost structure is a reflection of centralised credit underwriting operations, which means most of their local branches only needs to have sales personnel, who draw lower salaries compared to credit underwriters. In lending financials, we can only infer a few things from numbers due to the opaque nature of the business.
- Cost structure of organization
- Credit performance in bad cycles by studying performance of static loan pools.
I have seen that organizations that are good at lending also tend to have lower costs (e.g. HDFC, Canfin, HDFC bank, etc.), as lending is a commodity business and in any commodity, one can only control costs. Aptus has the lowest cost structure amongst peers like Aavas or Home first. Additionally, Aptus has the lowest credit costs amongst its peer set. You can see an illustration of their unit economics below.
Now, lets look at nos they have reported in past few years to see if my nos actually make sense (historical nos are even better than my assumption)
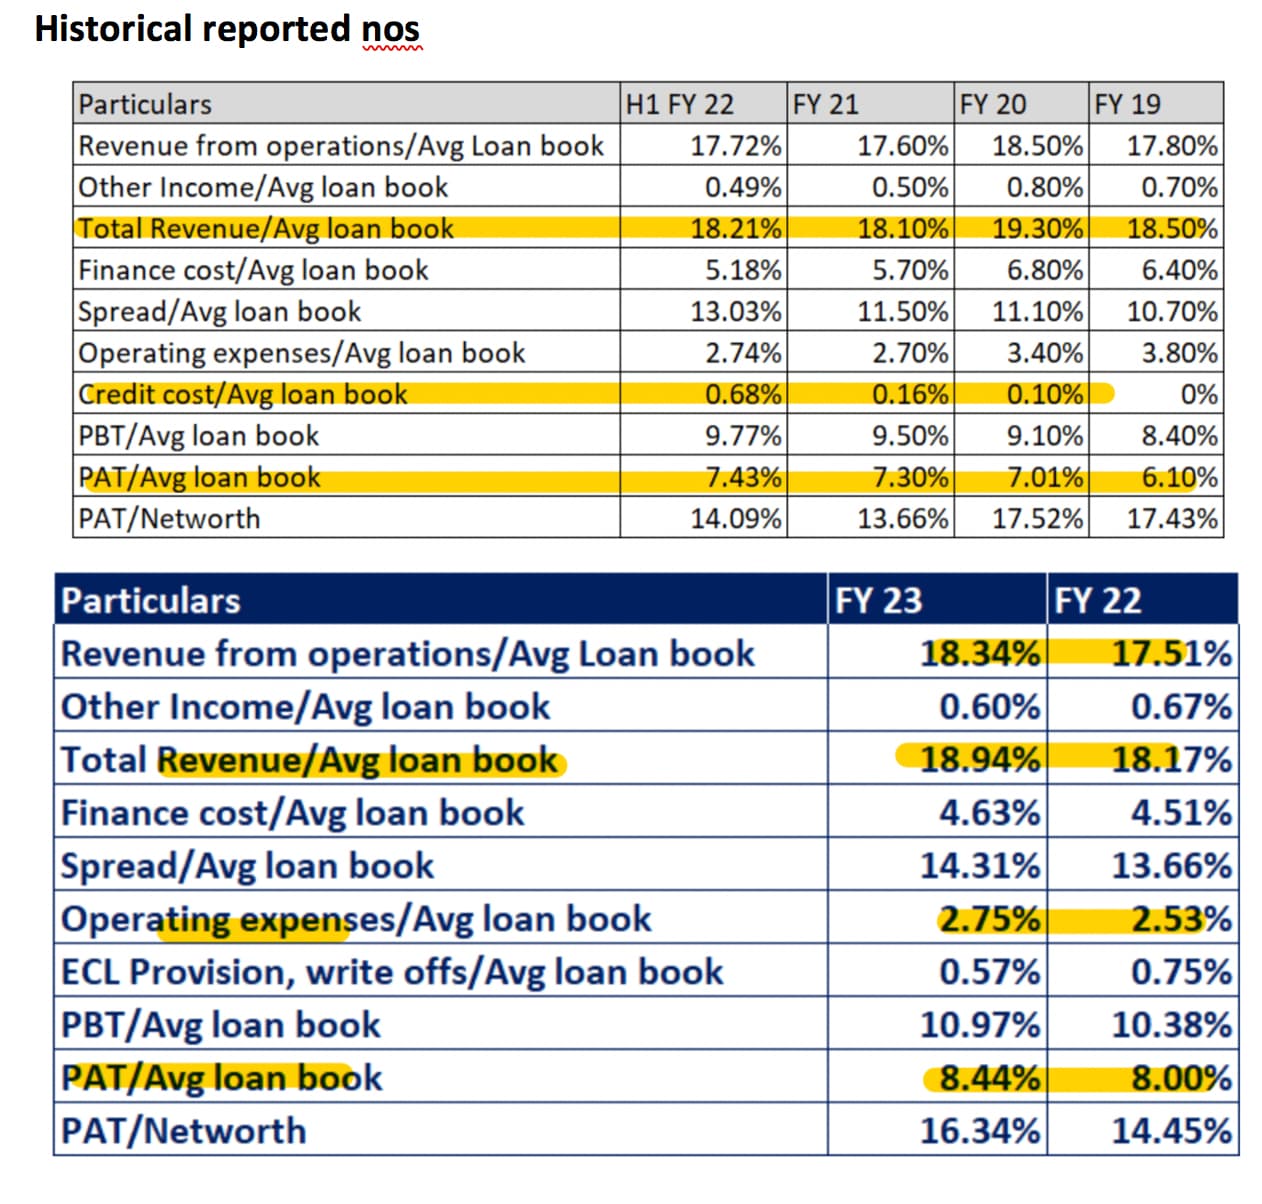
Having tracked a lot of lending cos, I haven’t seen any company with this kind of unit economics. These numbers make Gruh Finance look like an average underwriter. Given that valuations have cooled down significantly after the IPO (from 6-7x PB to 3.6x PB), I am willing to take a bet and see how things turn out. My two worries are:
- Reported nos are not scalable as they expand beyond their core geographies
- The true credit costs are higher than whats being reported.
Lets see how future pans out.
Core compounder (42%)
| Companies | Weightage |
|---|---|
| I T C Ltd. | 4.00% |
| Housing Development Finance Corporation Ltd. | 4.00% |
| NESCO Ltd. | 4.00% |
| Eris Lifesciences Ltd. | 4.00% |
| Ajanta Pharmaceuticals Ltd. | 4.00% |
| HDFC Asset Management Company Ltd | 4.00% |
| Aegis Logistics Ltd. | 2.00% |
| Gufic Biosciences | 4.00% |
| HDFC Bank Ltd. | 2.00% |
| PI Industries Ltd. | 2.00% |
| LINCOLN PHARMACEUTICALS LTD. | 2.00% |
| Caplin Point Laboratories Ltd. | 2.00% |
| P.E. Analytics Ltd | 2.00% |
| Aptus Value Housing Finance India Ltd. | 2.00% |
Cyclical (47%)
| Companies | Weightage |
|---|---|
| Kolte-Patil Developers Ltd. | 4.00% |
| Sharda Cropchem Ltd. | 4.00% |
| Avanti Feeds Ltd. | 4.00% |
| Aditya Birla Sun Life AMC Ltd | 4.00% |
| Alembic Pharmaceuticals Ltd. | 4.00% |
| Amara Raja Batteries Ltd. | 4.00% |
| Chaman Lal Setia Exp | 2.00% |
| Stylam Industries Limited | 2.00% |
| Ashiana Housing Ltd. | 2.00% |
| Ashok Leyland Ltd. | 2.00% |
| Kaveri Seed Company Ltd. | 2.00% |
| Sundaram Finance Ltd. | 2.00% |
| Time Technoplast Ltd. | 2.00% |
| RACL Geartech Ltd | 2.00% |
| Manappuram Finance Ltd. | 2.00% |
| Transpek Industry Ltd. | 2.00% |
| ANUH PHARMA LTD. | 2.00% |
| Shree Ganesh Remedies Ltd - PP | 1.00% |
Turnaround (2%)
| Companies | Weightage |
|---|---|
| Punjab Chem. & Corp | 2.00% |
Deep value (6%)
| Companies | Weightage |
|---|---|
| Geekay Wires | 1.00% |
| Jagran Prakashan Ltd. | 1.00% |
| D.B.Corp Ltd. | 1.00% |
| Shemaroo Entertainment Ltd. | 1.00% |
| Modison Metals | 1.00% |
| RKEC Projects | 1.00% |
Sorry, I dont track Bajaj consumer.