U mentioned Amara Raja on ur watchlist.Here’s my understanding of the valuation : -
Per recent con-call the co. generates 900crs. FCF before taking into account any sort of Capex or payouts. with maintenance capex of roughly 200 crs. that leaves out 700 crs. The co. gave guidance of 15% for next 5 yrs and ample growth opportunities for next 2-3 decades. Taking a conservative 2% growth against risk free 6% gives valuation of arnd 16000 crs. & the stock currently trades at a good 30% discount to it.
This is a very rudimentary valuation based on wat I cld analyse abt the co. so far. Would like to hear ur views.
Currently it is available at 1x EV/Sales, your gain calculations relying on valuation gain ( 3x EV/Sales). Will top line growth (but reduced margin), better market conditions be sufficient for this valuation gain, worth relying upon?
My understanding is that in short term (FY22) revenue will be depressed, will this give better entry opportunity down the line.
Good point, the honest answer is that I don’t know. I have very little confidence on my exit multiples and I have mentioned it clearly in the post above. However, if we ignore the company name and simply look at the P&L statement (line-by-line), a 3x EV/sales looks conservative.
This being said, most PSUs have been undervalued for a reasonably long time now and I don’t know if or when the market will re-rate them. Cochin Shipyard is an example of a very well managed PSU which has survived the shipping downturn where most private players went bankrupt. They have the largest market share in ship repairs business in India and have consolidated the market by taking over a large number of ports from bankruptcy (hence at very attractive valuations). If I ignore the market sentiment around it, this is a business which generates reasonable returns on capital and offers downside protection through a good dividend yield. All this being said, the near term earnings profile will probably look a bit depressed due to slower rampup of new orders. I don’t make my decisions by near term business performance as you would have probably seen through my posts. Cochin Shipyard reminds me of HCL Tech which was grossly overlooked in 2016-17 time frame and it has been a good journey for me since. Will Cochin Shipyard ever become a growth stock? I don’t know!
As of today, I have sold my stake in NALCO. Although, alumina is nowhere close to its peak prices, aluminum prices have played out very well. My assumptions about NALCO was that by FY25, there will be a cyclical upturn in aluminum prices. When that happens, sales > 12’000 cr. I want to sell at P/sales > 2 i.e. 24’000 cr. (~128 share price). The current price of >90 offers <10% IRR, hence the sell.
Updated portfolio is below. Cash remains high at 25%.
Fair point! It entered as a deep value opportunity and I generally give 2 years to either upgrade deep value bets to the model portfolio or else sell them. I first bought somewhere around July last year, so its been more than a year now. Given how the business has panned out, it does seem much more than a deep value bet. Another spin would be, if they make 400-500 cr. of revenues by FY25 and margins of 24-25%, their market cap should be >1500 cr. (which still makes for a very deep value bet). Looking forward to seeing how the next few quarters pans out on business delivery
Another question, how will a 1% positon move the needle? Isn’t it occupying one self with too much (many positions) with very less impact on the scoreboard (PF returns) eventually? Sorry, just trying to get your viewpoint
Secondly, what is a core compounder?
Businesses like alembic (generics pricing), Avanti (Shrimp exports/pricing), Manappuram (MFI) etc. All have elements of cyclicality. Even Pi went through a 4 year downcycle.
I try to implement multiple strategies within my portfolio: fast growers, deep value, slow growers, etc. Each bucket has a given weightage which is a function of opportunity size and my research bandwidth. The idea with deep value bets (of which RACL is a part) is to allocate small sums of money on a basket and see how it does (adapted from the original Graham idea of net nets). Since last year, this segment of my portfolio i.e. deep value, has done much better than the core positions, despite each position only having a small weightage. So, an individual position might not move the needle but the basket definitely moves the needle.
Another viewpoint (which is probably more of a personality quirk) is that I can afford to build a small 1% position in a nano cap like RACL (at buying time, its market cap was ~75 cr.) because that’s the amount of money I can lose without losing big portfolio returns. As the story evolves (along with my own conviction), I can reduce/increase allocations.
I have explained this in a lot of details before, I would not like to reiterate that.
A cyclical (or lumpy) business doesn’t mean it cannot be a core compounder. The true essence of compounding is how a business increases their cashflows and book value (specifically for manufacturing businesses). Even in deep cyclical businesses like ferroalloys, we can find processors such as Maithan that have generated >20% ROEs over cycles and compounded their book values (and cashflows) over 20% rates. The cash that a business earns over its lifetime (discounted with my expected return) is the actual value. I can live with the volatility in cashflows because it can be accounted for in my discount rate.
My thought process of buying cyclicals is (1) I shouldn’t be buying in the later part of the cycle, and (2) my return threshold is higher over a less cyclical business.
About individual positions (Alembic, manappuram, avanti), there is an individual post for each. Hope this clarifies my thought process
I briefly looked at SJVN from an dividend play perspective while looking for an clean energy option, but decided to pass it up. Could not find your thesis for SJVN anywhere on this thread. Have you posted one? If not, can you share your thoughts for this one?
I added a 2% position in Kaveri seeds. This is in-line with increasing exposure to agricultural sector as I can find relatively higher number of bargains compared to other sectors. As we had a cyclical upturn in agri in 2020, I am adding my bets slowly (currently have Swaraj Engines and Kaveri seeds at 2% position sizes). For Kaveri, rice hybrids have been doing very well. My speculation is FY25 sales of around 1500 cr. translating into an enterprise value of 6000 cr. (4x EV/sales), translating into market cap of ~6500 cr. (share price ~ 1077) (assuming cash of 500 cr.). I will increase my position size if price drops or business starts performing better.
Updated portfolio is below. Cash remains high at 23%.
Core compounder (44%)
Companies
Weightage
I T C Ltd.
8.00%
Housing Development Finance Corporation Ltd.
4.00%
NESCO Ltd.
4.00%
Manappuram Finance Ltd.
4.00%
Alembic Pharmaceuticals Ltd.
4.00%
Amara Raja Batteries Ltd.
4.00%
Avanti Feeds Ltd.
4.00%
Eris Lifesciences Ltd.
4.00%
Ajanta Pharmaceuticals Ltd.
2.00%
HDFC Bank Ltd.
2.00%
HDFC Asset Management Company Ltd
2.00%
PI Industries Ltd.
2.00%
Cyclical (13%)
Companies
Weightage
Kolte-Patil Developers Ltd.
4.00%
Ashiana Housing Ltd.
2.00%
Ashok Leyland Ltd.
2.00%
SWARAJ ENGINES LTD.
2.00%
Kaveri Seed Company Ltd.
2.00%
Jamna Auto Industries Ltd.
1.00%
Slow grower (8%)
Companies
Weightage
Power Grid Corporation of India Ltd.
4.00%
Cochin Shipyard Ltd.
4.00%
Turnaround (6%)
Companies
Weightage
CARE Ratings Ltd.
4.00%
Lupin Ltd.
2.00%
Deep value (6%)
Companies
Weightage
SJVN Ltd.
1.00%
ATUL AUTO LTD.
1.00%
Jagran Prakashan Ltd.
1.00%
D.B.Corp Ltd.
1.00%
Time Technoplast Ltd.
1.00%
RACL Geartech Ltd
1.00%
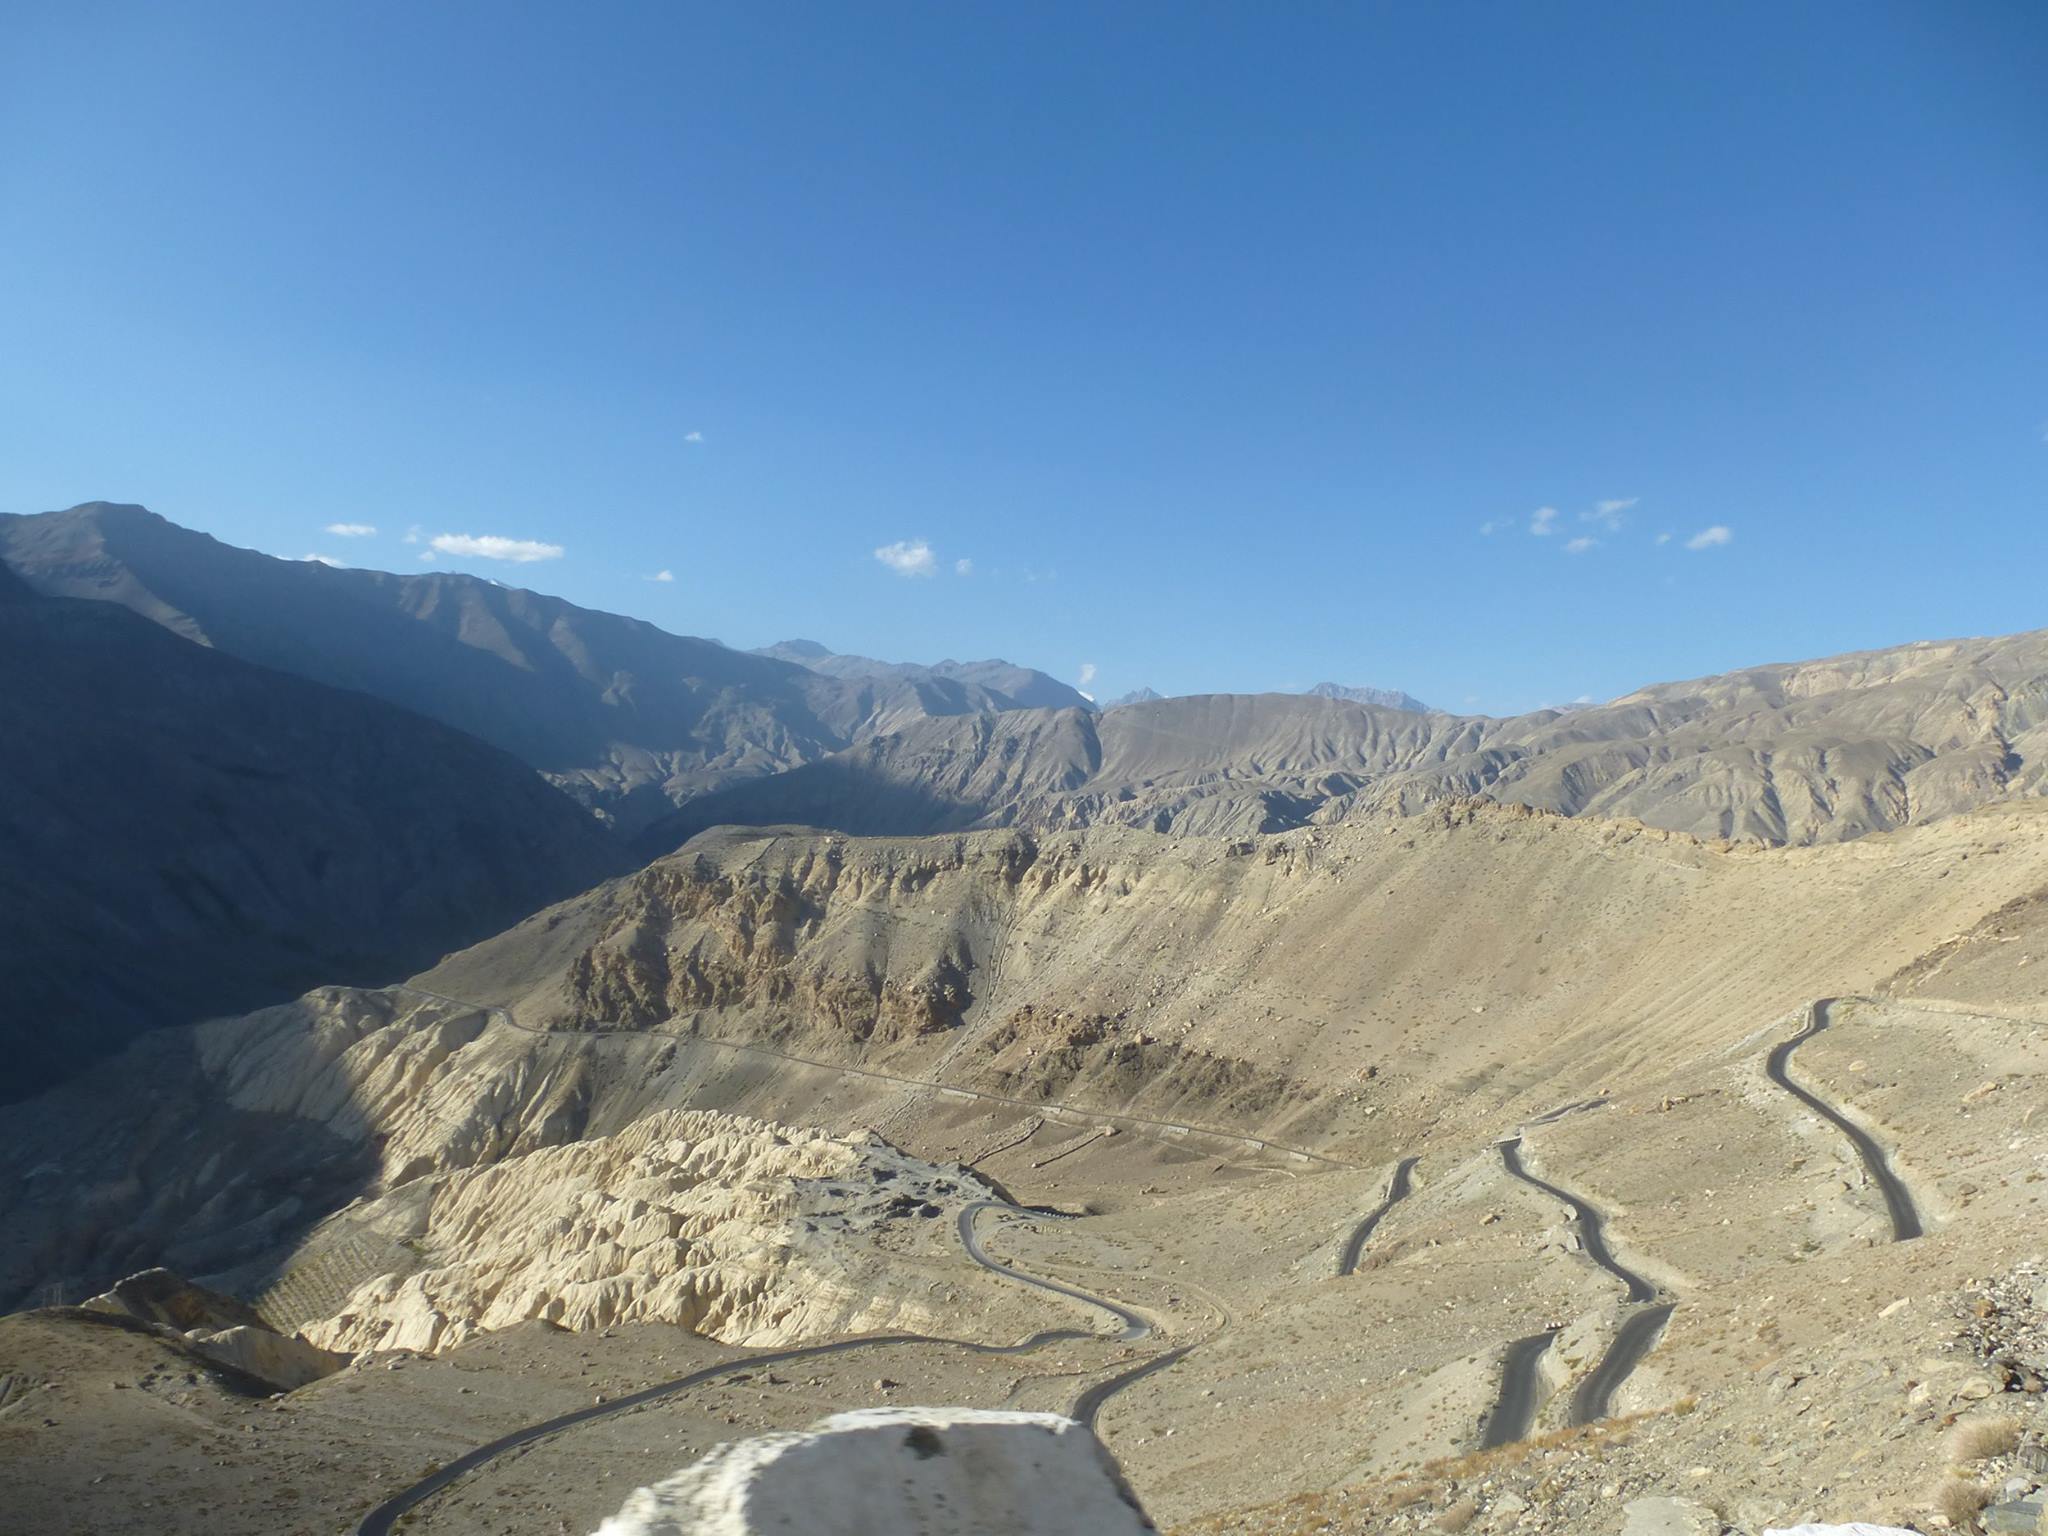
Its a very deep value opportunity currently, a 2.2 dividend translates into 8% dividend yield currently. That takes care of the holding cost. Its trading at a very deep discount to replacement value (a 10 cr. per MW translates into enterprise value of 20’165 cr. for their current active capacity of 2016.5 MW vs their current EV of ~11’000 cr.). If we take into account their future expansion plans to become a 12000 MW company by 2030, there is optionality of good growth. Depending on their execution, I will be happy to scale up my position.
Have you been to the locations they are taking about building capacity in. I have. Here is a sample of the region’s topography. As even they are saying in con calls - setting up the capacity is not a problem. Getting it out of there however, is an entirely different ball-game. That is why the optionality of growth seems, at best, very slow to me.
Please share ur thoughts on Amara Raja position. I see it as part of ur core compounder portfolio & I blv u must have built the position whn it was avlbl at a reasonable valuation some time bk.
I had also shared my views regarding its valuation earlier
However, post this thread(whn I was studying both Exide & ARBL), Exide’s sale of Insurance biz happened & I took a position thr. as I found it more undervalued, keeping the question of capital mis-allocation aside.
Still, plz do share ur thoughts on LAB industry & why u preferred Amara over Exide.
Projections as on 25.05.2021:
FY21 sales: 7’150 cr., @12% growth: FY25 sales: 11’250 cr., EV: 28’125 cr. (2.5x EV/sales translating into 25x PE), Assuming 0 net debt Mcap ~ 28’125 cr. (share price: 1649)
Business quality
Year
ROCE & ROE > 20%
Positive FCF
FY10
Yes
Yes
Total # years
12
FY11
Yes
Yes
# ROCE & ROE > 20%
7
FY12
Yes
Yes
# Positive FCF
9
FY13
Yes
Yes
FY14
Yes
No
SUM
16
FY15
Yes
No
AVERAGE
66.67%
FY16
Yes
Yes
HIGH BUSINESS QUALITY
No
FY17
No
Yes
FY18
No
No
FY19
No
Yes
FY20
No
Yes
FY21
No
Yes
Confidence in projection (Medium)
Business quality (high/medium/low): Medium (Generates FCF in majority of years, recently ROEs have dropped below 20% but ROCEs are still >20%)
Promoter quality (high/medium/low): High (Able to garner market share from exide + grew while industry was struggling)
Financial projections (high/medium/low): Medium (Maybe sales growth turns out to be <12%)
Valuation projections (high/medium/low): High (Should get 2.5x EV/sales multiples)
Is it a cyclical business (Yes/No): Yes (caters to auto OEMs and industrial segment which adds cyclicality)
Summary
Companies
Ticker
Projection date
Price
4 years fwd Price (FY25)
Price return %
Dividend yield %
Total returns %
Confidence
Business
Promoter
Financial proj.
Valuation proj.
Cyclical?
Amara Raja Batteries Ltd.
nse:amarajabat
25.05.21
764.40
1,649.00
21.19%
1.44%
22.63%
Medium
High
Medium
High
Yes
Comparison with Exide
Year
FY16
FY17
FY18
FY19
FY20
FY21
Sales growth (Amara Raja)
9.66%
15.15%
13.95%
12.11%
0.68%
4.54%
Sales growth (Exide)
10%
11%
12%
-7%
2%
PBT margin (Amara Raja)
15.65%
13.21%
11.79%
10.75%
12.29%
12.21%
EBIT margin (Exide)
11%
12%
11%
10%
10%
9%
Amara Raja has done better than Exide in terms of sales growth and margins.
Major business risks / monitorables
Lead acid battery getting replaced with lithium ion
Overambitious guidance: Management had eyed for 10’000 cr. in revenues by FY20. Only managed 6’839 cr.
Lead acid battery market is very competitive, especially from the unorganized side which account for 40% of market size
Is not backward integrated into lead (exide is backward integrated). Lead and lead alloys account for ~70% of total manufacturing cost. Currently setting up a lead smelter capacity in Chittoor
Environmental concerns: On 03.05.2021, a closure order was served to the company’s manufacturing plants located in Chittoor from the Andhra Pradesh Pollution Control Board. An interim suspension of order was granted on 10.05.2021
Receivable write-off: Wrote off 25-30 cr. of receivables from BSNL in Q4FY20 (hoping to get the amount and write it back in FY21)
Location risk: Operates from two locations in Andhra Pradesh (Tirupati and Chittoor). This offers better economy of scale and the plants are integrated with all critical components including plastics battery cases which are sourced in-house
Political affiliation: Jaydev Galla (Congress affiliation?)
Corporate governance:
High salaries
Related party transactions
There was a lot of noise made in 2014 period about upfront payment for land lease at a higher than market price, business kept performing and stock rerated
The most important thing is business has kept being good (although return ratios have deteriorated) and management has allocated a large chunk of money to grow the business, and returned the rest via dividends.
I still think valuations are favorable, one worry for me is lower free cashflow generation going forward with their very big investment in lithium ion space.
Their projected expansion plans are obviously very ambitious and probably not achievable within that timeframe. One stuck project of NHPC has led to subdued return ratios for 8+ years, this is also a risk that SJVN faces, especially given they are also making a thermal project in Bihar. Lets see how future pans out, they are definitely undervalued on their current operating capacity.
hello harsh , my two cents on kaveri seed , i m tracking this very long and invested also but exited before 6 months before , in the past maharasatra govt made pricing caping on seed , this is the whole structutral changes and in my opinion pricing power is not in hand in company , how you see this type of structural chnages, still in watchlist , your opinion matters us lot, thanks in advance.
Regulatory risk is always there in this business. That being said, the core business delivers very high return ratios and incremental growth is coming from rice seeds which is both higher margin and currently outside price controls. This is not to say that government will not regulate prices at some point in the future. In the 2007-15 period, the strong growth was due to adoption of hydrid cotton seeds and Kaveri’s good offerings in this segment. Now, growth is due to adoption of hybrid rice seeds (which offers much higher acreage, doesn’t have any royalty associated, and has higher margins). I have no clue as to how long this growth engine will be there, anyway the business doesn’t require much maintenance capex and hence most earnings are paid out to owners. Here is my speculation about Kaveri.
Updated projections as on 27.09.2021
FY21 sales: 1’033 cr., @10% growth FY25 sales ~ 1’512 cr., To sell at 4x EV/sales, EV ~ 6’048 cr., Mcap ~ 6’048 + 500 (cash) ~ 6’548 cr. (share price: 1085)
Business quality (High)
Year
ROCE & ROE > 20%
Positive FCF
FY10
No
No
Total # years
12
FY11
Yes
Yes
# ROCE & ROE > 20%
9
FY12
Yes
Yes
# Positive FCF
11
FY13
Yes
Yes
FY14
Yes
Yes
SUM
20
FY15
Yes
Yes
AVERAGE
83.33%
FY16
No
Yes
HIGH BUSINESS QUALITY
Yes
FY17
No
Yes
FY18
Yes
Yes
FY19
Yes
Yes
FY20
Yes
Yes
FY21
Yes
Yes
Management quality (Medium)
Organic sales growth greater than category level growth: Yes and no (Lost cotton market share in core AP market but gained in Maharashtra and Northern markets)
Able to find new avenues to grow: Yes (Were able to gain market share into cotton, then rice)
Treats minority shareholders in a fair manner: Yes (Very good buyback record since 2017 + consistent (but low) dividend)
Guidance shouldn’t be relied upon. Before 2015, they used to under promise and overdeliver and now the reverse is happening
In 2016, management didn’t provide for royalty payment but had to finally give 39 cr. Also, auditor was unknown at that time and SEBI had issued a forensic audit on the company. Additionally, they made political contributions to a party which was out of profits (and not CSR).
Confidence in projection (Medium)
Business quality: High (Generates very good free cashflows + high return ratios of >20%)
Promoter quality: Medium (Have been able to find new growth venues but there are certain lingering issues about taxes)
Financial projections: Medium (The high growth in rice and vegetables should be able to propel growth)
Valuation projections: High (Should easily trade above 4x EV/sales in good times)
Is it a cyclical business: Yes (seed is a cyclical business)
@harsh.beria93
A few points from my side: As per the recent investor call Lithium Ion battery will not replace Lead Acid battery. Lead Acid battery will continue to be used as auxiliary battery for a long long time.
Again read somewhere that they have done backward integration for Lead. Will search the source
There have been rumors that Amara Raja did not cooperate with PCB and the High Court told the company to cooperate with APPCB. It seems the electricity board had cut the power to the company and the company has gone to court and reestablished electricity. And then the company may have mentioned that they are moving to Tamil Nadu and later recanted its statement of moving. They have got a stay order on the PCB’s order.
There has been another instance of the same kind on Sangam diary, whose director is a senior ex MLA from TDP, to make way for Amul and this has created an uproar.
I don’t follow the company so I know nothing about the technology changes in batteries, but the chance of this political overhang remaining for extended period of time, at the least till the next election, cannot be put aside. I don’t know if these things are priced in or not.
As of today, I have reduced my stake in Powergrid from 4% to 2%. This is because its priced appropriately (close to 2x P/B) and I don’t have a clear visibility of its growth due to very high asset commissioning. This is good for free cashflow generation but creates doubts regarding business growth (or growth in book value). TBCB projects, Railtel and consultancy projects cannot fill this hole as they are still very small compared to transmission revenues. On the other hand, utilities such as NHPC and SJVN have higher growth visibility and are trading cheaper. I am thinking of giving a higher weightage to them to fill this gap. Will update once I have made a decision. Model portfolio is below, cash remains high at 25%
As of today, I added 2% stake in Aditya Birla Sun Life AMC Ltd. My speculation about the same is below
Latest projection (11.10.2021)
Sales will grow by 10% from 1’200 cr. in FY21 to 1’757 cr. in FY25. At 60% core margins and no other income (for conservativeness), PBT ~ 1’7570.6 ~ 1054.2 cr. and PAT ~ 1054.2.75 ~ 790 cr. At 50x PAT, Mcap ~ 39’500 cr. (share price: 1372)
Confidence in projection (Medium)
Business quality (high/medium/low): High (Although inferior to HDFC AMC, mutual fund is still a very good business)
Promoter quality (high/medium/low): Medium (has been consistently losing market share to bank backed AMCs)
Financial projections (high/medium/low): High (Sales should easily grow @10%+ given the underlying compounding of equity + extra inflows)
Valuation projections (high/medium/low): Medium (50x exit multiple is a little stretched)
Is it a cyclical business (Yes/No): Yes (AMC business is inherently cyclical)
Dividend pay-out will be ~50% of PAT. FY22 PAT will be ~600 cr., so dividend payout ~ 300 cr., Dividend yield at share price of 705 (market cap: 20’315 cr.) translates into 1.5%
Companies
Ticker
Projection date
Price
4 years fwd Price (FY25)
Price return %
Dividend yield %
Total returns %
Confidence
Business
Promoter
Financial proj.
Valuation proj.
Cyclical?
Aditya Birla Sun Life AMC Ltd
nse:abslamc
11.10.21
705.50
1,372.00
18.09%
1.50%
19.59%
High
Medium
High
Medium
Yes
Updated portfolio is below. Cash remains high at 23%
As of today, I have added 2% stake in Sharda Cropchem Ltd which is a part of my cyclical basket. Sharda sells agrochemicals in developed (EU, NAFTA) and developing parts of the world (LATAM). They identify molecules, register them with the authority and then source it from (mostly) Chinese vendors. As a result, they don’t have any manufacturing assets, leading to a very asset light business model. On an employee base of 175, they do turnover of >2600 cr. (14.8 cr. per employee).
Since the pollution crackdown in China starting in 2018, raw material prices have increased structurally leading to a decline in gross margins from the earlier 35% levels to the current levels of 30-32%. As a result, market has de-rated the business from earlier valuations of 2-3x EV/sales (prior to 2018) to <1.5x EV/sales post 2018. Management is very upfront about every issue, they have grown the business very well, preserved the balance sheet (net cash), funded through promoter debt when required (in FY18 gave 170 cr. at 10% interest rate to fund working capital for a few months), and given reasonable dividends (15-20% of PAT).
Apart from the Chinese supply problems, Sharda also suffers from stiff competition from innovators who set the pricing of agrochemicals. In the last few years, global agrochemical market hasn’t grown much but Sharda has grown very strongly. Here is my speculation about their future.
Projections as on 13.10.2021
FY21 sales ~ 2’400 cr., at 15% growth, FY25 sales ~ 4’200 cr., sell @2x EV/sales, EV ~ 8’400 cr., Assuming 0 cash level, Mcap ~ 8’400 cr. (930 share price)
Confidence in projection (Medium)
Business quality (high/medium/low): Medium (ROE is almost always < 20% but greater than 17%, generates reasonable free cashflow)
Promoter quality (high/medium/low): Medium (details below)
Financial projections (high/medium/low): High (15% growth seems achievable given the promoter is growth oriented, underlying business allows for 15% growth + 15-20% dividend payout)
Valuation projections (high/medium/low): Medium (Hasn’t traded at these valuations since 2018, however this multiple can be improved to 3x if gross margin improves or intangible asset turnover goes > 6x)
Is it a cyclical business (Yes/No): Yes (agriculture is a cyclical business)
Management quality (Medium)
Organic sales growth greater than category level growth: Don’t know (Don’t know the appropriate benchmark, have grown well that’s all I can say)
Able to find new avenues to grow: No (Have not found any meaningful new market, non-agri portfolio has grown slower than agri portfolio)
Treats minority shareholders in a fair manner: Yes (Reasonable dividend payout + management do not sugar coat things)
Sales growth guidance can be relied upon. Do not rely on margin guidance
Companies
Ticker
Projection date
Price
4 years fwd Price (FY25)
Price return %
Dividend yield %
Total returns %
Confidence
Business
Promoter
Financial proj.
Valuation proj.
Cyclical?
Sharda Cropchem Ltd.
nse:shardacrop
13.10.21
322.65
930.00
30.30%
1.55%
31.85%
Medium
Medium
High
Medium
Yes
Updated portfolio is below, cash remains high at 21%.