
FY23 annual report notes
Product launches:
- Launched 23 (vs 16 in FY22) products in India out of which 6 (vs 4 in FY22) were first to market. Have a basket of 500+ products (vs 300+ in FY21) with 50% being 1st to market
- One unique product launched in India was Alcarex (Alcaftadine) in ophthalmology where the previous product would give relief in 15 minutes. With the launch of Ajanta’s product, patients got relief in just 3 minutes and the effect of dose lasted for 24 hours. These improved patient compliance and convenience
- Launched 38 new products in branded generics in branded generic markets in Asia (except India)
- 1 launch in USA
- Developed 11 APIs (vs 14 in FY22)
Branded Generics (72% of revenues; grew @13% to 2’690 cr.):
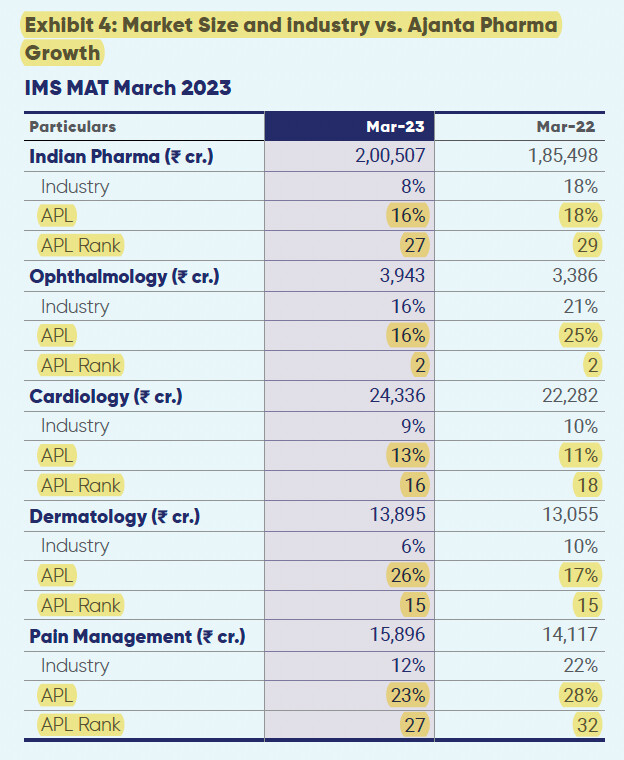
- Indian branded generics (1174 cr.) grew at 20% (IQVIA reported Ajanta growth of 16% vs 8% for IPM). IPM rank improved from 29 to 27 in FY23. Ranked 4th in covered market with 65% chronic contribution and 2.5 lakh doctor coverage
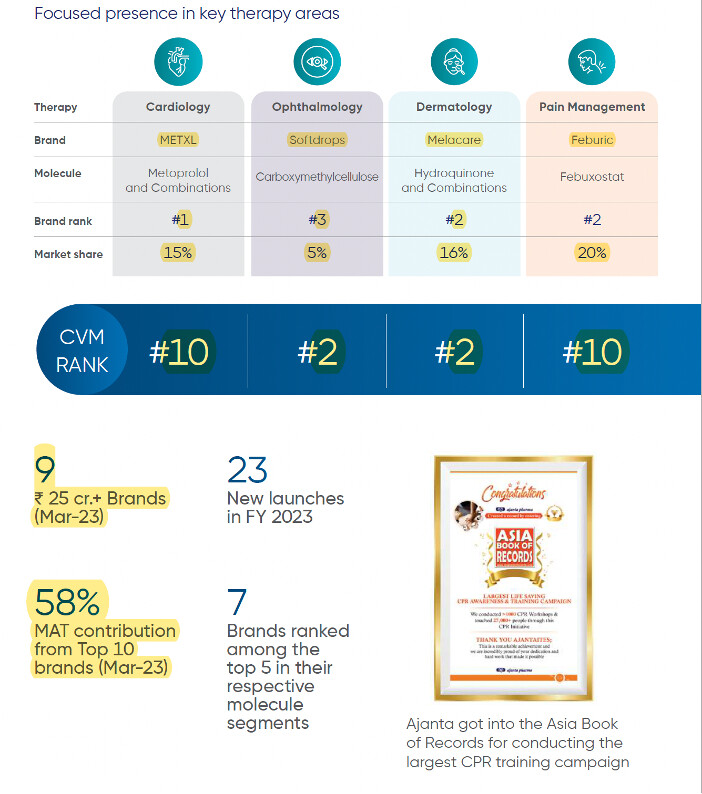
- Key brands in India
- India ophthalmology: Growth of 16% vs industry growth of 16% (IPM rank maintained at 2)
- India cardiology: Growth of 13% vs industry growth of 9% (IPM rank improved from 18 in FY22 to 16 in FY23)
- India dermatology: Growth of 26% vs industry growth of 6% (IPM rank maintained at 15)
- India pain management: Growth of 23% vs industry growth of 12% (IPM rank improved from 32 in FY22 to 27 in FY23)
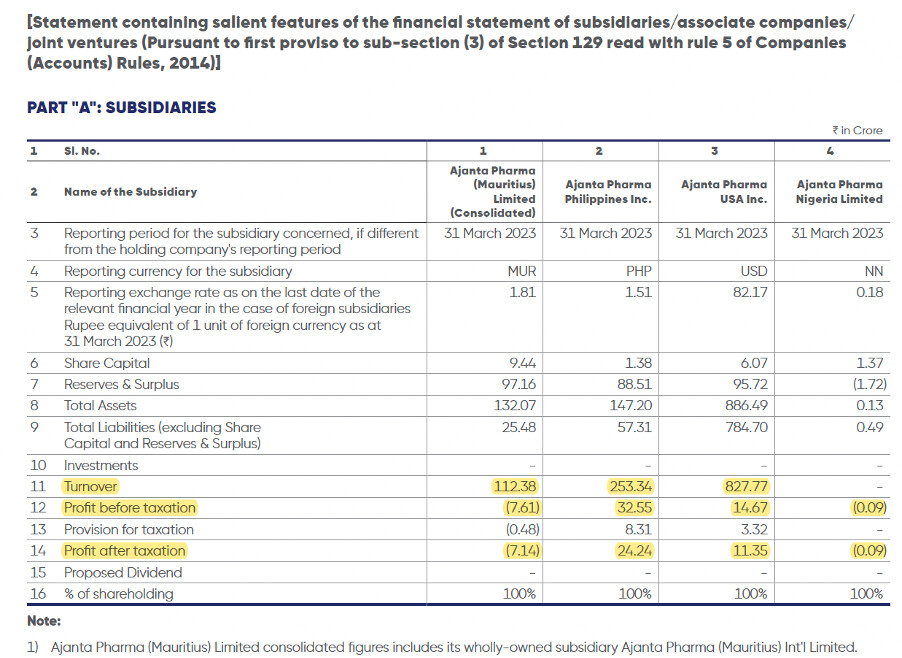
- Asia (957 cr.) grew at 18%. Philippines and the Middle East are key markets in Asia
- Africa (559 cr.) declined by (-5%). Indian Rupee’s appreciation against Euro and logistics challenges experienced during last quarter caused a 5% dip in Africa branded business
-
4500 field force (2800 MRs in India)
Generics and Institutional (27% of revenues; grew @13% to 1018 cr.):
- Africa anti-malaria institutional business (190 cr., 5% of revenues) de-grew at (–8%)
- US generics business (828 cr., 22% of revenues) grew at 19%. Filed 5 ANDAs (vs 8 in FY22) vs target of 10-12 ANDAs, received 4 final and 1 tentative approval, and launched 1 new product
- US generics experienced severe price erosion which is stabilizing in mid-to-high-single digits
- Have 21 ANDAs awaiting approval from US FDA
- Growth in USA came from intense flu season, during which oral suspension medication played a crucial role in saving numerous children’s lives.
R&D
- Developed Extended-Release/Delayed-Release oral solid dosage form products using Matrix technology (repeat of FY22 AR)
- Developed products based on solid dispersion technology similar to innovator products (repeat of FY22 AR)
- Development of Nanotechnology based ophthalmic products to enhance the ocular permeation with lower side effects and better treatment for patients
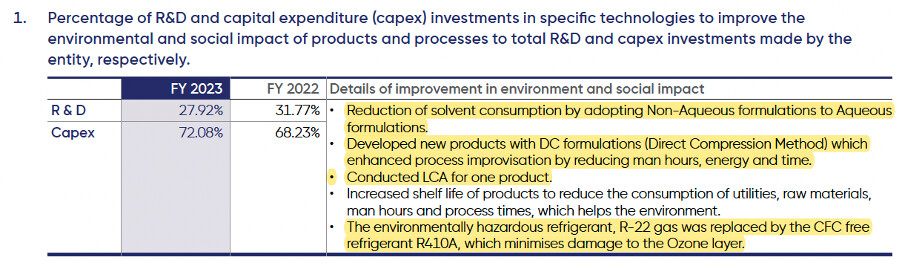
- Development of tablets for conversion from non aqueous to aqueous coating and its successful launch
- Filed 3 patents and received one for improved process for preparation of ‘Efonidipine’ by the Indian Patent Office as IN 406001
- 850+ scientists (vs 750+ in FY22)
-
Total R&D expenses was 6% (vs 6% in FY22) of revenue (255 cr. vs 204 cr. in FY22); capital expenditure: 18 cr.
Financial Performance:
- Consolidated revenue grew by 12% to 3’743 cr.
- EBITDA margin reduced to 21% (vs 28% in FY22). Margins were impacted from higher raw material prices, higher freight costs and US price erosion. It will climb back to about 25% in FY24
- PAT de-grew by (-18%) to 588 cr.
- Cash ~ 841 cr. (vs 334 cr. in FY21), Paid back 479 cr. (vs 436 cr. in FY22) (buyback + dividend) and generated free cashflow of 463 cr. (vs 453 cr. in FY22)
- Gross margins compressed from 75% to 72% due to higher API prices resulting from the conflict and uncertain world scenario, higher price erosion in the US, and a few one-time inventory write-offs. Expect this to improve by 200 basis points in FY24.
- ROCE was down from 28% in FY22 to 22% in FY23
- Employee cost increased from 19% to 21% of sales because of expansion in international field force by 50% and small addition in production and R&D
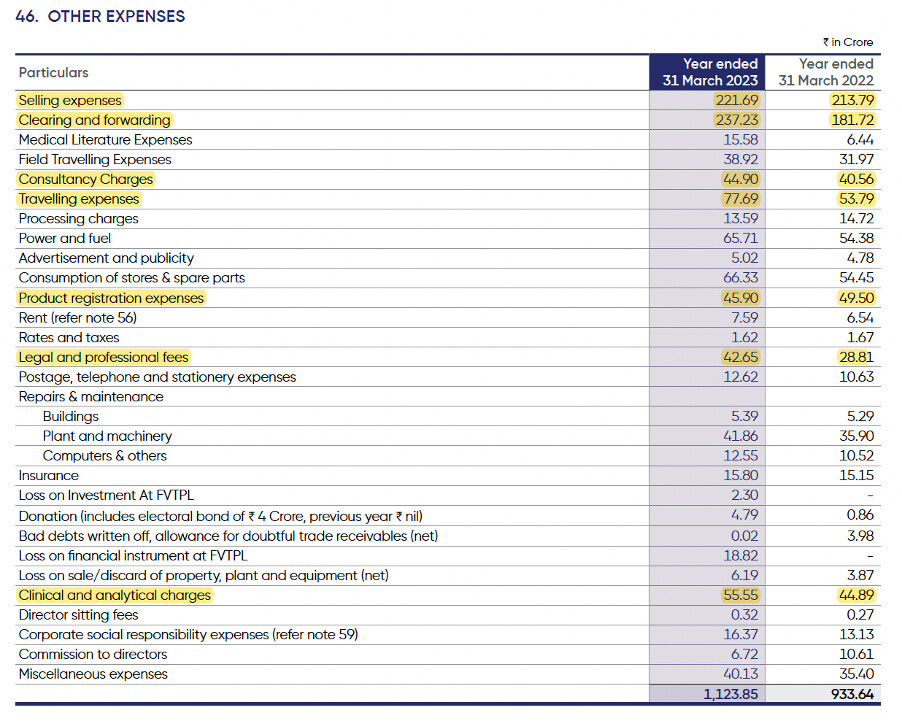
- Other expenses increased from 28% to 31% of sales because of higher freight costs impacting by 200 basis points and forex derivative loss impacting by about 100 basis points
Strategy:
- Enhanced capital allocation to branded generics business with accelerated product filing and enhanced ground presence. Increased product filings by three times and enhance team size by 50% in the rest of Asia and Africa market
- US: Decided to reduce capital allocation due to increased uncertainty and continuous price erosion
Share issuances:
- ESOP: During the year, 1’000 shares were issued against options exercised (vs 4’000 in FY22)
- Bought back 2’210’500 shares at 1’425 price (vs 1’120’000 shares at 2’550 price in FY22)
Other Points:
- Spent 160 cr. on maintenance CAPEX (vs 154 cr. in FY22). FY24 capex will be ~200 cr.
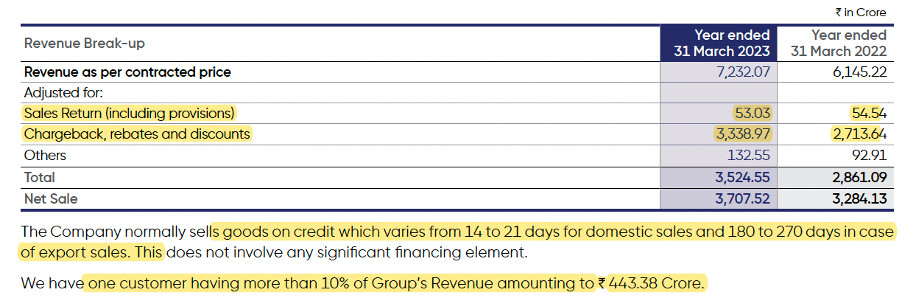
- Receivable days reduced to 104 days (vs 113 days in FY22) due to higher branded contribution
- Inventory days reduced to 80 days (vs 88 days in FY22) due to supply chain normalization
- Trade payable increased to 79 days (vs 70 in FY22)
- Auditor remuneration at 1.07 cr. (vs 1.1 cr. in FY22)
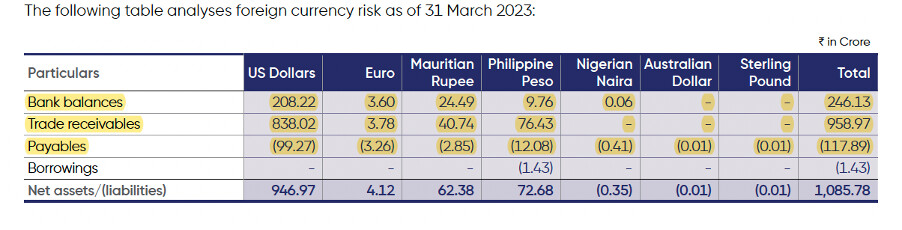
- Hedging policy: company generally does currency hedging up for 6 to 18 months and up to the extent of 50% to 75% (vs 50% to 150% in FY22) of its net foreign exchange earnings
- No major contingent liability (~5 cr. vs 7 cr. in FY22)
- Employee count: 7’713 (vs 7‘234 in FY22) (median salary increase: 11%)
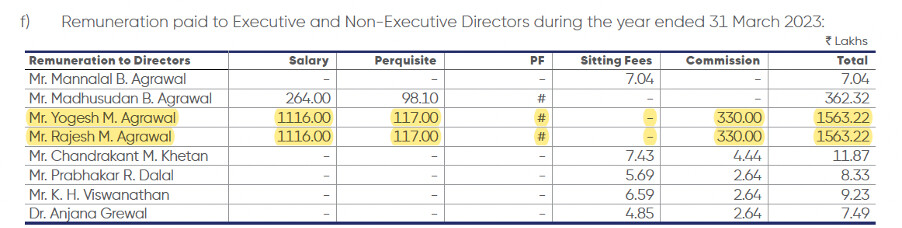
- Managerial remuneration reduced (-0.8%) mainly on account of reduction in quantum of commission due to reduction in net profit
- CSR: Spent 16.37 cr. vs obligation of 15.54 cr.
- Share price high: 1427.5, low: 790.66
- Number of shareholders: 84’973 (vs 62’139 in FY22)
- Won “Best Managed Companies for 2022” award from Deloitte
- Solar energy currently fulfills 11% of total energy requirement and is expected to increase to 32% in short term and to 50% in next two years
- Digitization: Two of our facilities are highly digitized. We can now warehouse all the data of all the manufacturing equipment and quality-control equipment in a central platform, and utilize it for data analytics. This helps us to do predictive analytics of any equipment breakdowns and variabilities
- Had 83 customers (vs 75 in FY22) that owed them >0.5 cr. and accounted for 91% and 93% of total outstanding as of FY23 and FY22
- Sales return and rebates
Other expenses
Management Remuneration
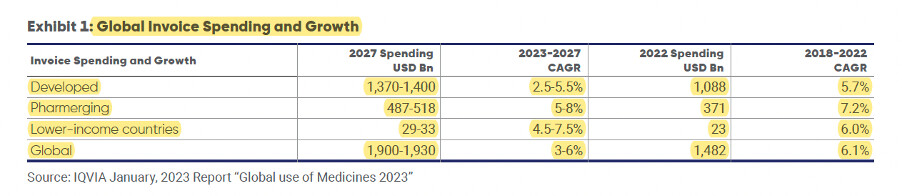
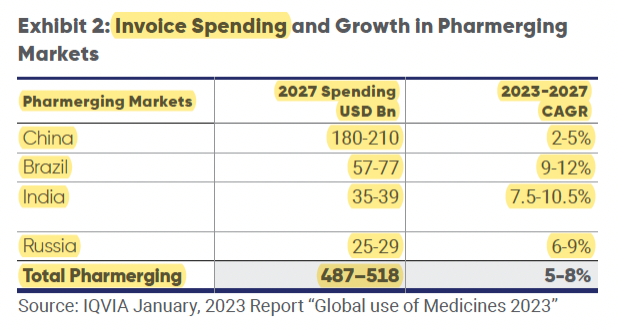
Global trends:
Subsidiary
Foreign currency exposure
Disclosure: Invested (position size here, no transactions in last-30 days)