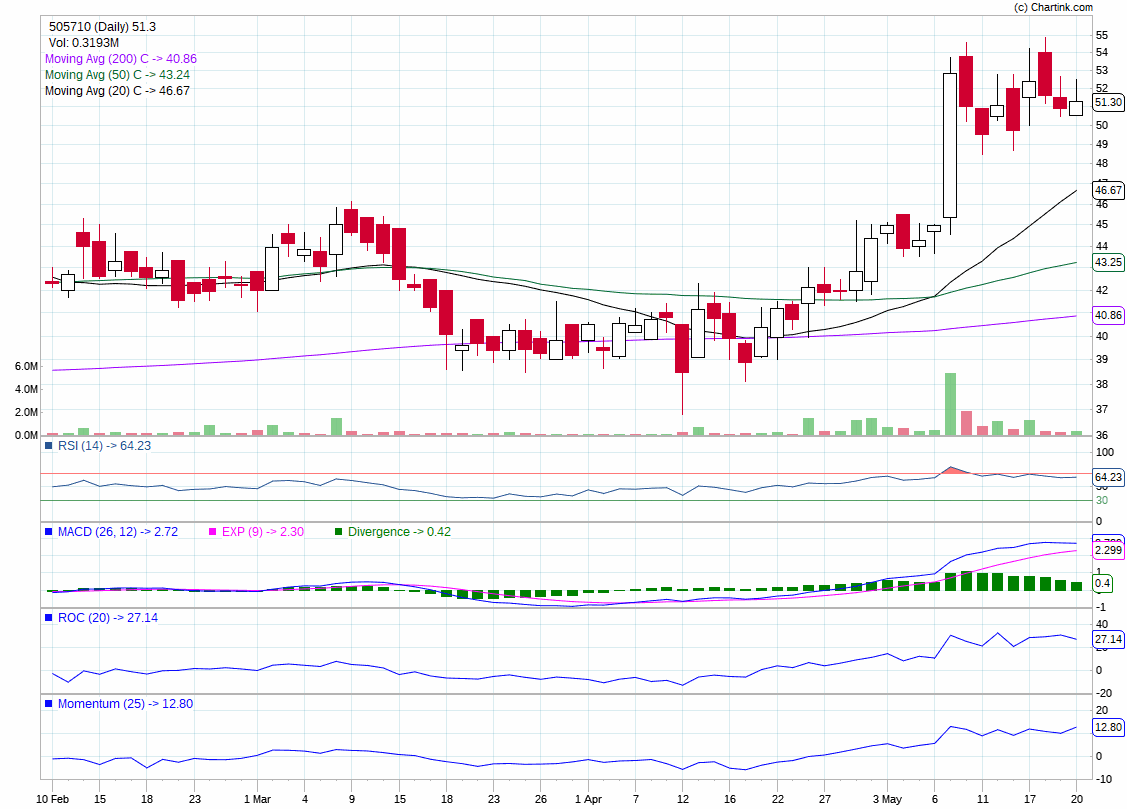
i need some inputs on a typical situation. A stock does a breakout or 52 week high and after that the price declines 5-7% from the high. Post this the stock is in very tight consolidation range with limited volumes (significantly less than 3 month average). How should this be interpreted? Is it a bullish or bearish trend?
Hey, if there was a chart it would have much better. But from what you have described, it looks like a bullish signal. A stock will normally retrace after a breakout. The retracement is usually on low volume. Once all the sellers are shaken out the stock should see an up move. Thanks.
Hi Nikhil , Typical signs ( though not always but mostly ) for you : Bullish signs --Low volume --tight range --limited downside ,small candles with longer lower wicks Bearish signs --Decline with above avg. volumes , engulfing Bearish candles , negligible lower wicks and longer higher wicks
& as the earlier poster mentioned a chart pic would really help to get your specific query addressed !
Looks like consolidation in both the cases but candles have to be read in context …you need to know for swing or slightly longer term trading :
First pic : In the first pic it made a break-out candle of ~20%(44.8 to 53.8)…after such a big move the stock will rest for a while ( could be few days to few weeks --Nobody knows but if I was invested from lets say at 44 or 45 …I will stay long till it breaks the low of the 20% bullish candle ) and then start its onward Journey but it needs to take into context recent events (1) Broader mkt trend (2) Qtrly performance of the stock and its sector …so there is nothing called pure technical–for a good trader it requires contextual awareness of the stock’s current eco-system ( performance / sector&mkt performance )
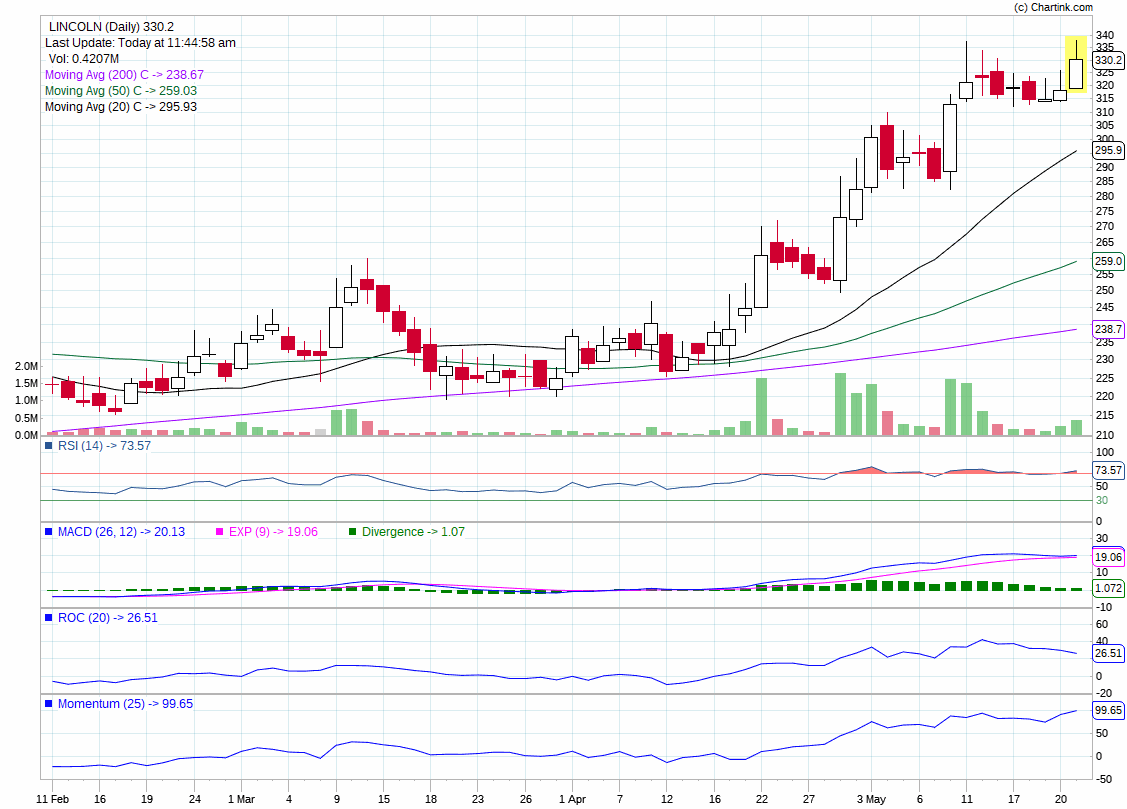
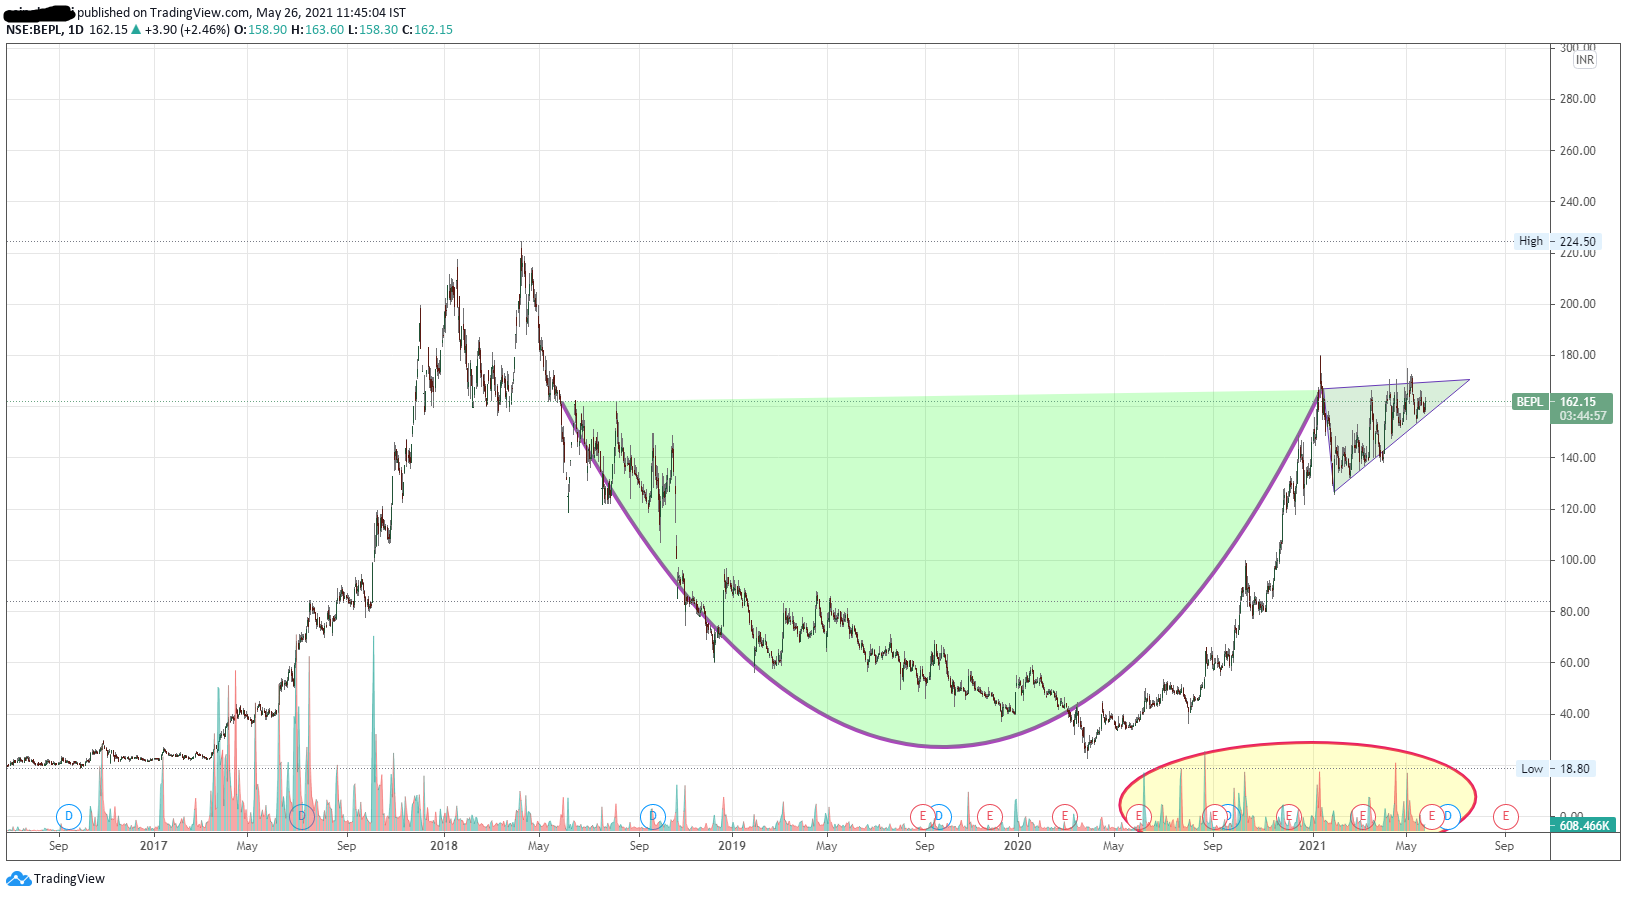
In the case of Lincoln : This looks like an interesting stock --wherein the Promoter is already increasing its take for 3 Qts in a row ( Sep:32.41% ,dec:33.41% , Mar:37.26% , source : screener.in) --which is a big positive in my books …for longer term play after looking at fundamentals as well since any sustainable move will be based on fundam. over long term.
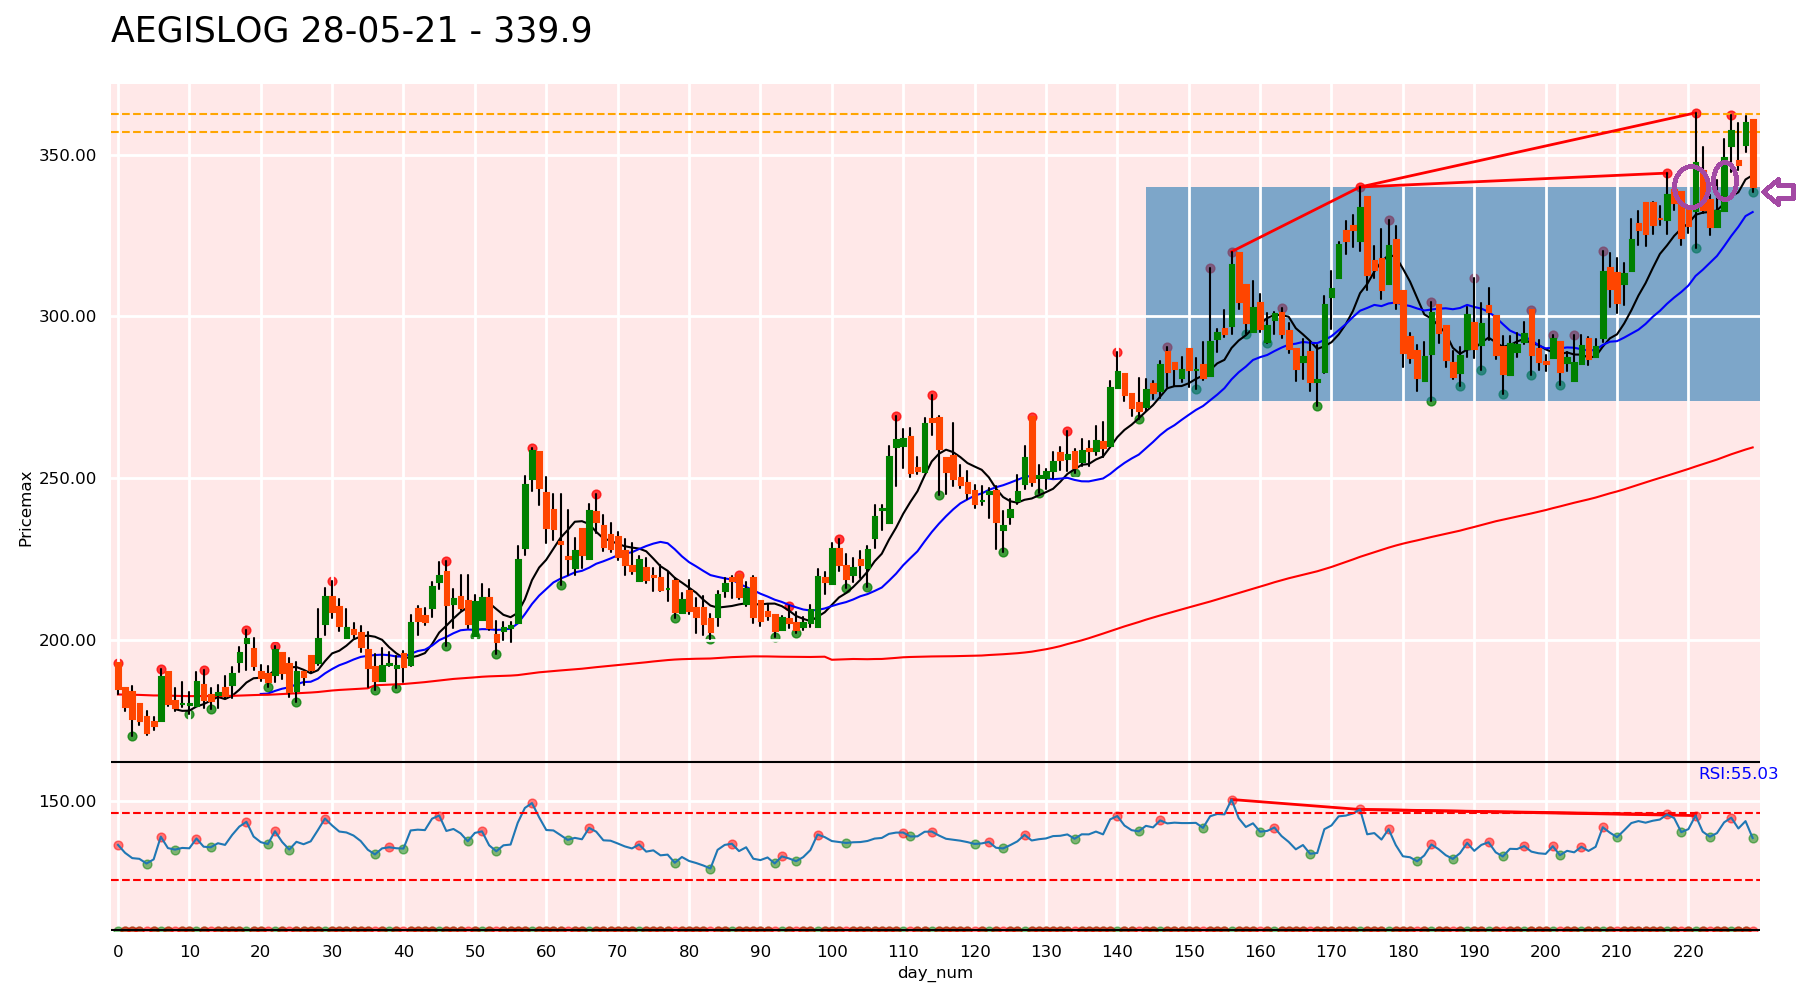
For a short term : the results are on 25th , hence any move ( up/down) will happen post that . Do notice that after a consol. from Mar till Mid-Apr the stock has been forming HH bases ( in the 3rd base right now ) with large vol. spikes indicating bullish behaviour…so if i was holding it from the base in Mar/Apr mid --I will keep holding it ( with a stop-loss of-course) & see what moves it makes post results and then take a call to continue to hold or exit . The caution here is that i will not get into the result day without a stop-loss ( recent eg. of Ultramarine pigments to see the -ve reaction of 15% massive red candle ,not to say it will happen here but quoting just an eg. of the pitfalls/dangers ) , do watch the weekly candles to see how extended they are …& whether there will be a natural ‘resting’ phase ranging from few day to weeks to months…thats a call one needs to take individually based on price action …!!
Thanks for the feedback.
Both Stock touched 52 W high yesterday so it does seem that it was consolidation. Fundamentally Lincoln is into transformation phase (Promoter moving from typical owner mindset to little more professional) - It is cheap and if corporate governance can improve then the stock can go higher. Also important to note is that it has crossed ATH of last many years in this current move which started from ~240. So something may be happening. It should have strong support at ~305-310 and @275-280.
I hold from earlier and will like to keep a bigger SL at 280 to ride any short term fluctuations.
Regards
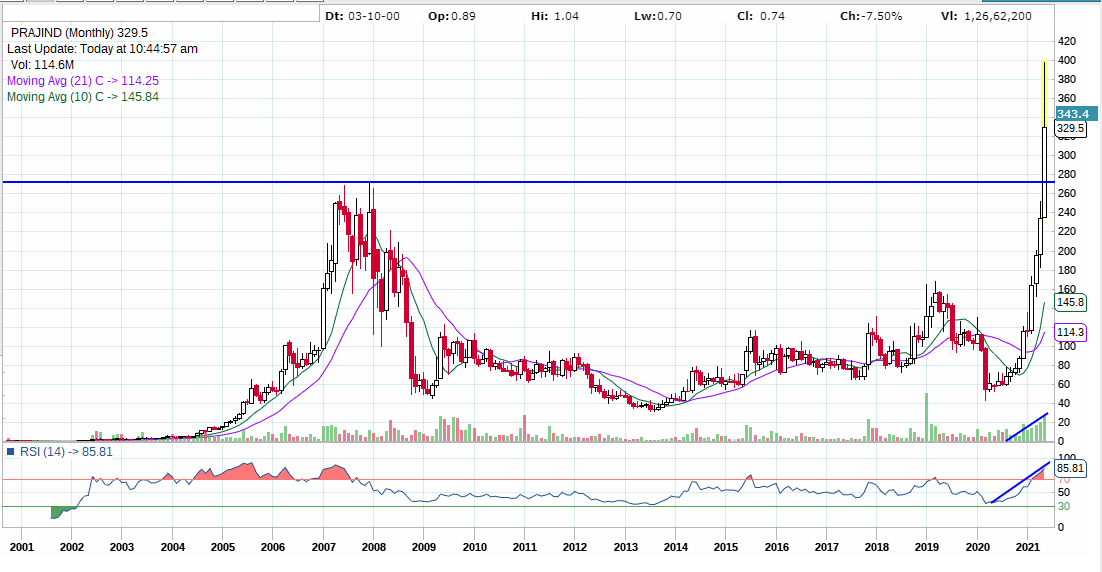
Praj broke out above its 2008 high and trading at ATH now. 13 years of trendline breakout. Results for this qtr is good and its also into clean energy theme among others.
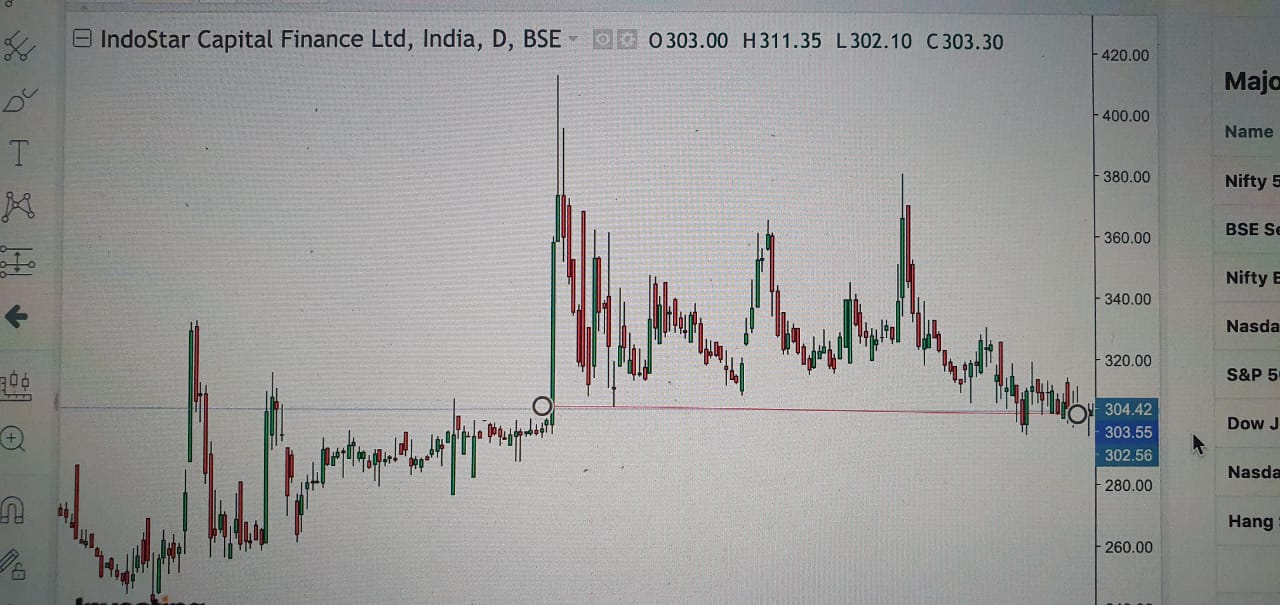
Indostar capital finance a strong cup formed and has support at 300 levels addeda vey small position today hoping for a handle to form and how it plays out as risk reward ration seems favourable
Fundamentals :-90 % plus promoter holding sales has doubled in past 5 years ,trading below book value only concern is not comfortable with holding small nbfc due to covid
Hey, I think for every technical analysis volume behaviour is also must. The volume must be minimum at the bottom of the cup or else the chart could be faulty. Also, it would be better to draw the area of the cup you are referring to, so that others can identify it easily. Thanks.
Edit: as per William O’Neil, before every cup formation, there should be at least 30% upside move. I don’t see this in the chart but i am sure I am not reading the chart the way you are.
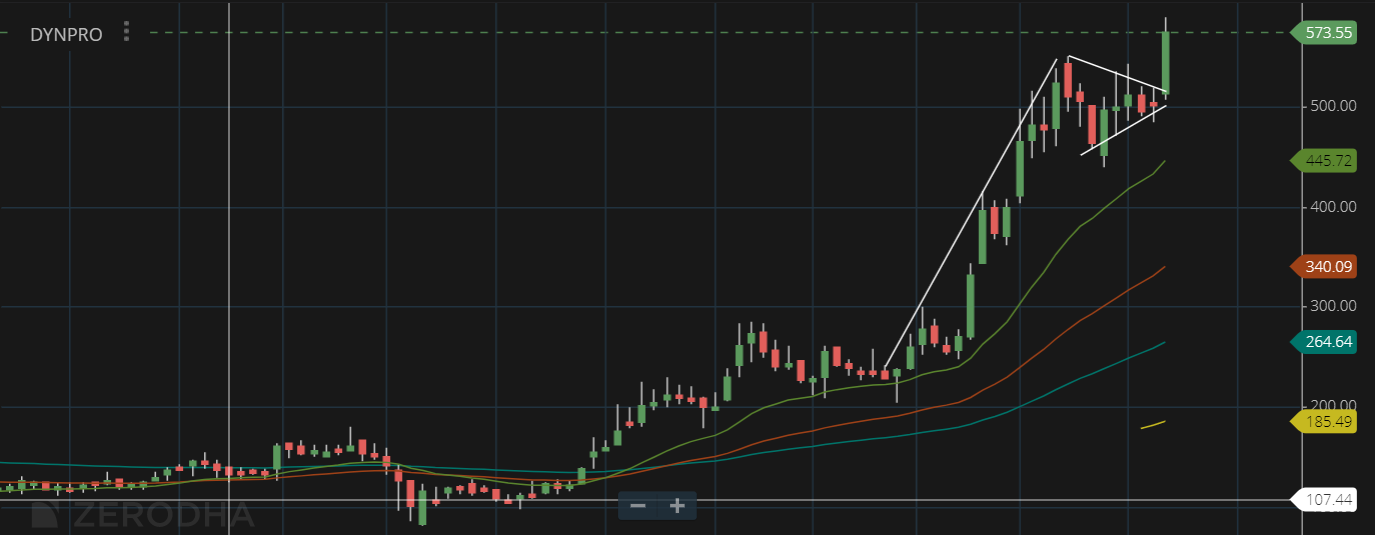
Dynemic Products, Weekly - Flag formation and a breakout this week. The fundamentals have been dissected with a lot of detail in the wonderful VP thread here. This is a simple capex completion play - CWIP = 3x Fixed Assets. There is a lot of capacity and if they are able to sell the capacity in the next 2-3 years, there is a lot of scope for growth. At current prices, there might still be value. The risk is if they aren’t able to grow and the depreciation hits the PnL hard post completion. Also, its a illiquid microcap.
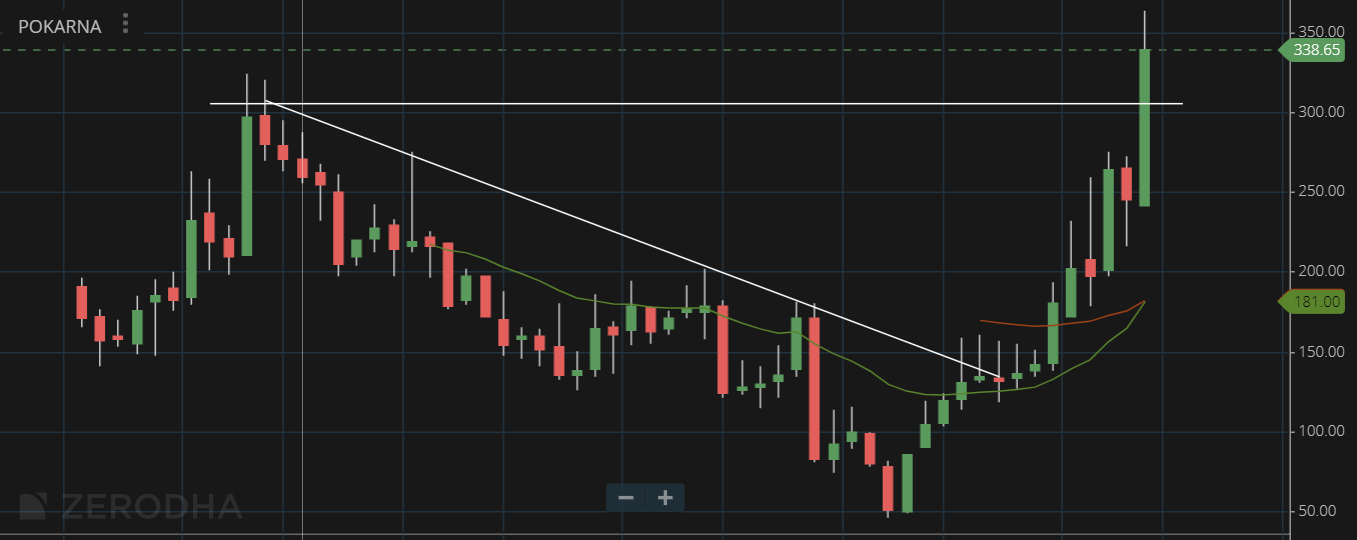
Pokarna, Monthly - ATH Breakout. Again lot of great work done on the fundamentals already in the VP thread here. This again is a international housing growth + capex completion play - with CWIP = 2xFixed Assets. The thread captures the possibilities. The price probably doesn’t yet capture the possible growth. Again, there are similar risks of not being able to grow and taking the depreciation hit in the near term. Valuation is still in favor if the view is bit long
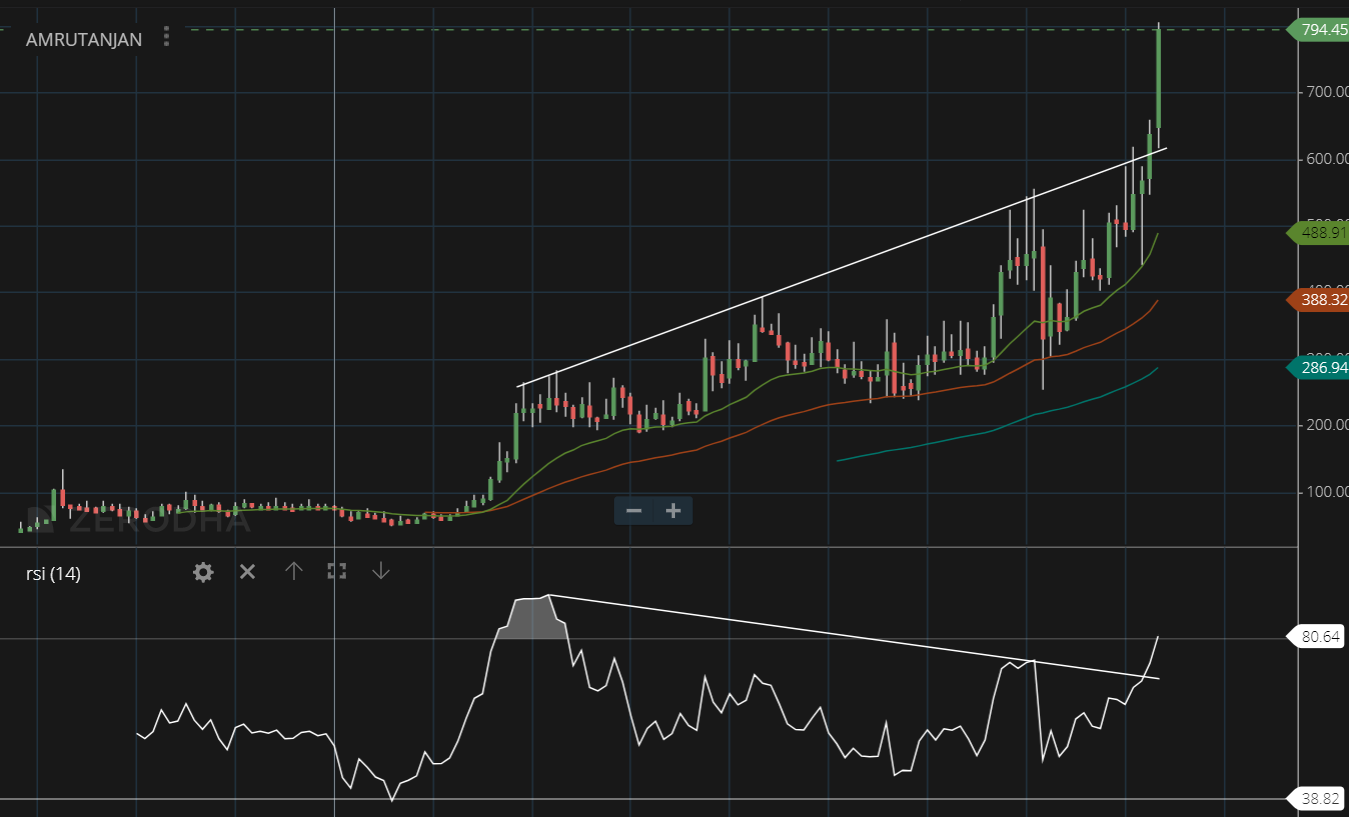
Amrutanjan, Monthly - Breakout from a 6 year consolidation. Numbers last couple of quarters have been great but as I have mentioned here before here and here, I am not convinced on what’s driving growth and it looks like neither is the management. It might just be Covid driving it. Valuation is still cheap if these numbers are sustainable.
Disc: Have position in Dynemic from 500 levels. Pokarna from 220 (Added around 300 when it was breaking out) and Amrutanjan from 460 (Added more recently)
@Jiitt007 - No I don’t. I reduced some around 12 and sold out completely between 9-10 much later as better opportunities showed up. The thesis of not going bust and surviving played out but thriving, am not seeing signs yet. Can always change my mind if evidence shows up.
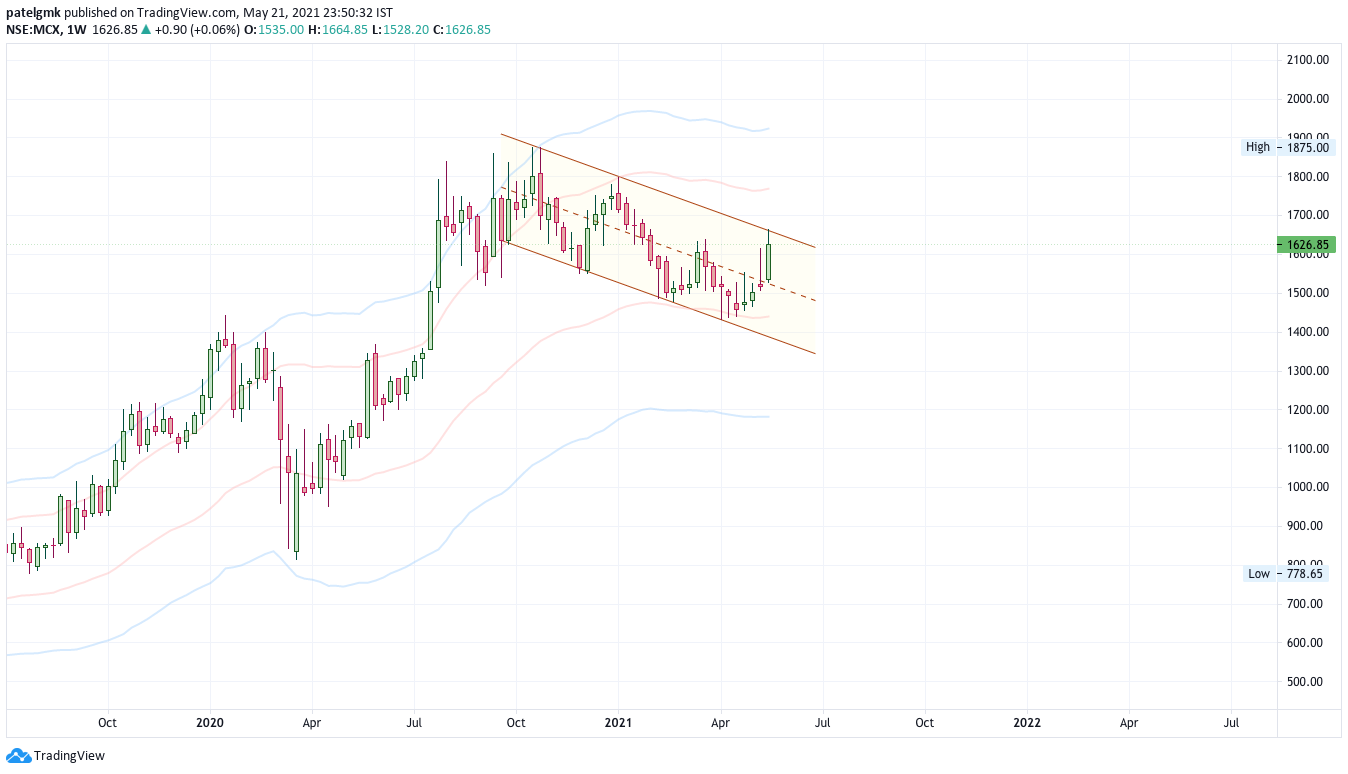
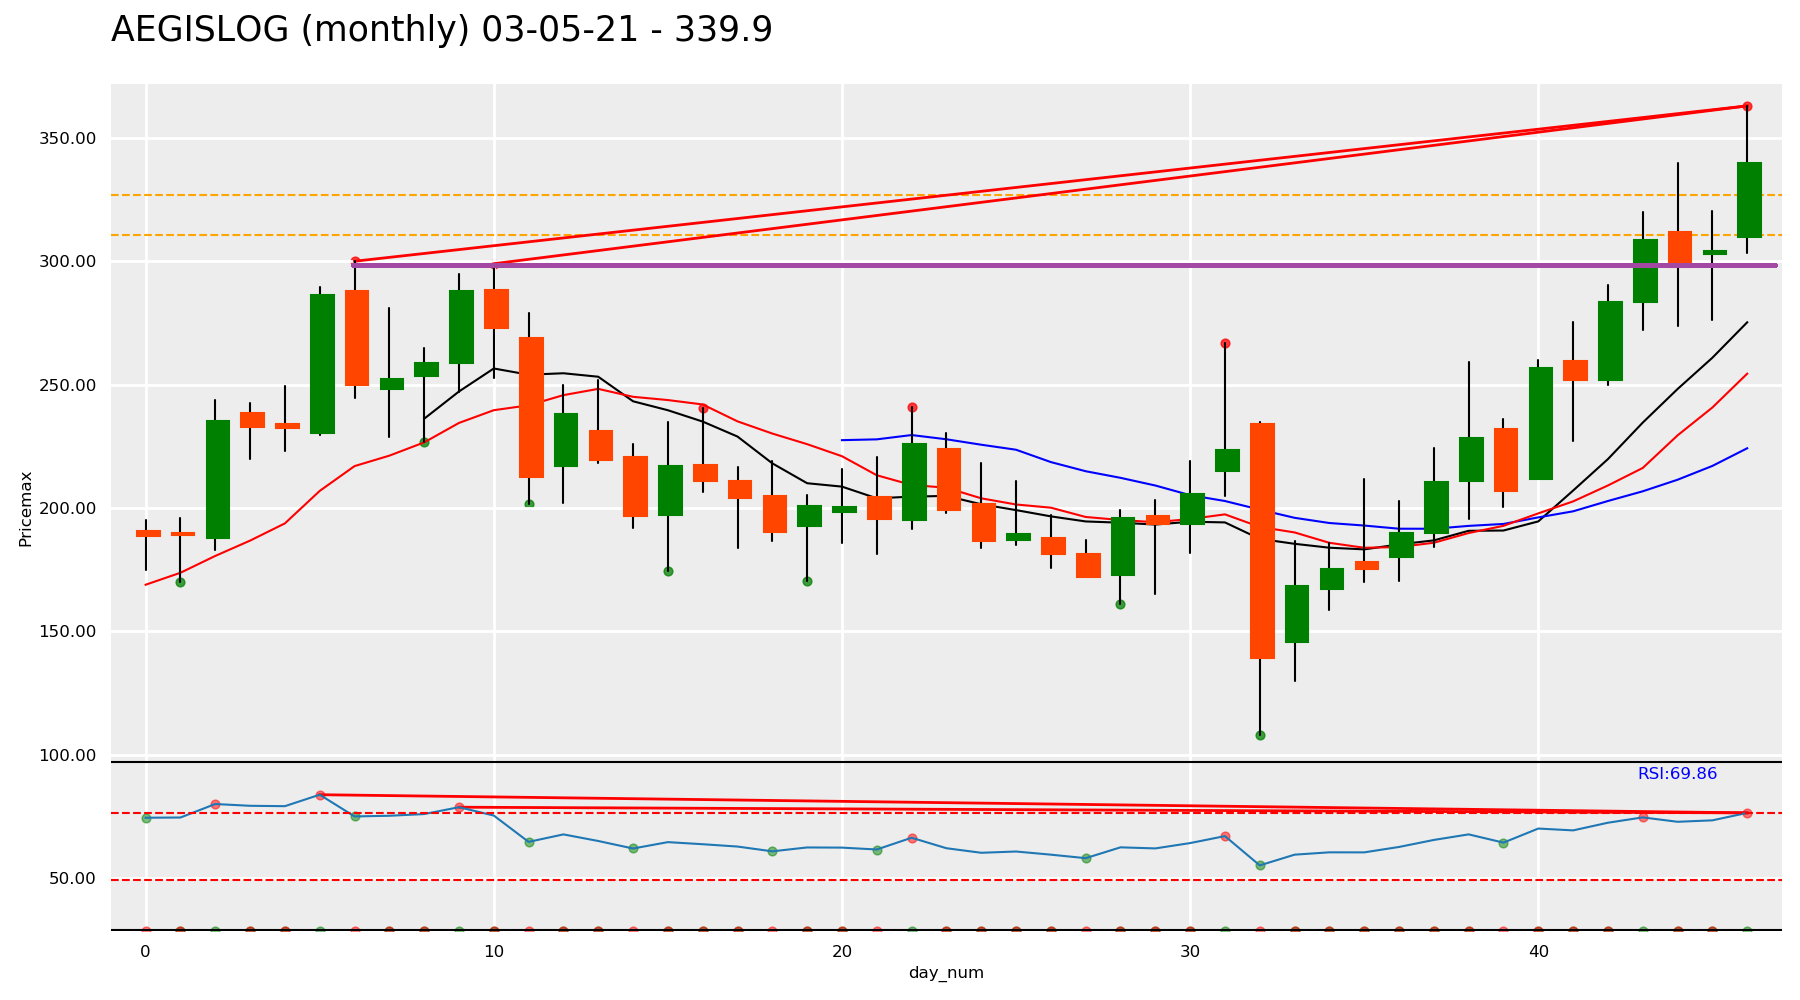
Aegis logistics… It has done two BO at same levels and retesting the same … I believe it is weak breakout but still if it sustain above 325 then further highs … On monthly charts it has given a good breakout
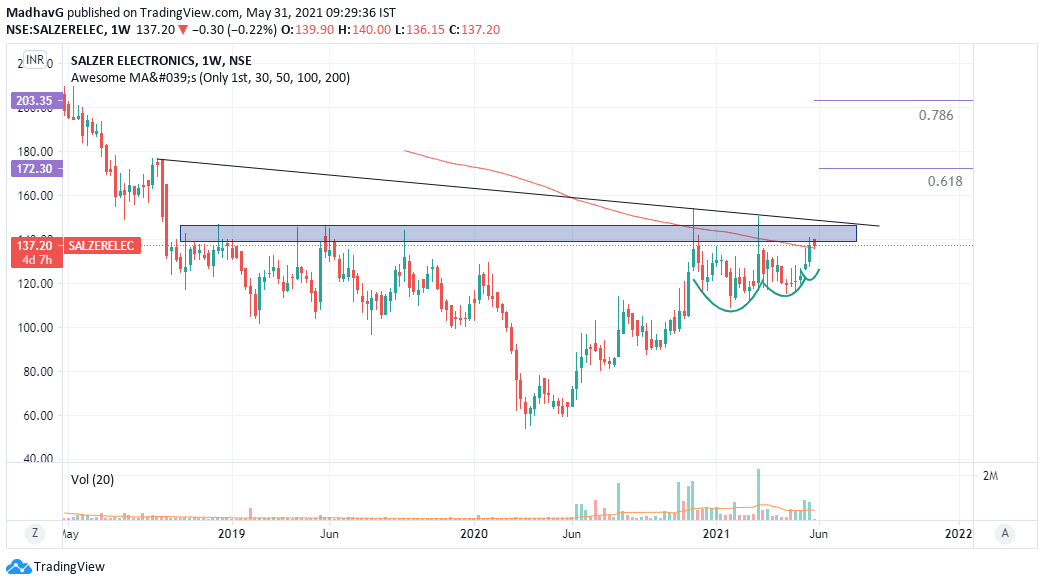
Salzer Electronics can go ballistic above the supply zone.
Avaliable at ~10 P/E
Primarily involved in making industrial switches
Can get favourable tailwinds from cable sector
Have good clientage - L&T, Schneider, GE, Indian Railways, Honeywell, OTIS
Market cap is small so may not be favourable for biggies.
Hello All - Trying to learn TA & the major patterns. Can someone pls critique if Maruti Chart shows a valid Cup & Handle pattern on monthly chart attached?