
This is not a valid cup and handle pattern.
7 Likes
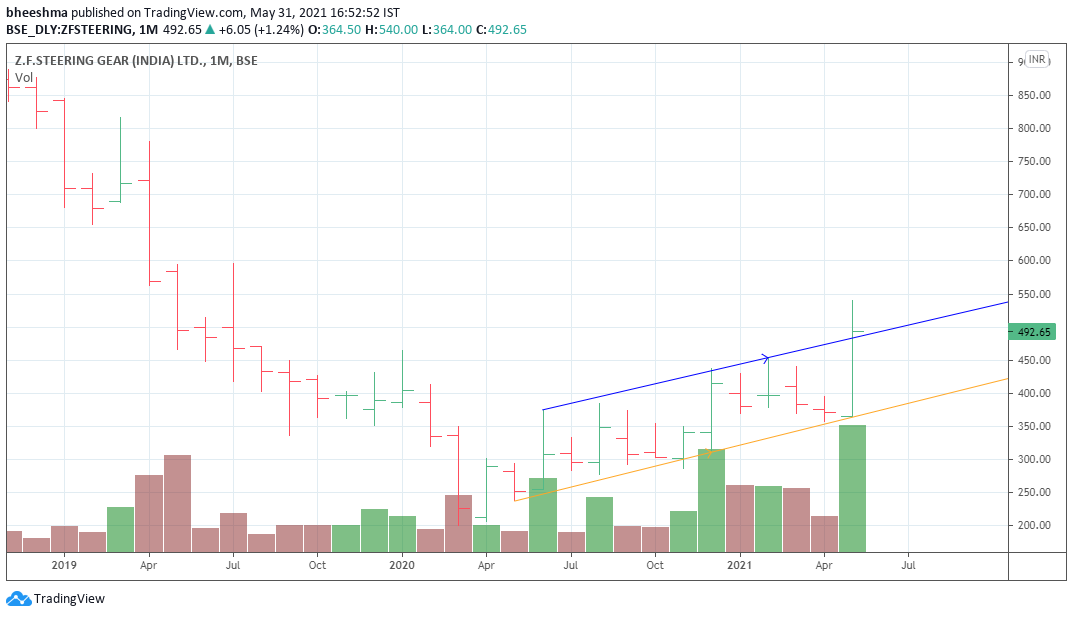
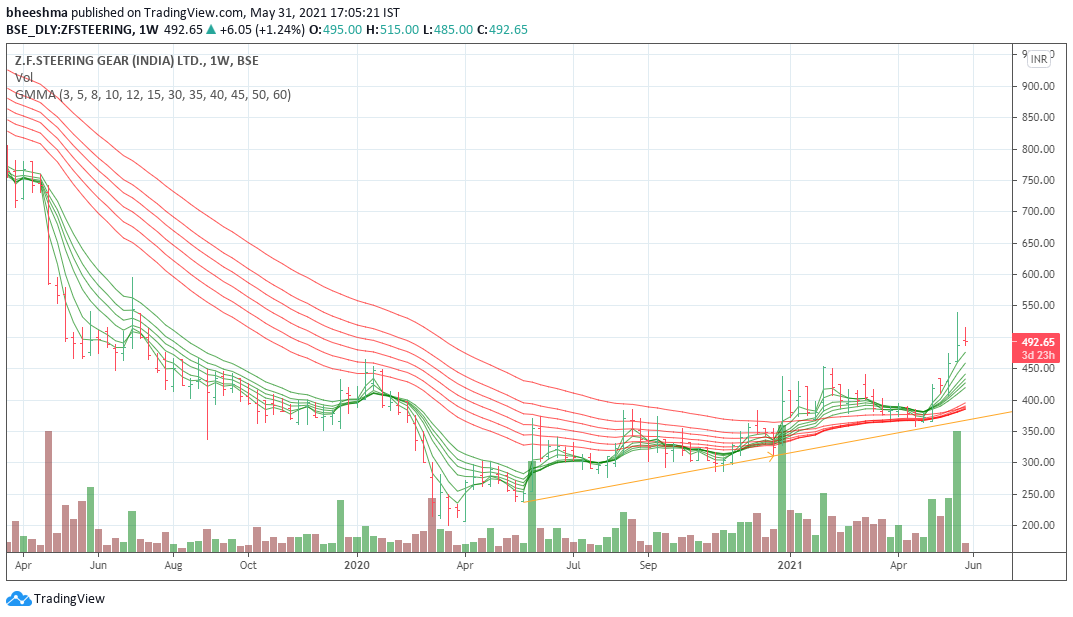
Chart of ZF Steering India
A simple upward channel breakout on heavy volumes on the monthly chart and a close above
it. All Short term guppy moving averages have all moved over the long term ones.
Some changes have happened in the co -
- Their JV with ZF and later Bosch after Bosch took over had been in the red since inception. ZF had a 26% stake in this business in which they had pumped in a lot of money ~130 crs for years. The total accumulated losses of the JV stood at 383 crores. This loss-making JV was terminated in July 2019 and they received a consideration of 62 crores for their stake. This loss created a deferred tax asset of 25cr which co can use to reduced tax liability. The co also has liquid investments of 120cr
- The co posted good numbers in H2’21 posting a 6M H2 eps of 11.7 from a loss in H2’20.
- The co has always been cash flow positive and with the overhang of this loss making JV out of the way it seems things are improving on the profitability and balance sheet front.
Best
Bheeshma
7 Likes
Coastal Corporation.
Business - Seafood processing. Shrimps exports.
Micro cap with ~230 crs. of Mkt Cap. CMP - 222.
Ascending triangle BO (crossed 200 DMA) with all time high volumes on daily, weekly and monthly charts.
50 DMA about to cross 200 DMA.
Not participated in current rally and has taken support at 170 at the trendline and sharply bounced back.
Sector charts are looking better for other companies too.
Good return ratios, inexpensive valuations, good FCF and OCF yields (20%+), New capex almost doubled capacity, Mgmt subscribed to warrants at Rs.187/- (though still low promoter holding).
Shrimp exports should pick up as western countries open up and China eventually lifts import restrictions. Shrimp demand from household segment has shot up in the absence of demand from HORECA segment but even after opening up I think the retail household demand should be more the pre-covid levels (due to healthy diet adoption and ease of cooking). Sector has Govt. focus too (allocation of 40k Crs towards aqua culture). Promoter takes Rs.33 lacs as salary and 2.5% of Net profits as commission (till now couldn’t find any major negative on Promoter).
Short term issues due to Covid remain like labour issues, logistics issues (due to Covid) and subject to RM prices volatility, etc., but these issues should get resolved sooner than later and next 2-3 yrs can be good business wise.
Weekly Chart
Return Ratios:

5 Likes
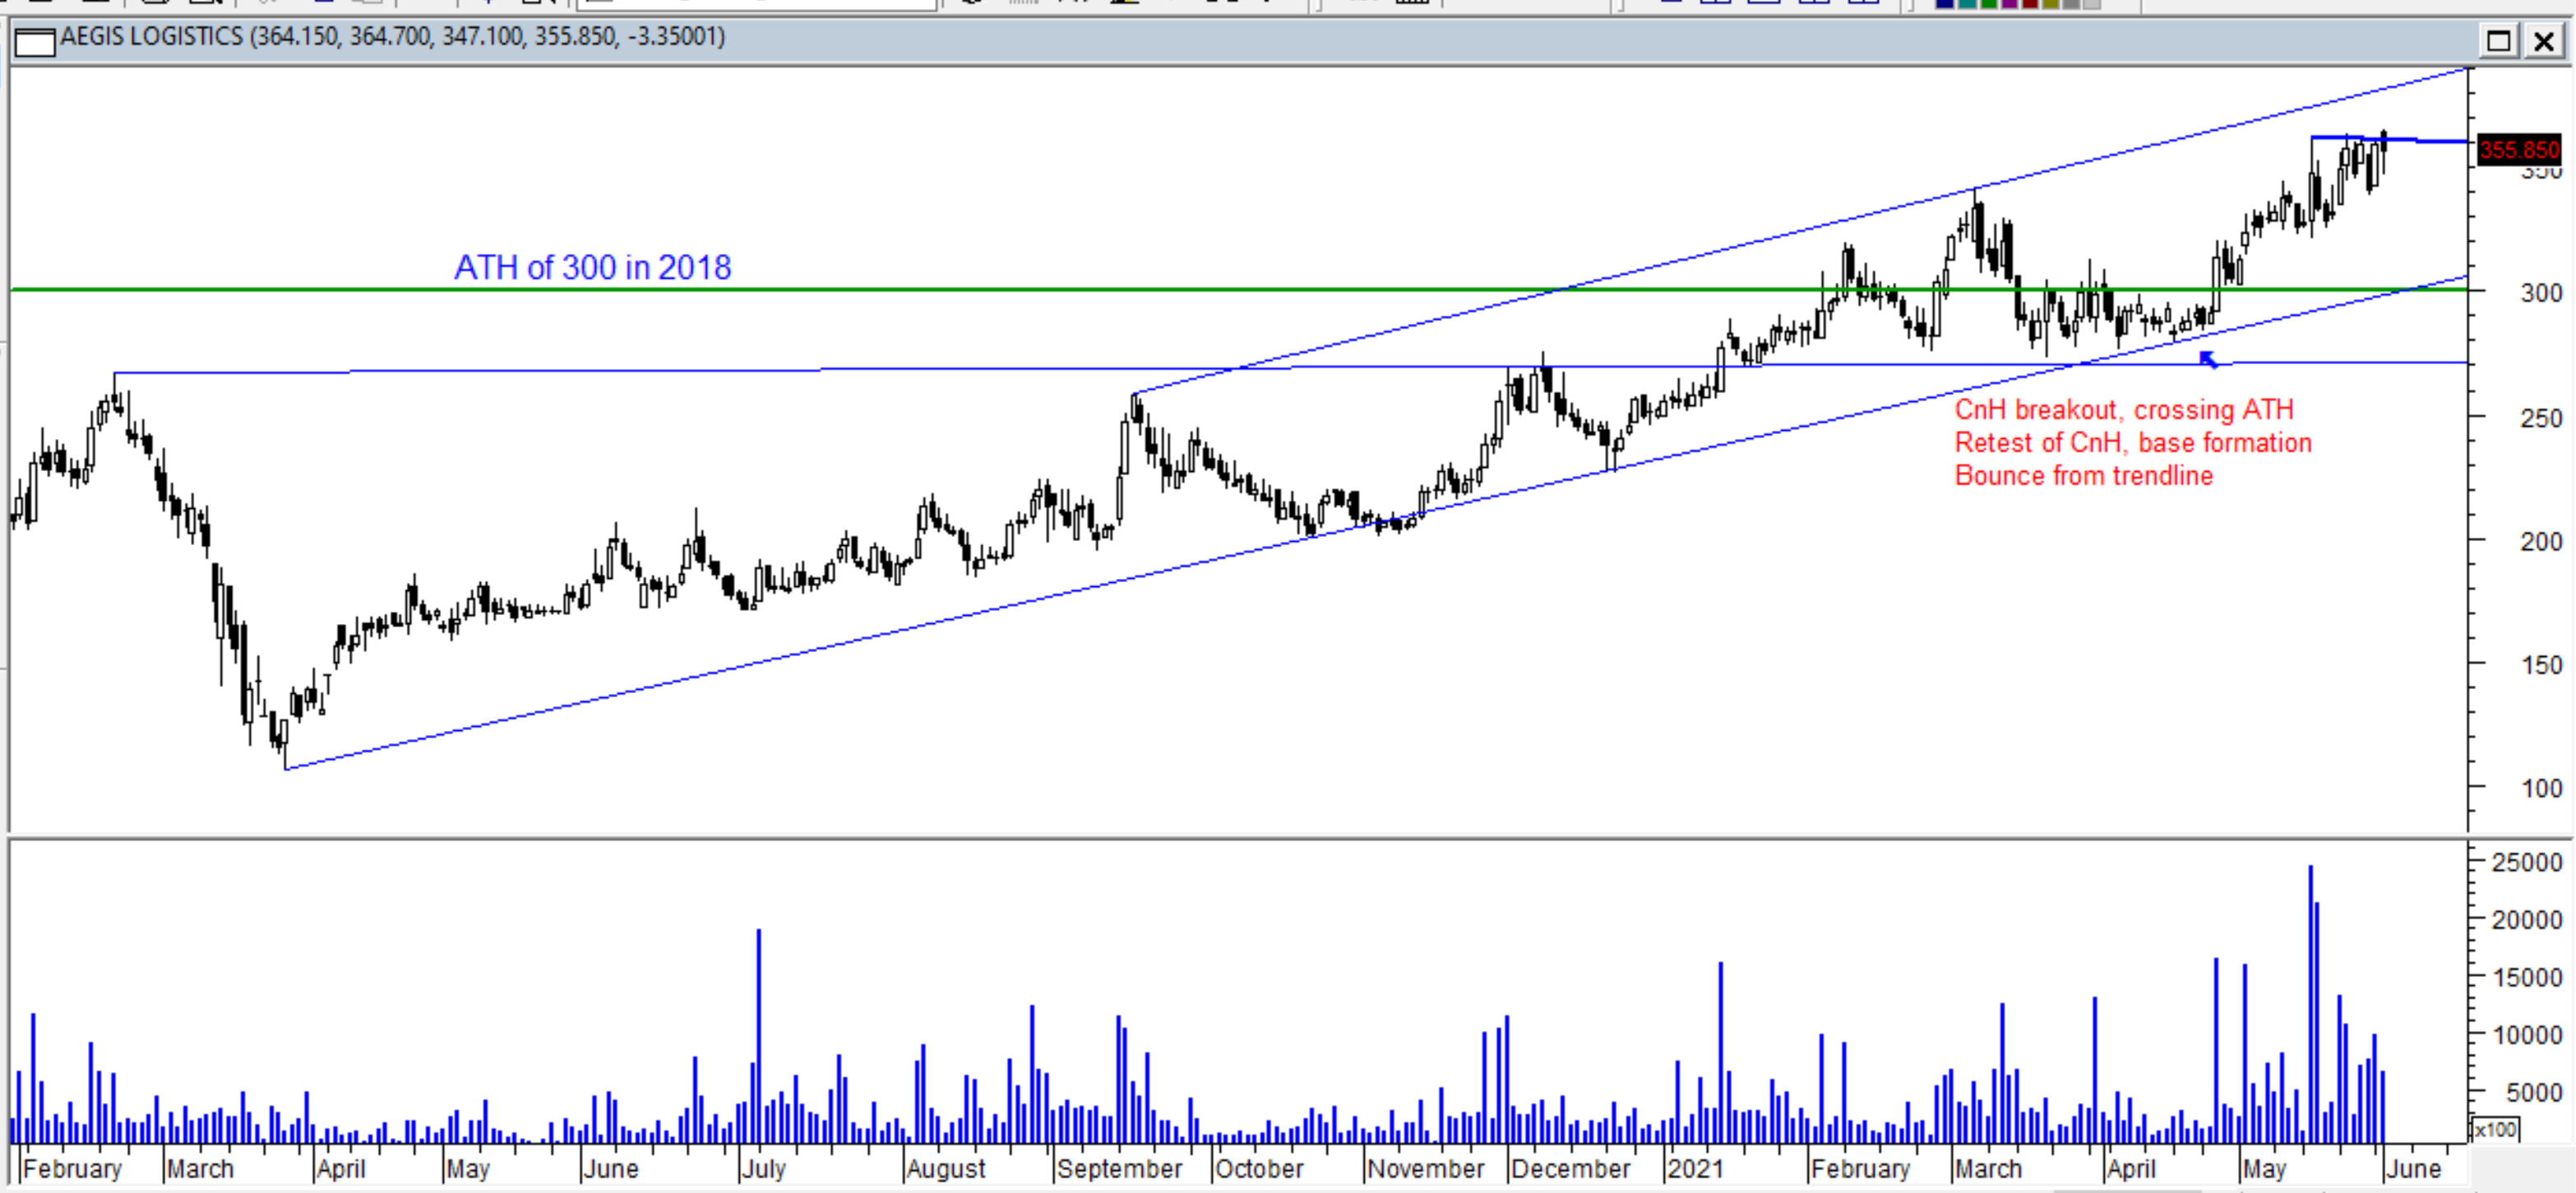
Here is a little longer perspective on Aegis
It gave a cup and handle breakout at 270 odd, crossed the previous all time high of 300.
Then it retested 270 levels and formed a good base, bounced from the trendline and resumed the upmove
7 Likes
Not good with targets etc., and can’t say by when, might sound bit outlandish but looking at the pattern maybe 500+. If biz wise does well then maybe more in next 2-3 yrs.
Has just done a golden cross today where 50 DMA has crossed 200 DMA with good volumes, so may have further momentum.
Maybe somebody more proficient in technical analysis can confirm and reply.
Discl: Have bought multiple times in last 1 month. It was more of a fundamental find but then saw the charts which looked good as well.
1 Like
HI
I want to start learning Technical Analysis. Can you all pls guide me whats the best way to start. Recommendation on Books for Beginners, Web resources, videos would help. Which are the best websites for getting technical charts. thanks
I also agree with you…
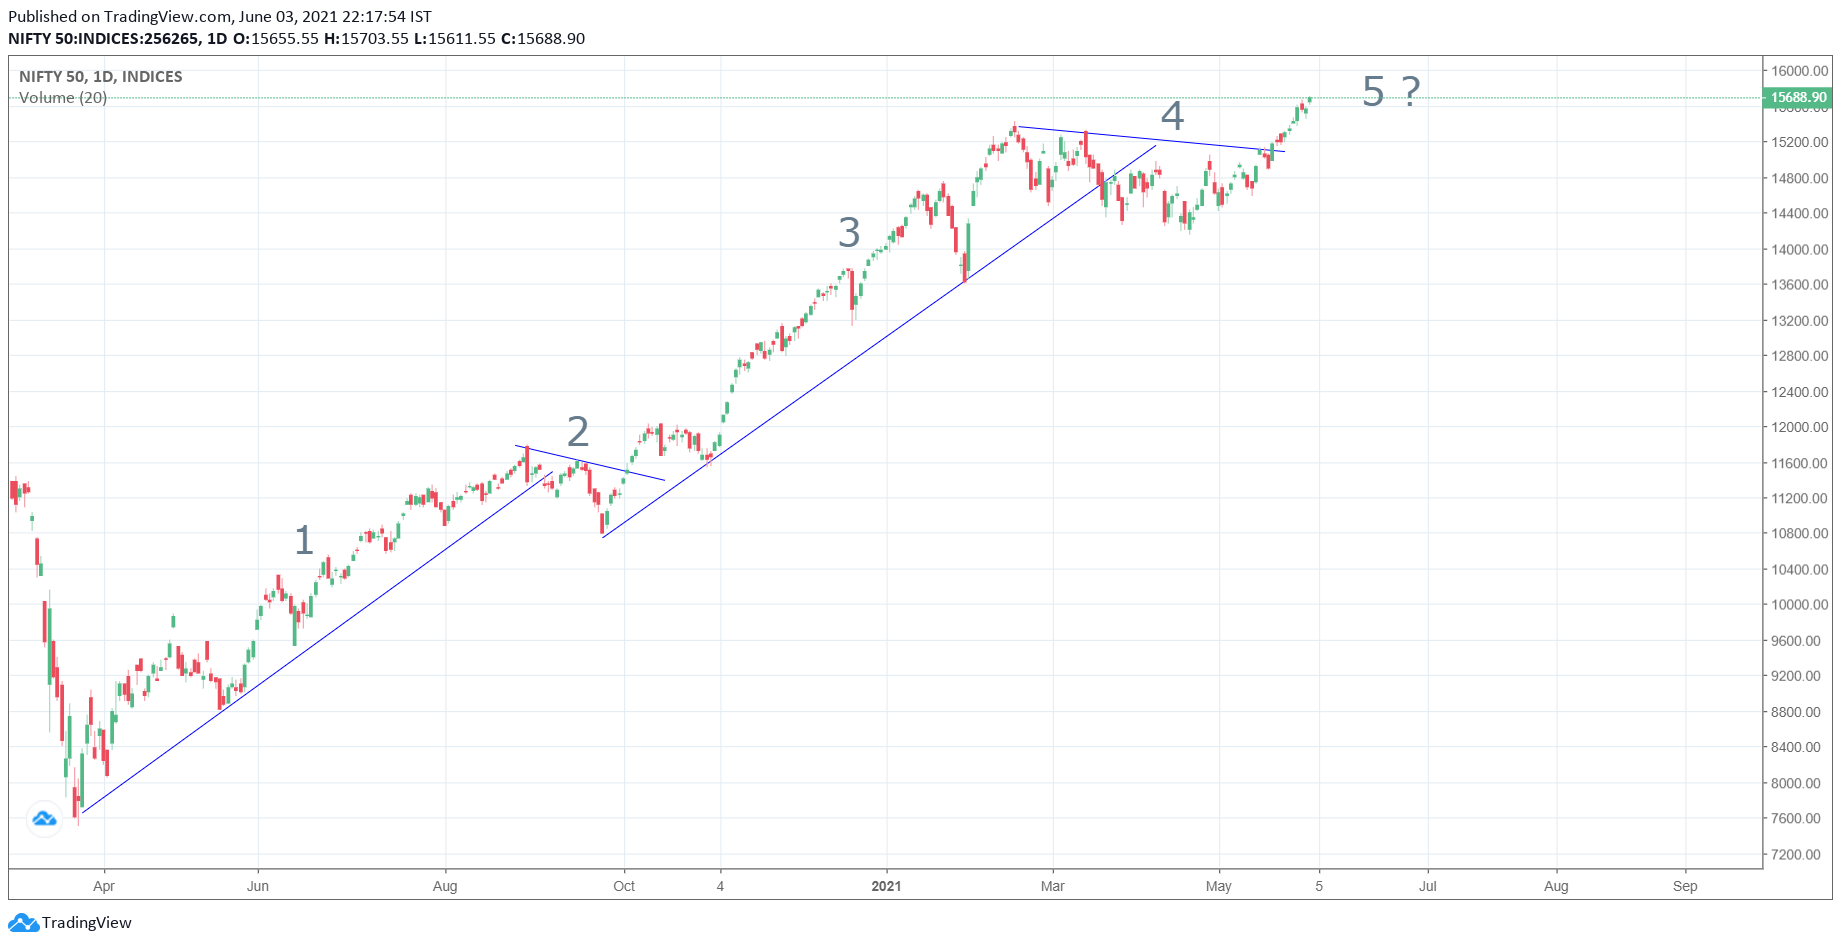
How long is the 5th wave or what is the target?
After that we will come down in A-B-C pattern?
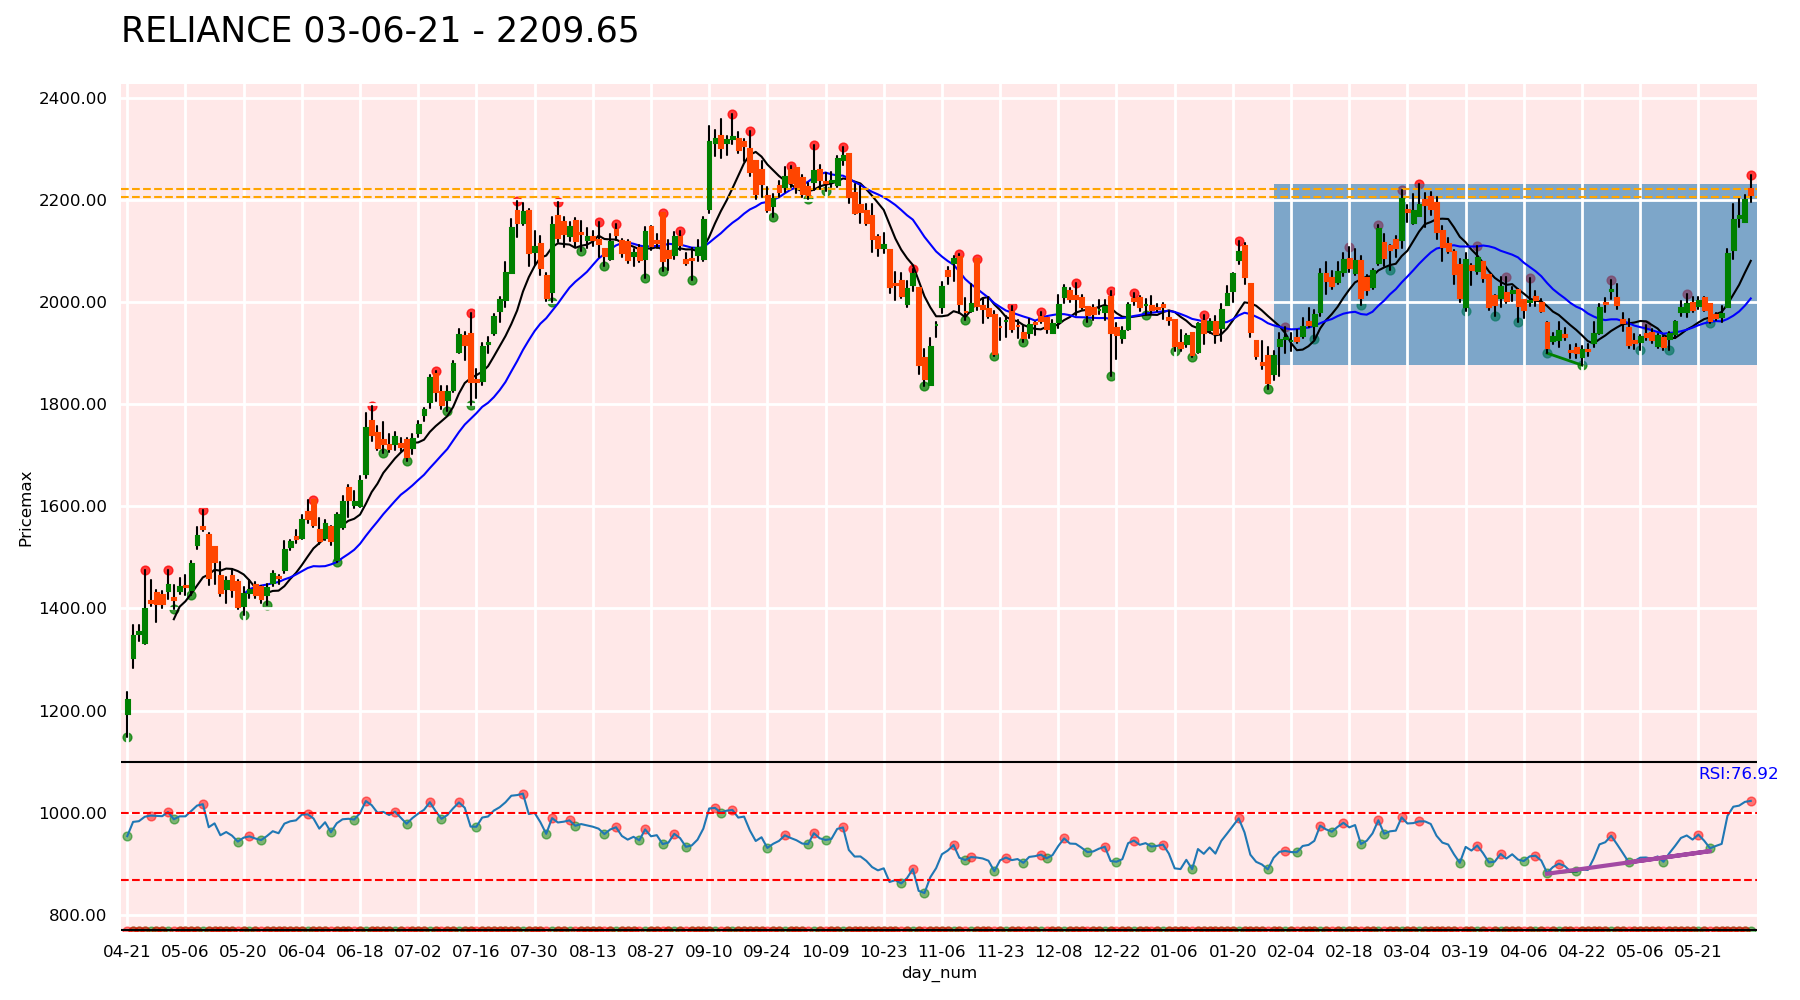
Reliance is breaking out… if done it can goto ATH… the OpenInterest data also suggest that strong builtup and there could be news coming in near term which obviously could be positive … that is what data is suggestion
1 Like
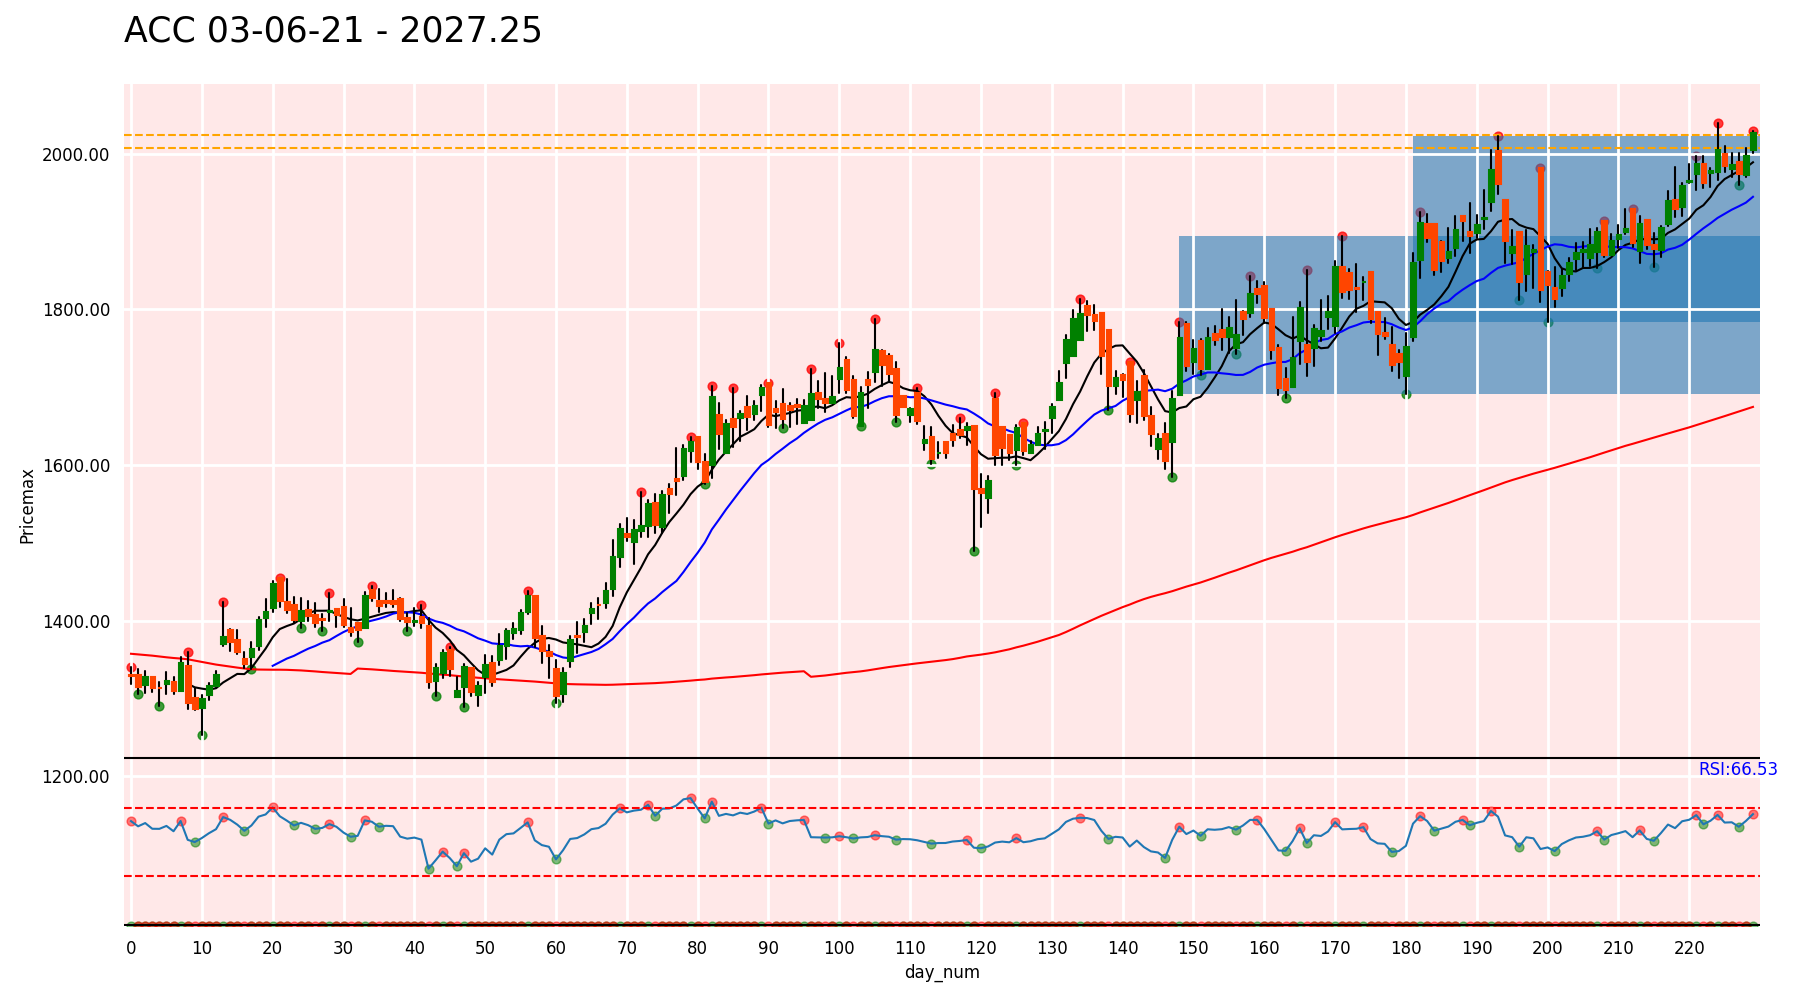
ACC is on verge of breakout
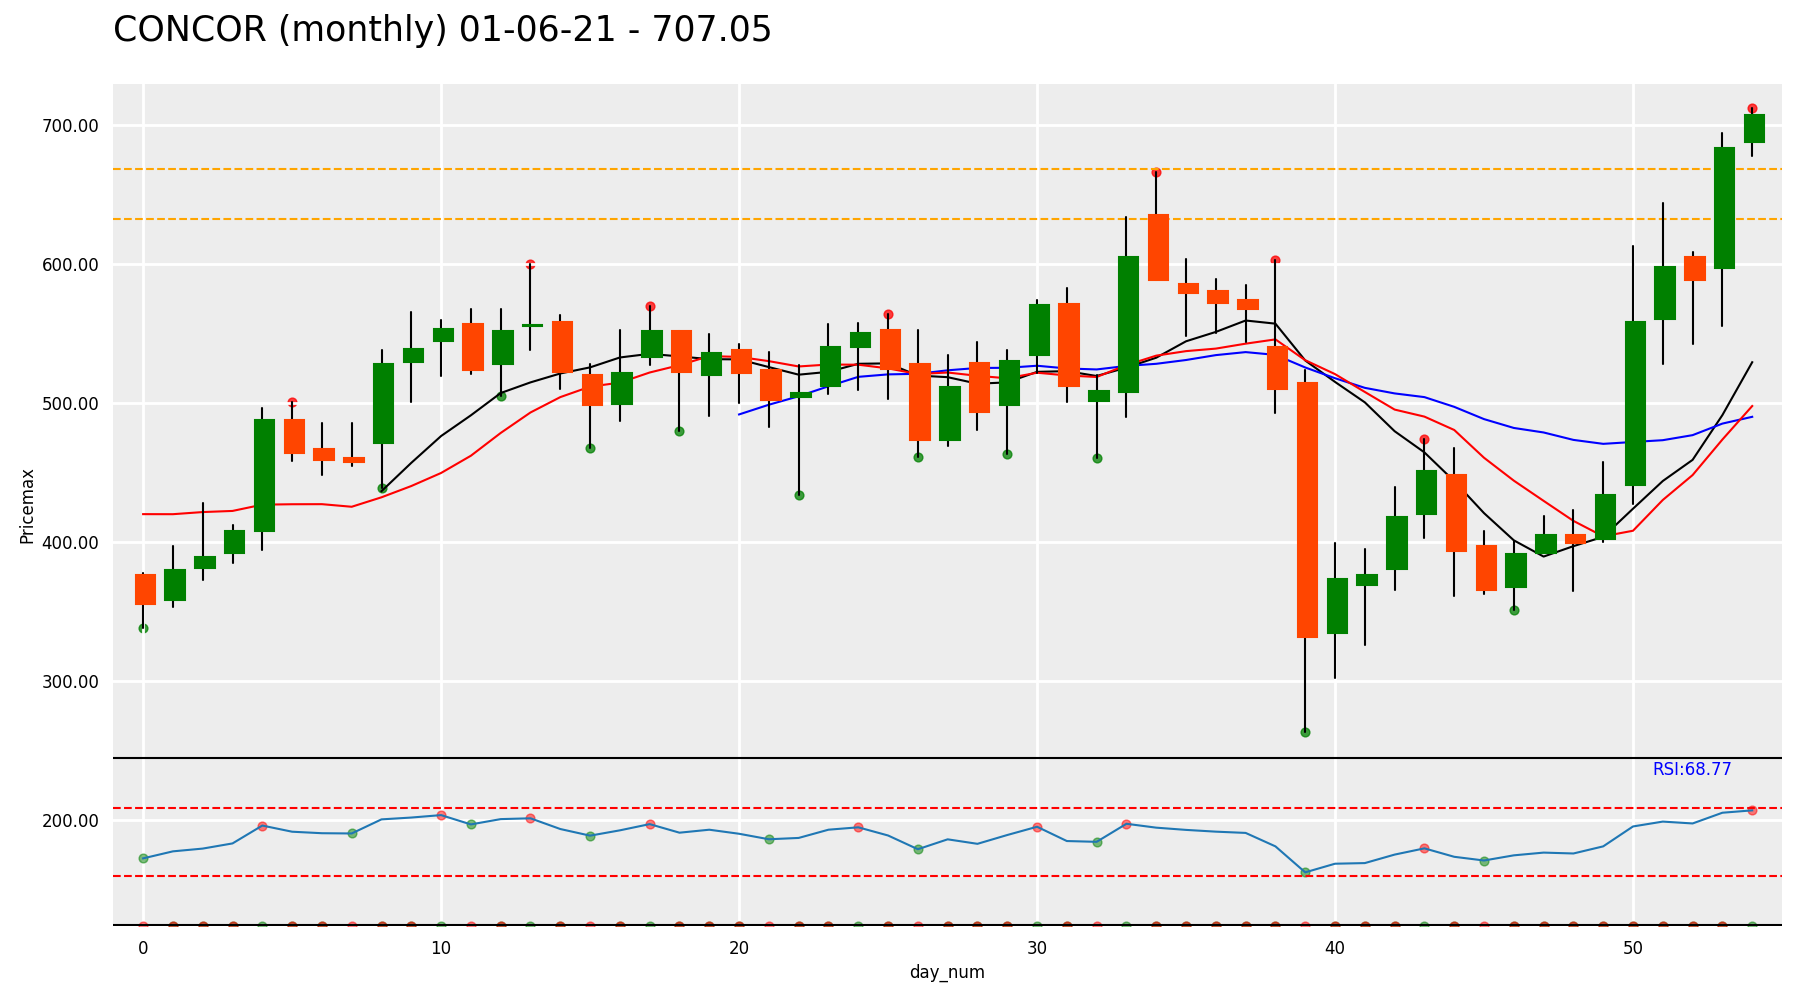
Concor breakout happened last month
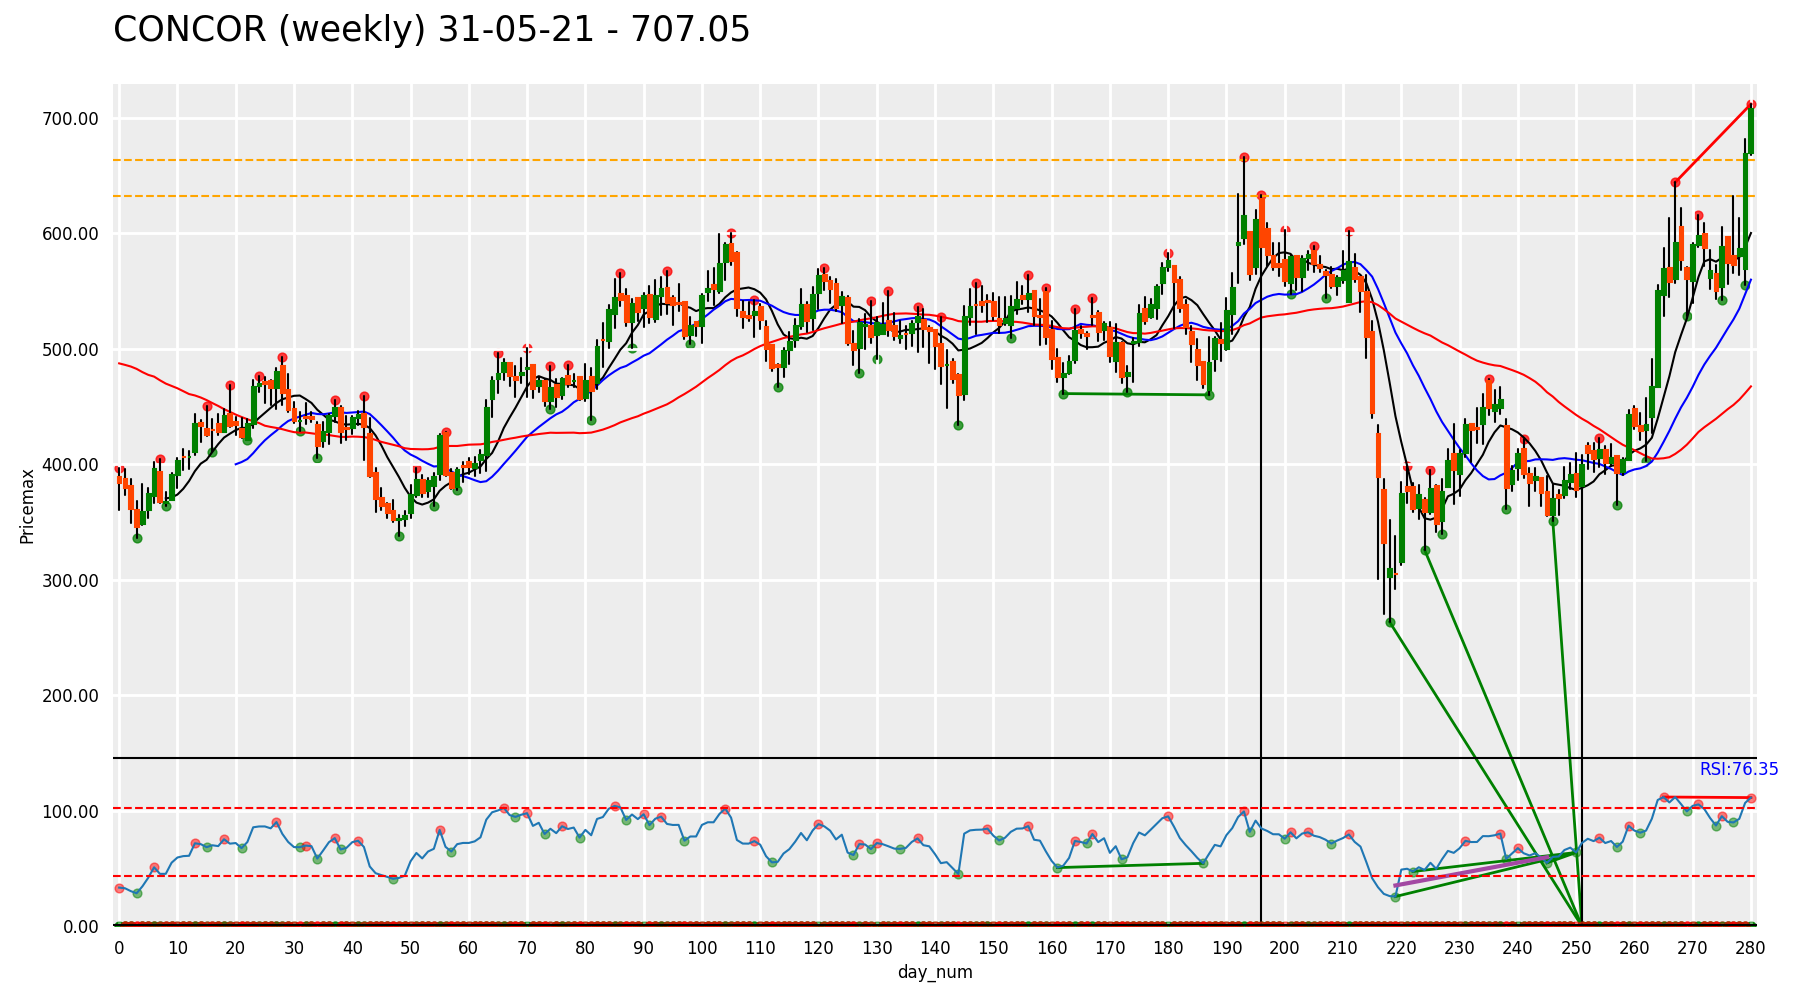
Weekly chart breakout is seen
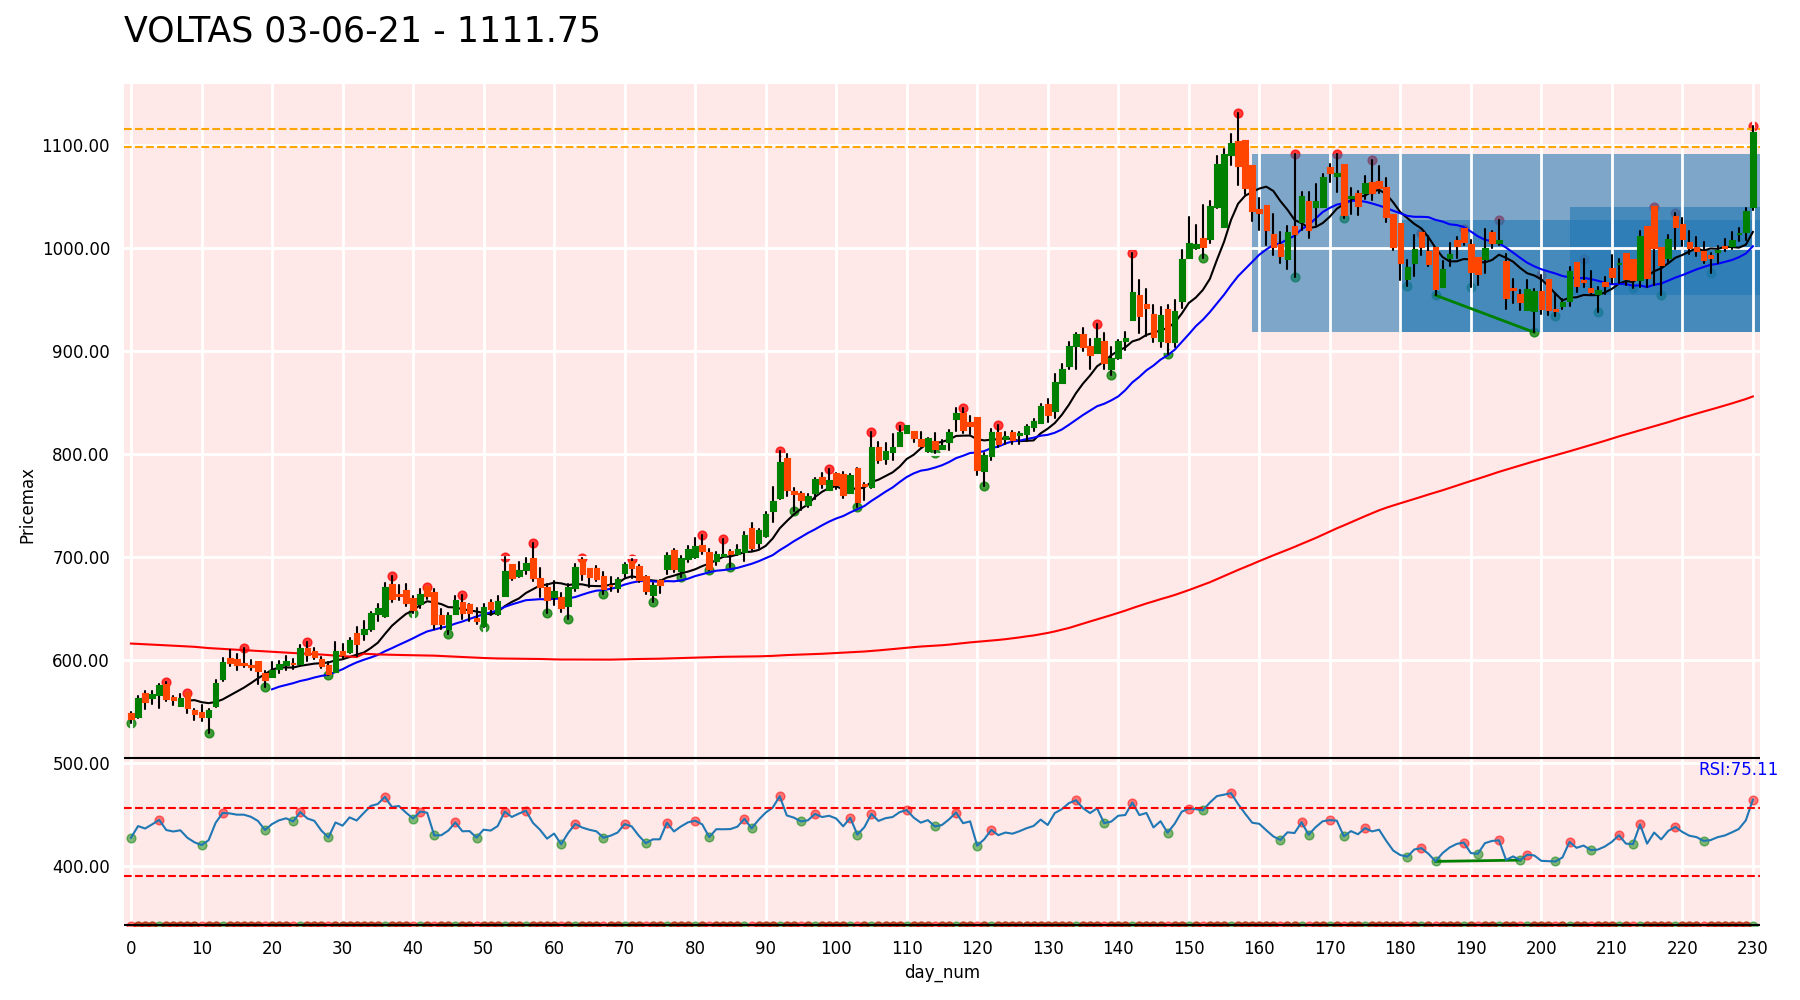
Voltas also near breakout
3 Likes
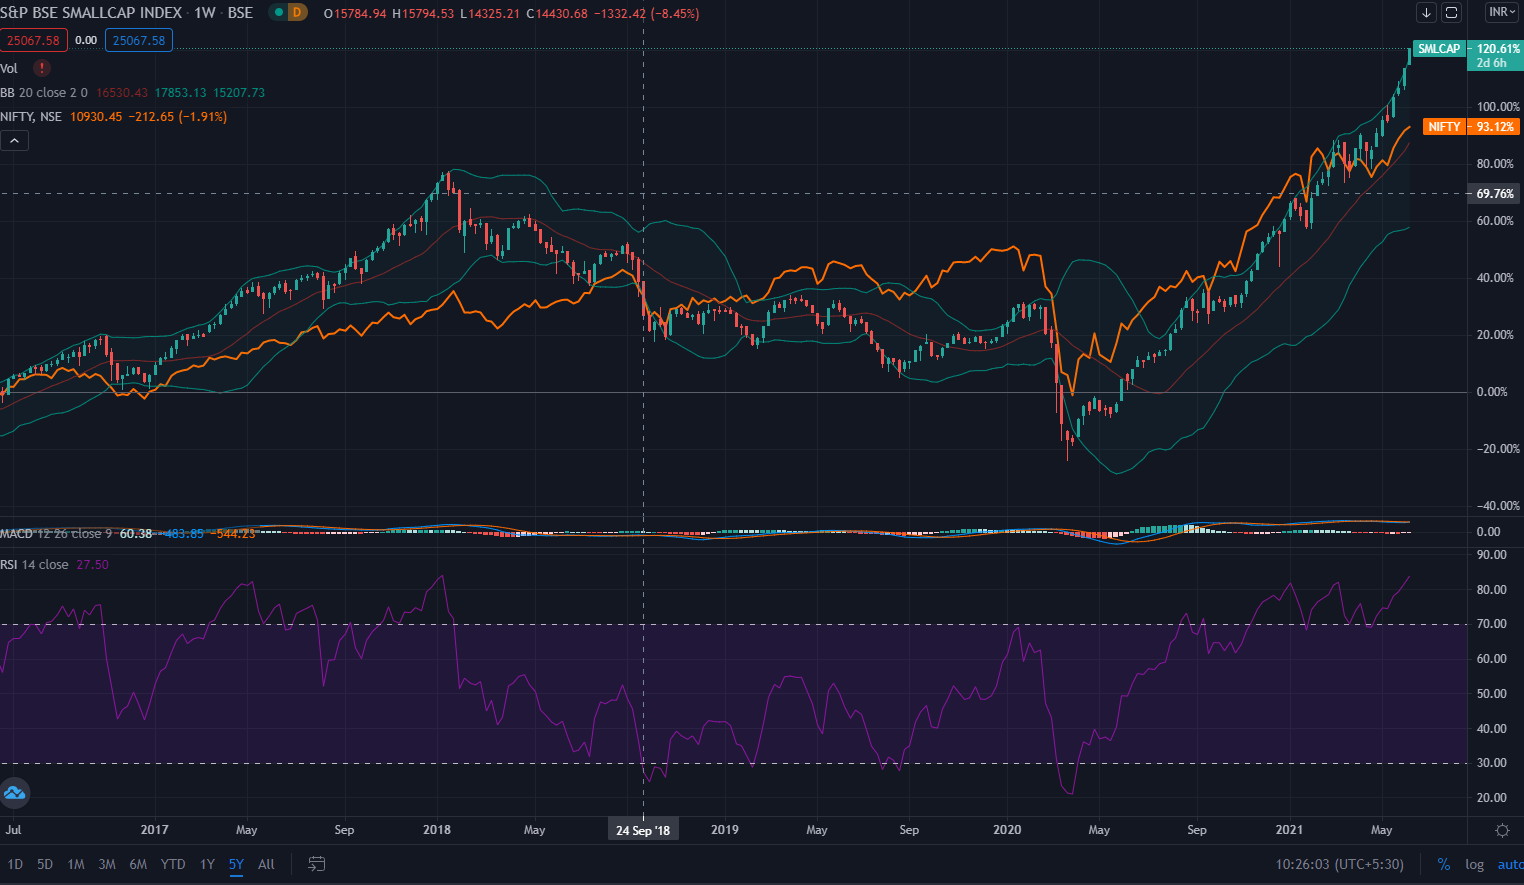
A simple 5 year comparison of the BSE- smallcap index vs NIFTY 50.
- The smallcap index outperformance peaked in Jan 2018 vs nifty.
- The underperformance continued till the onset of Covid-19 , where smallcap index fell even more than the NIFTY
- Mar 2020 - Apr 2021, played catch-up with NIFTY
- Apr-2021 - Present, outperformance by a large degree !
- RSI is in overbought levels (83 , similar to last peak in 2018)
- Well over the 200-DMA mark
My interpretation
- Nifty is to be closely watched if it catches up or if it the other way around !
[Discl : My current portfolio is smallcap heavy ]
Regards,
Abhijit.
6 Likes
Thirumalai Chemicals, Monthly - Broke out of that crucial 100 levels last month.
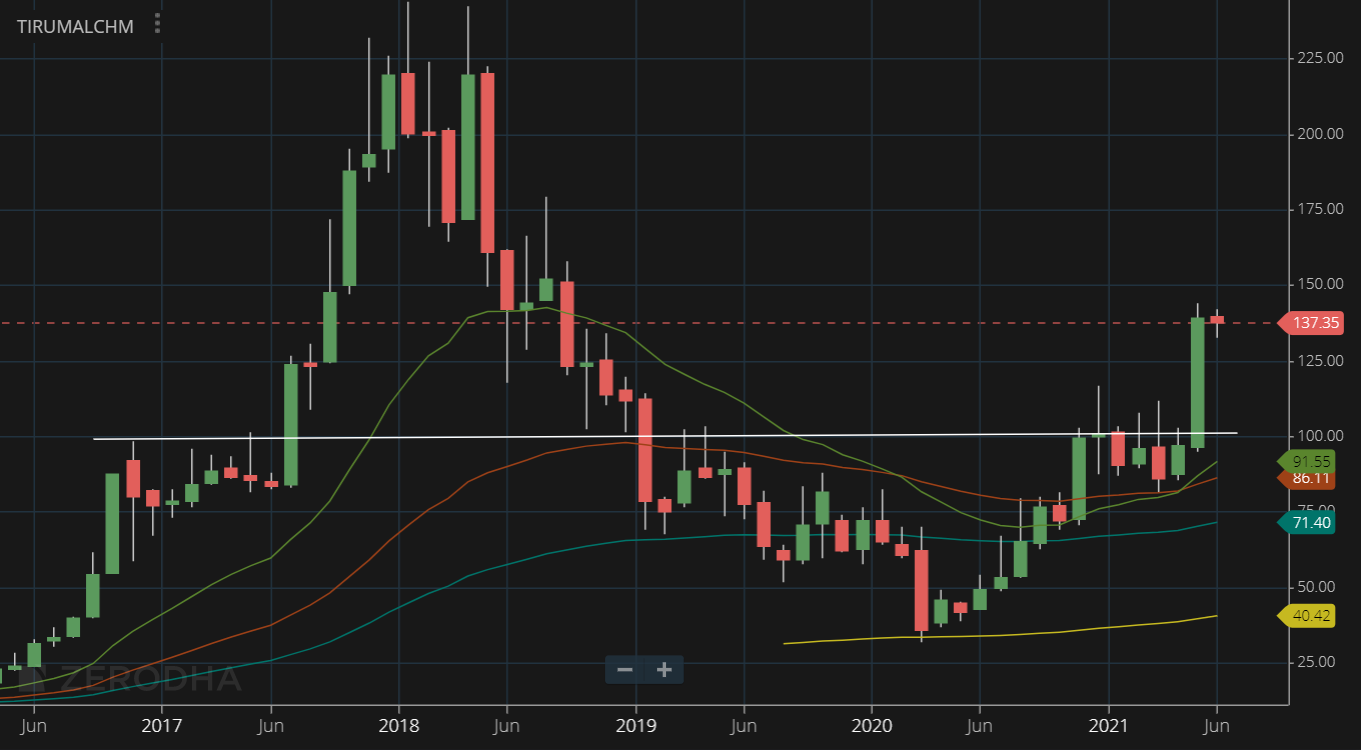
ADD has been imposed on Phthalic Anhydride going by this notification.
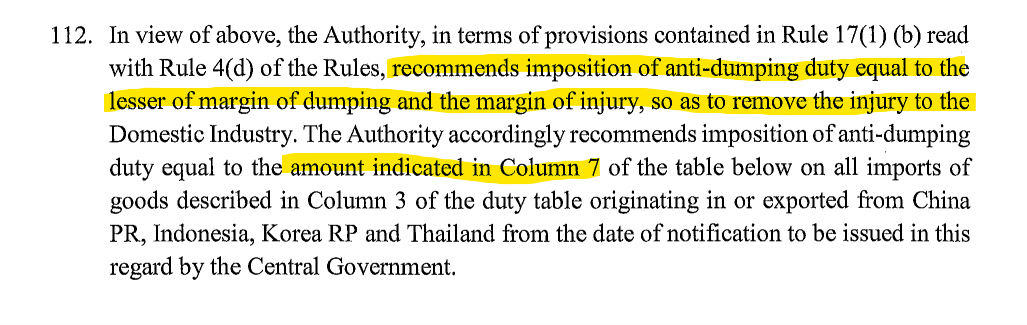
The ADD duty table is in page 45 and 46 in the doc above.
Fundamentally numbers have been very good in Q4, along with appreciation in PAN prices. These numbers could be sustainable along with the ADD, in which case current valuation could be cheap.
Disc: Had position in Tirumalai last year from August here around 60 levels but sold around 100 levels few months back. Things have changed from that position with the ADD going in favor of the company, so have decided to change stance and have started buying again.
13 Likes
Indiabulls Real Estate - Cup and handle formation in the offing. Target 145. Since I am a novice in technical analysis, can someone please validate this? Thanks!
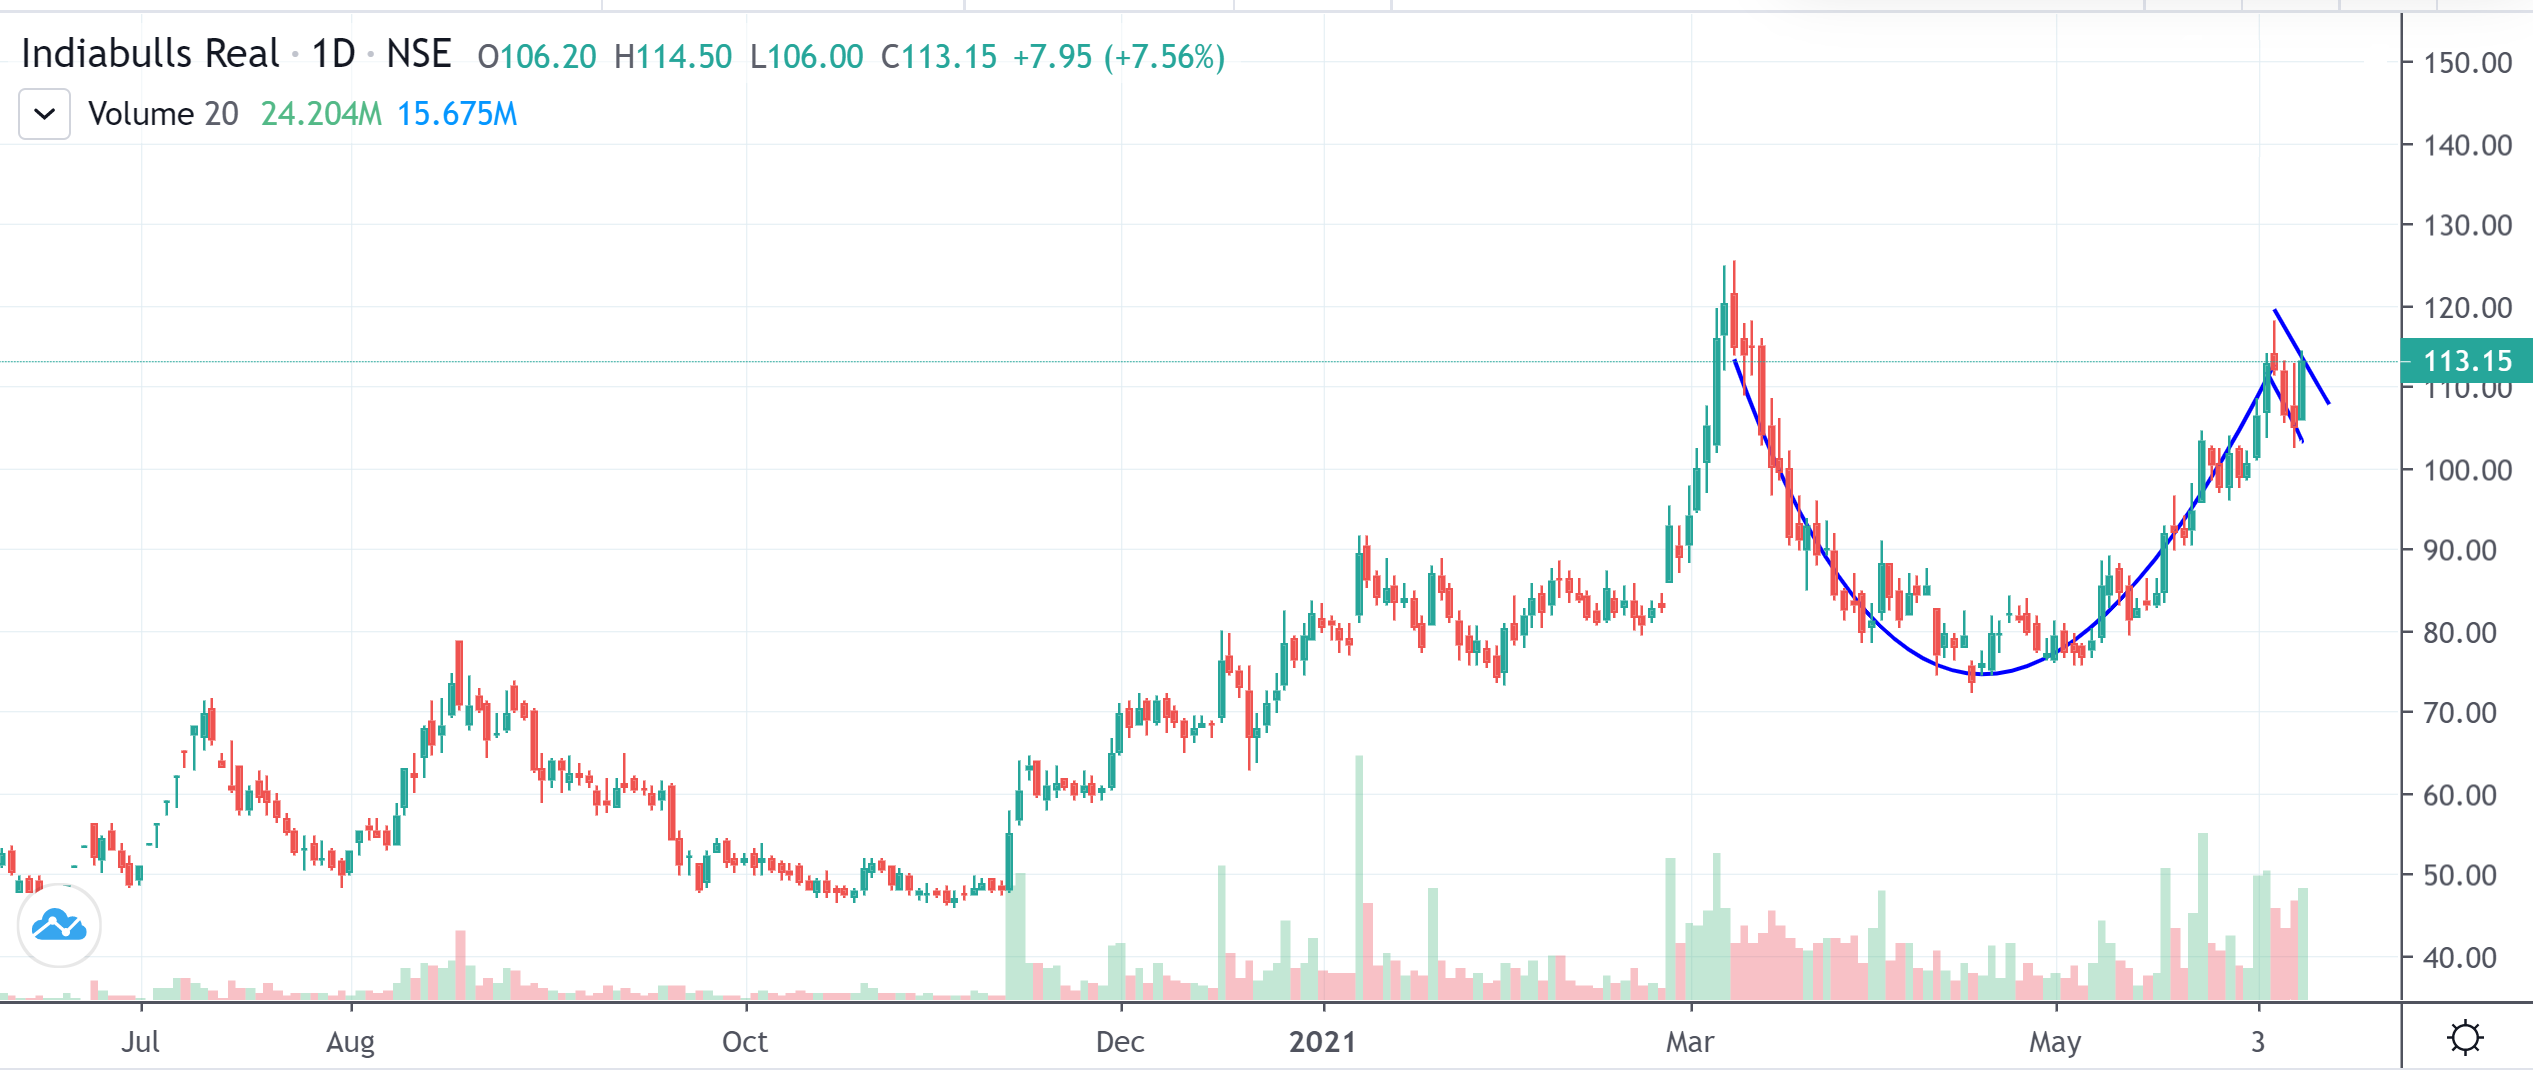
Disclosure: Invested and biased. Views are personal and not a buy/sell recommendation. Please do your own due diligence before investing.
4 Likes
This looks a pretty good C&H. 
2 Likes
THis your old chart , do you think now it is going to achive target ??
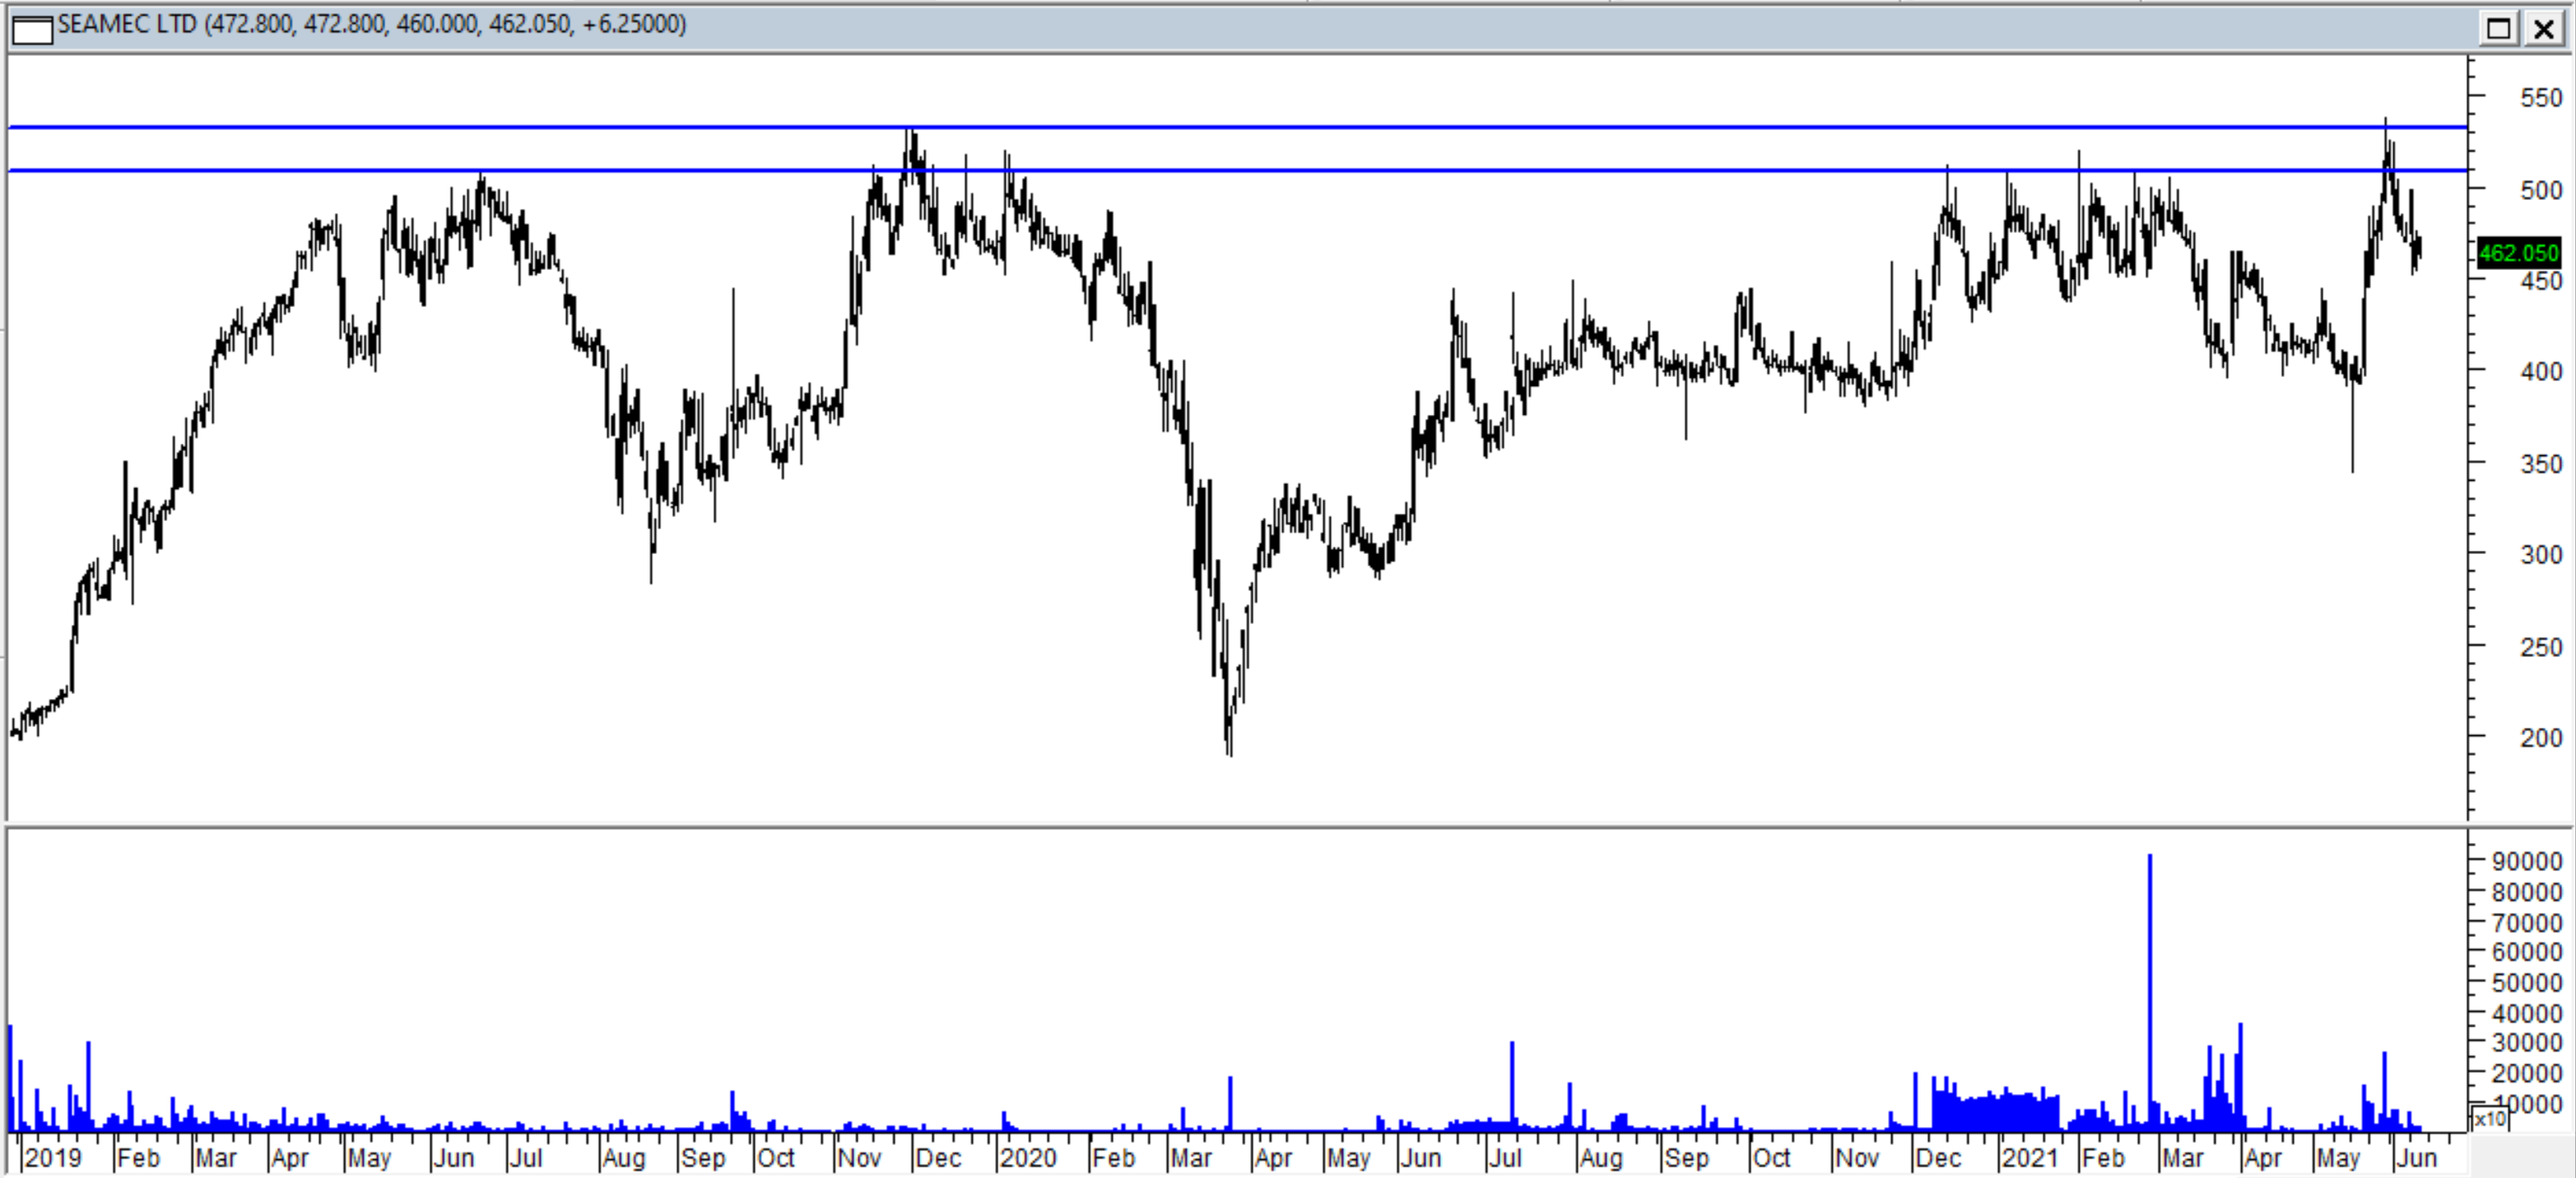
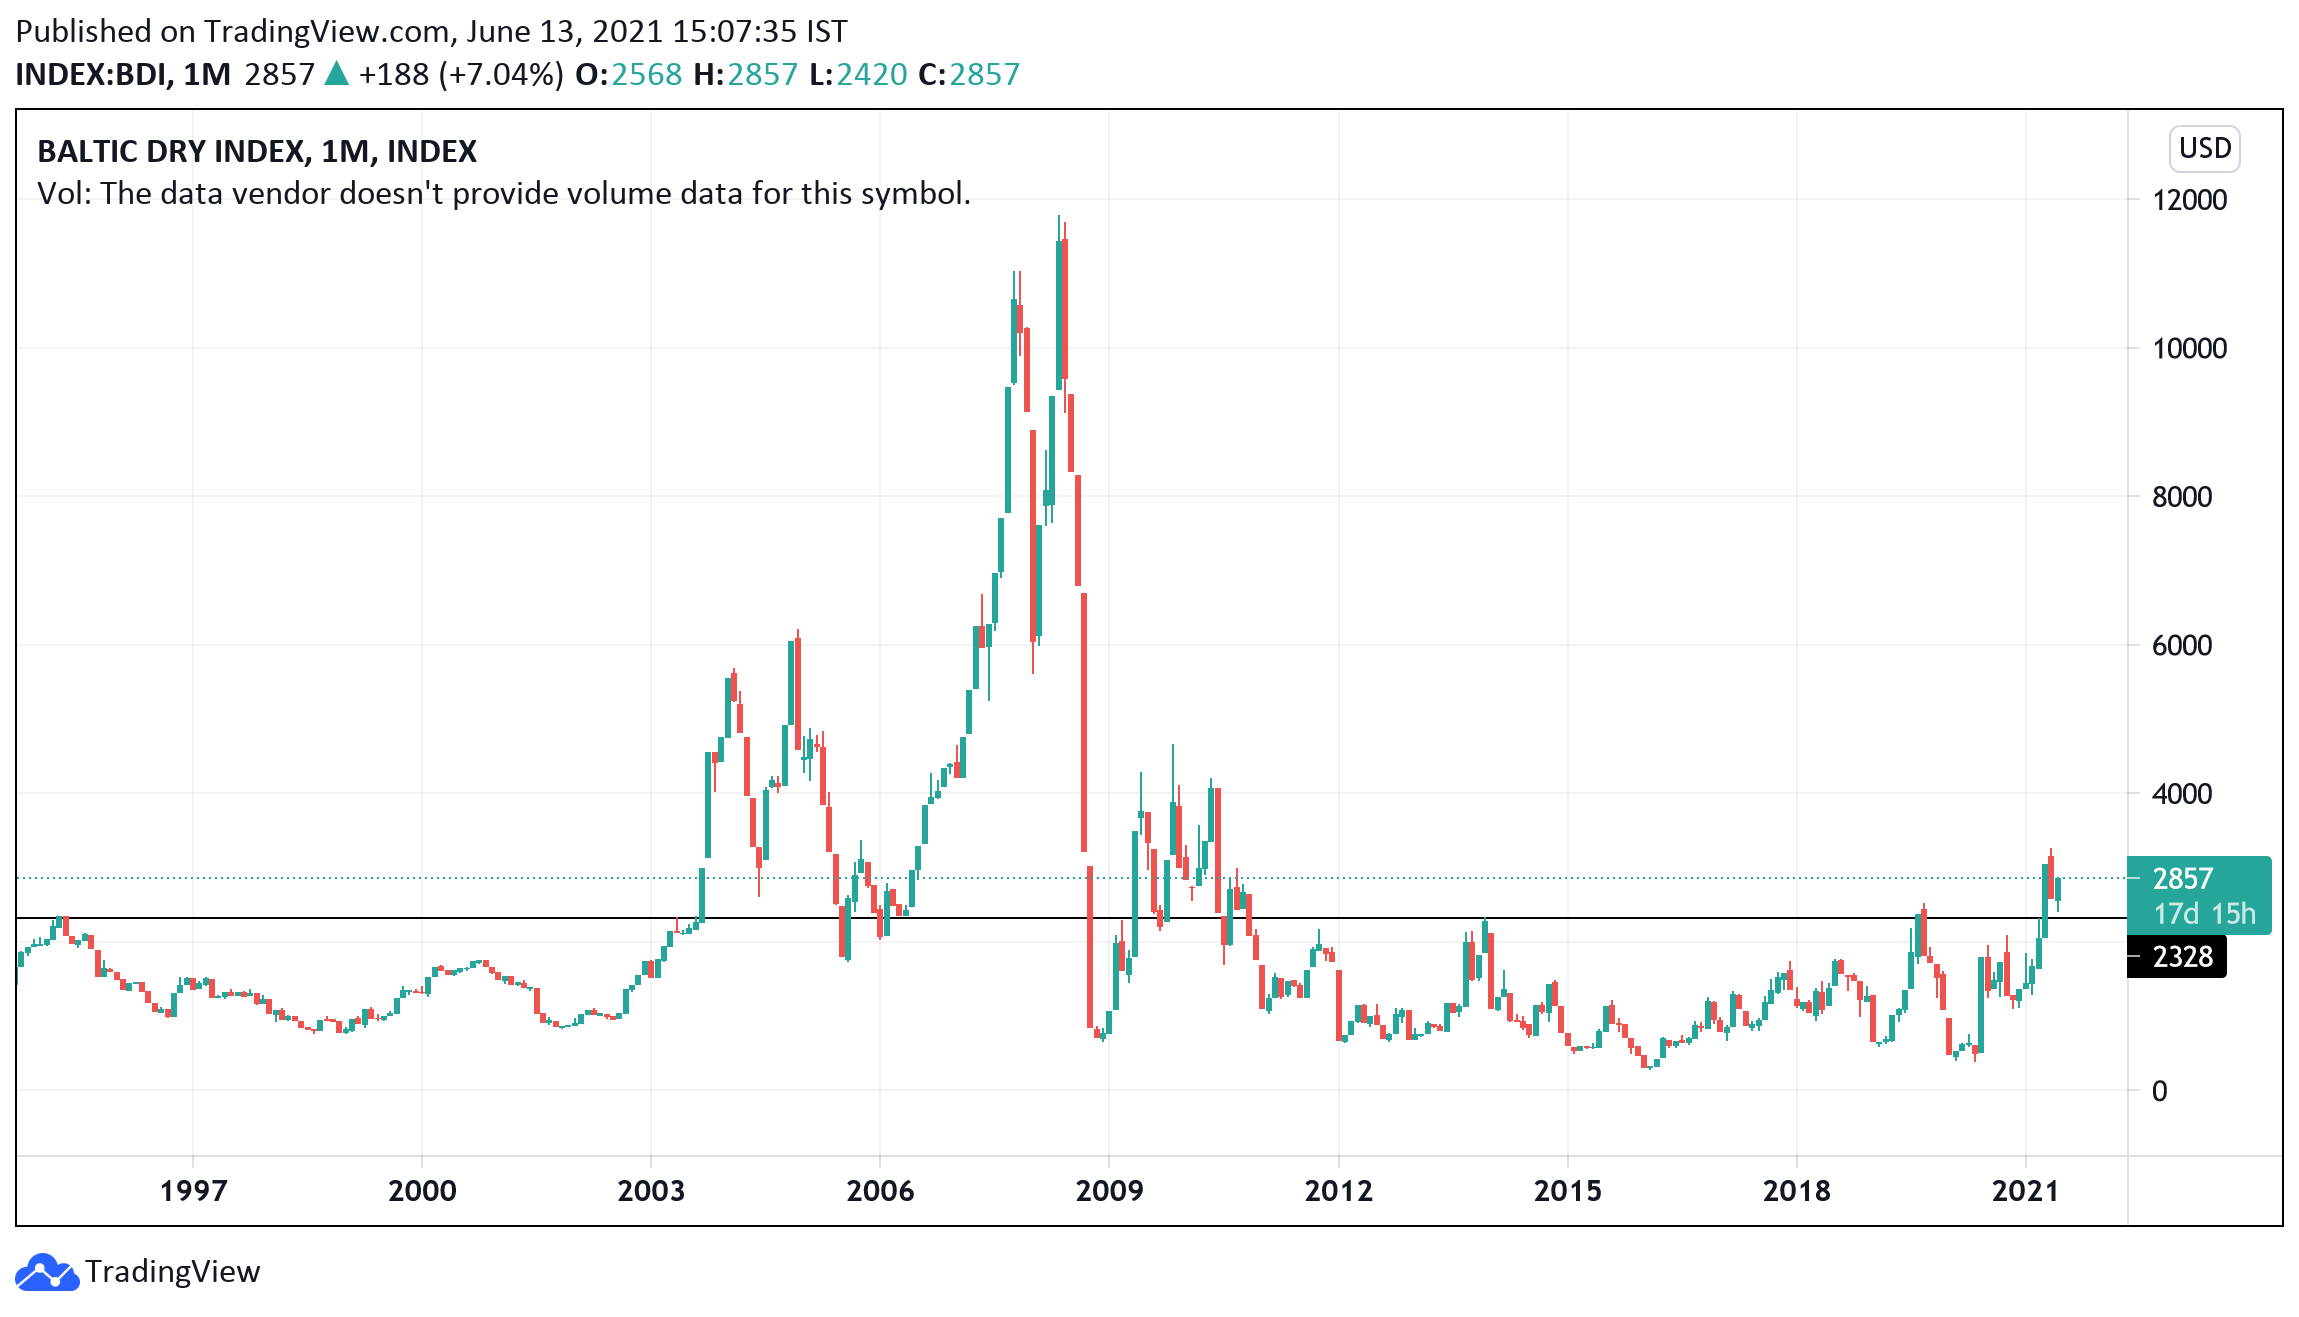
Shipping sector has been in news with shipping rates and Baltic dry index giving a huge move. Some interesting charts
Seamec near all time highs
Cochin Shipyard
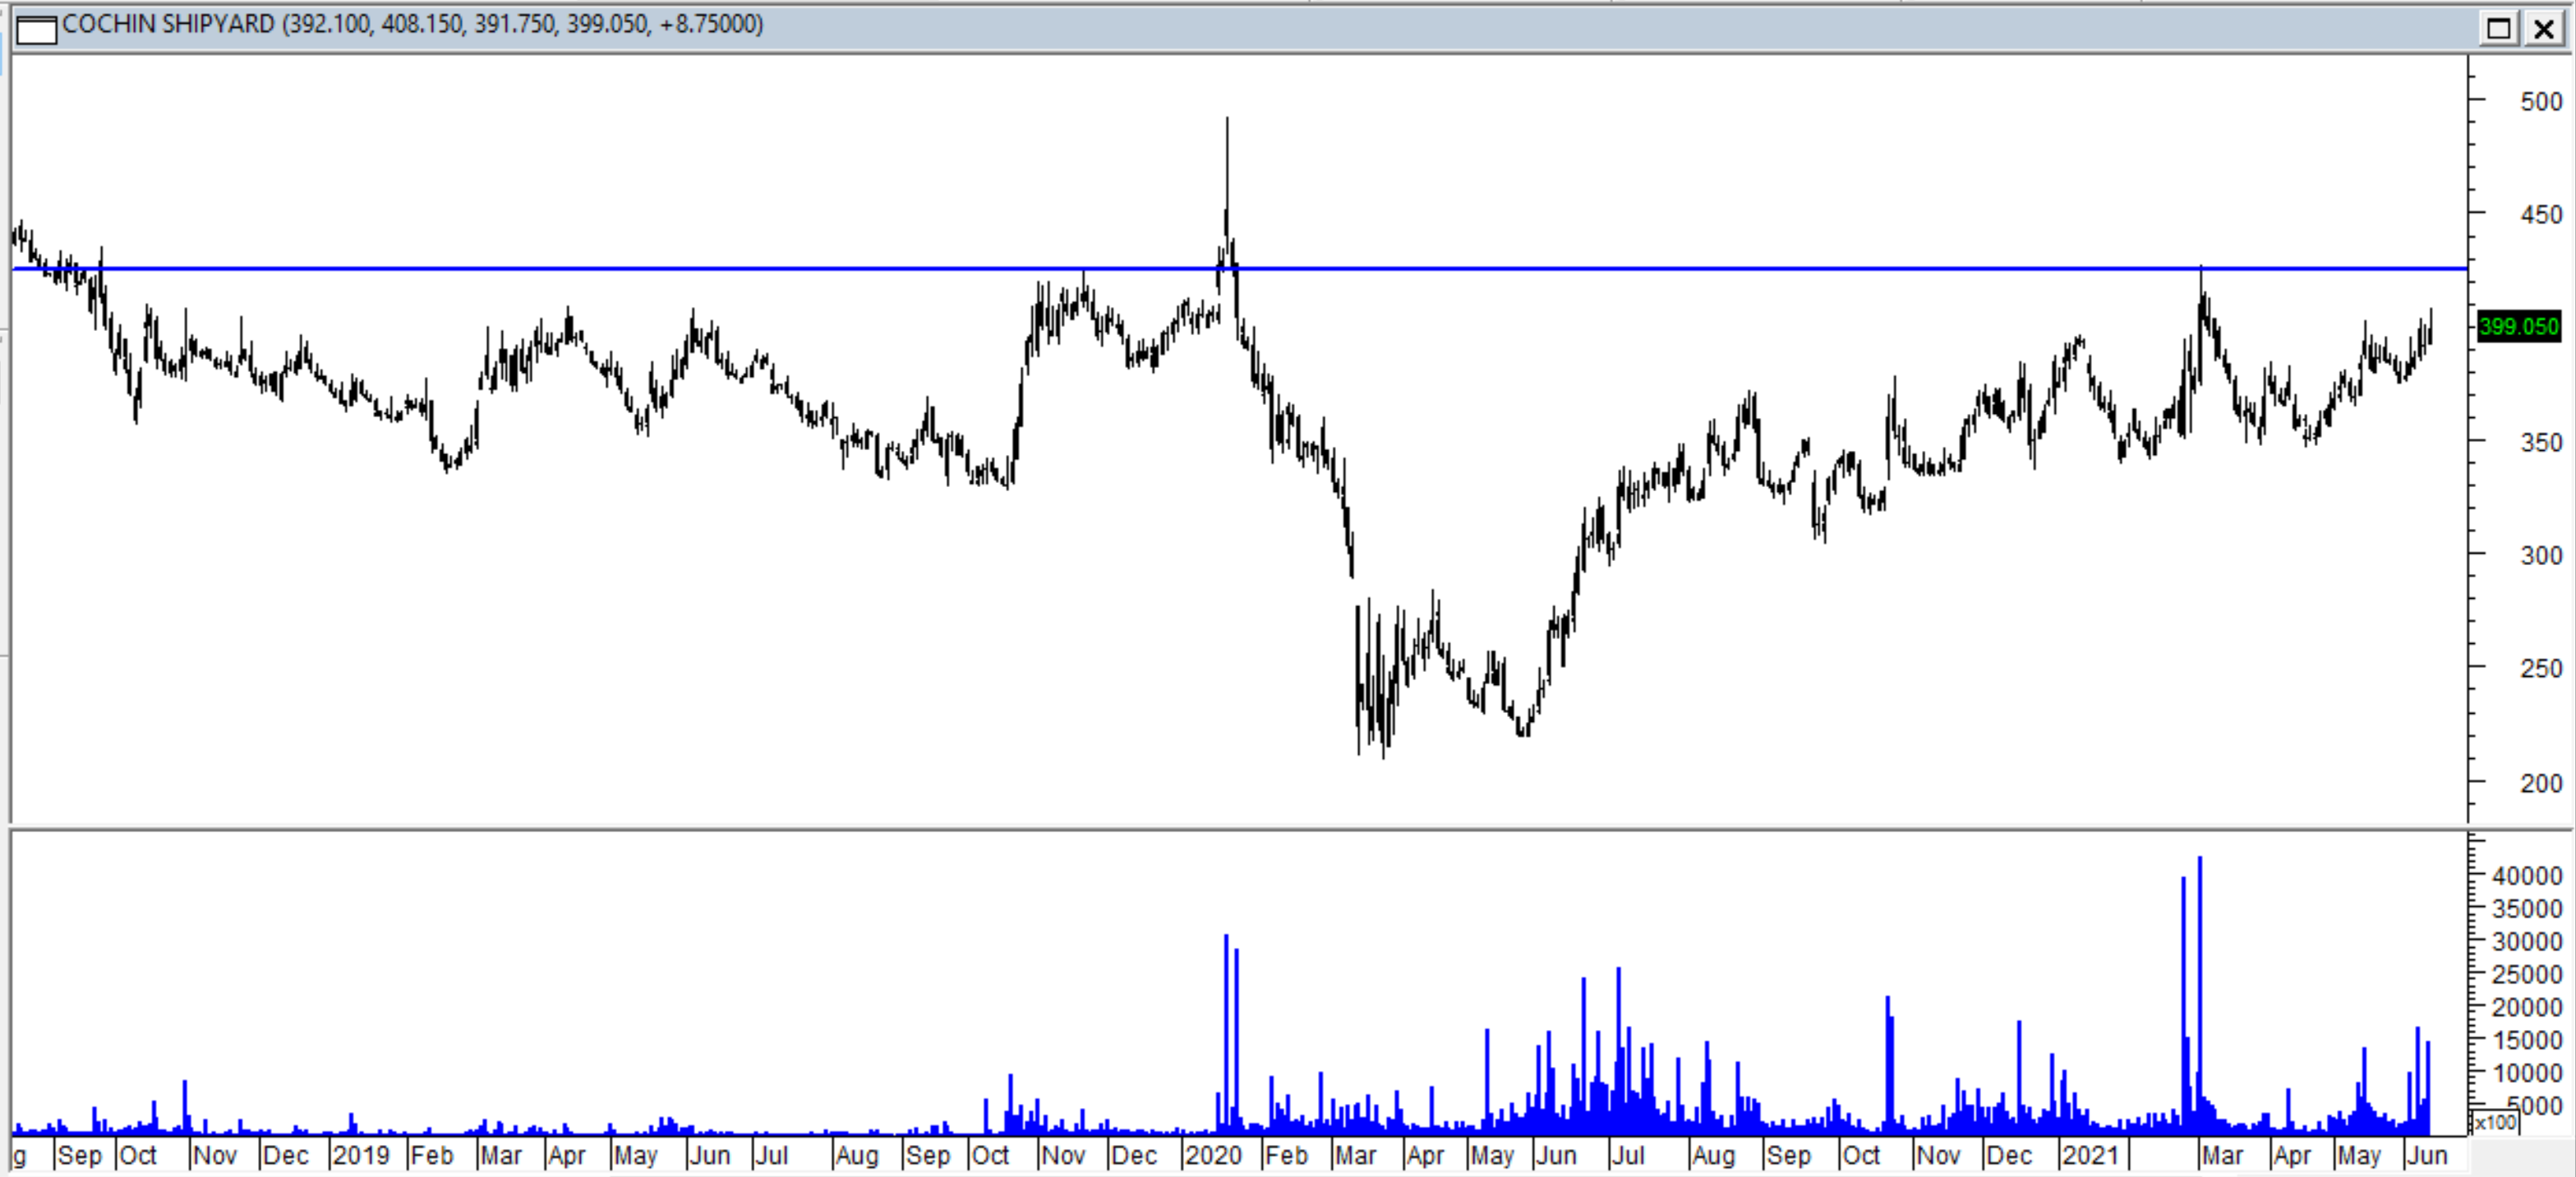
Gujarat Pipavav massive volumes
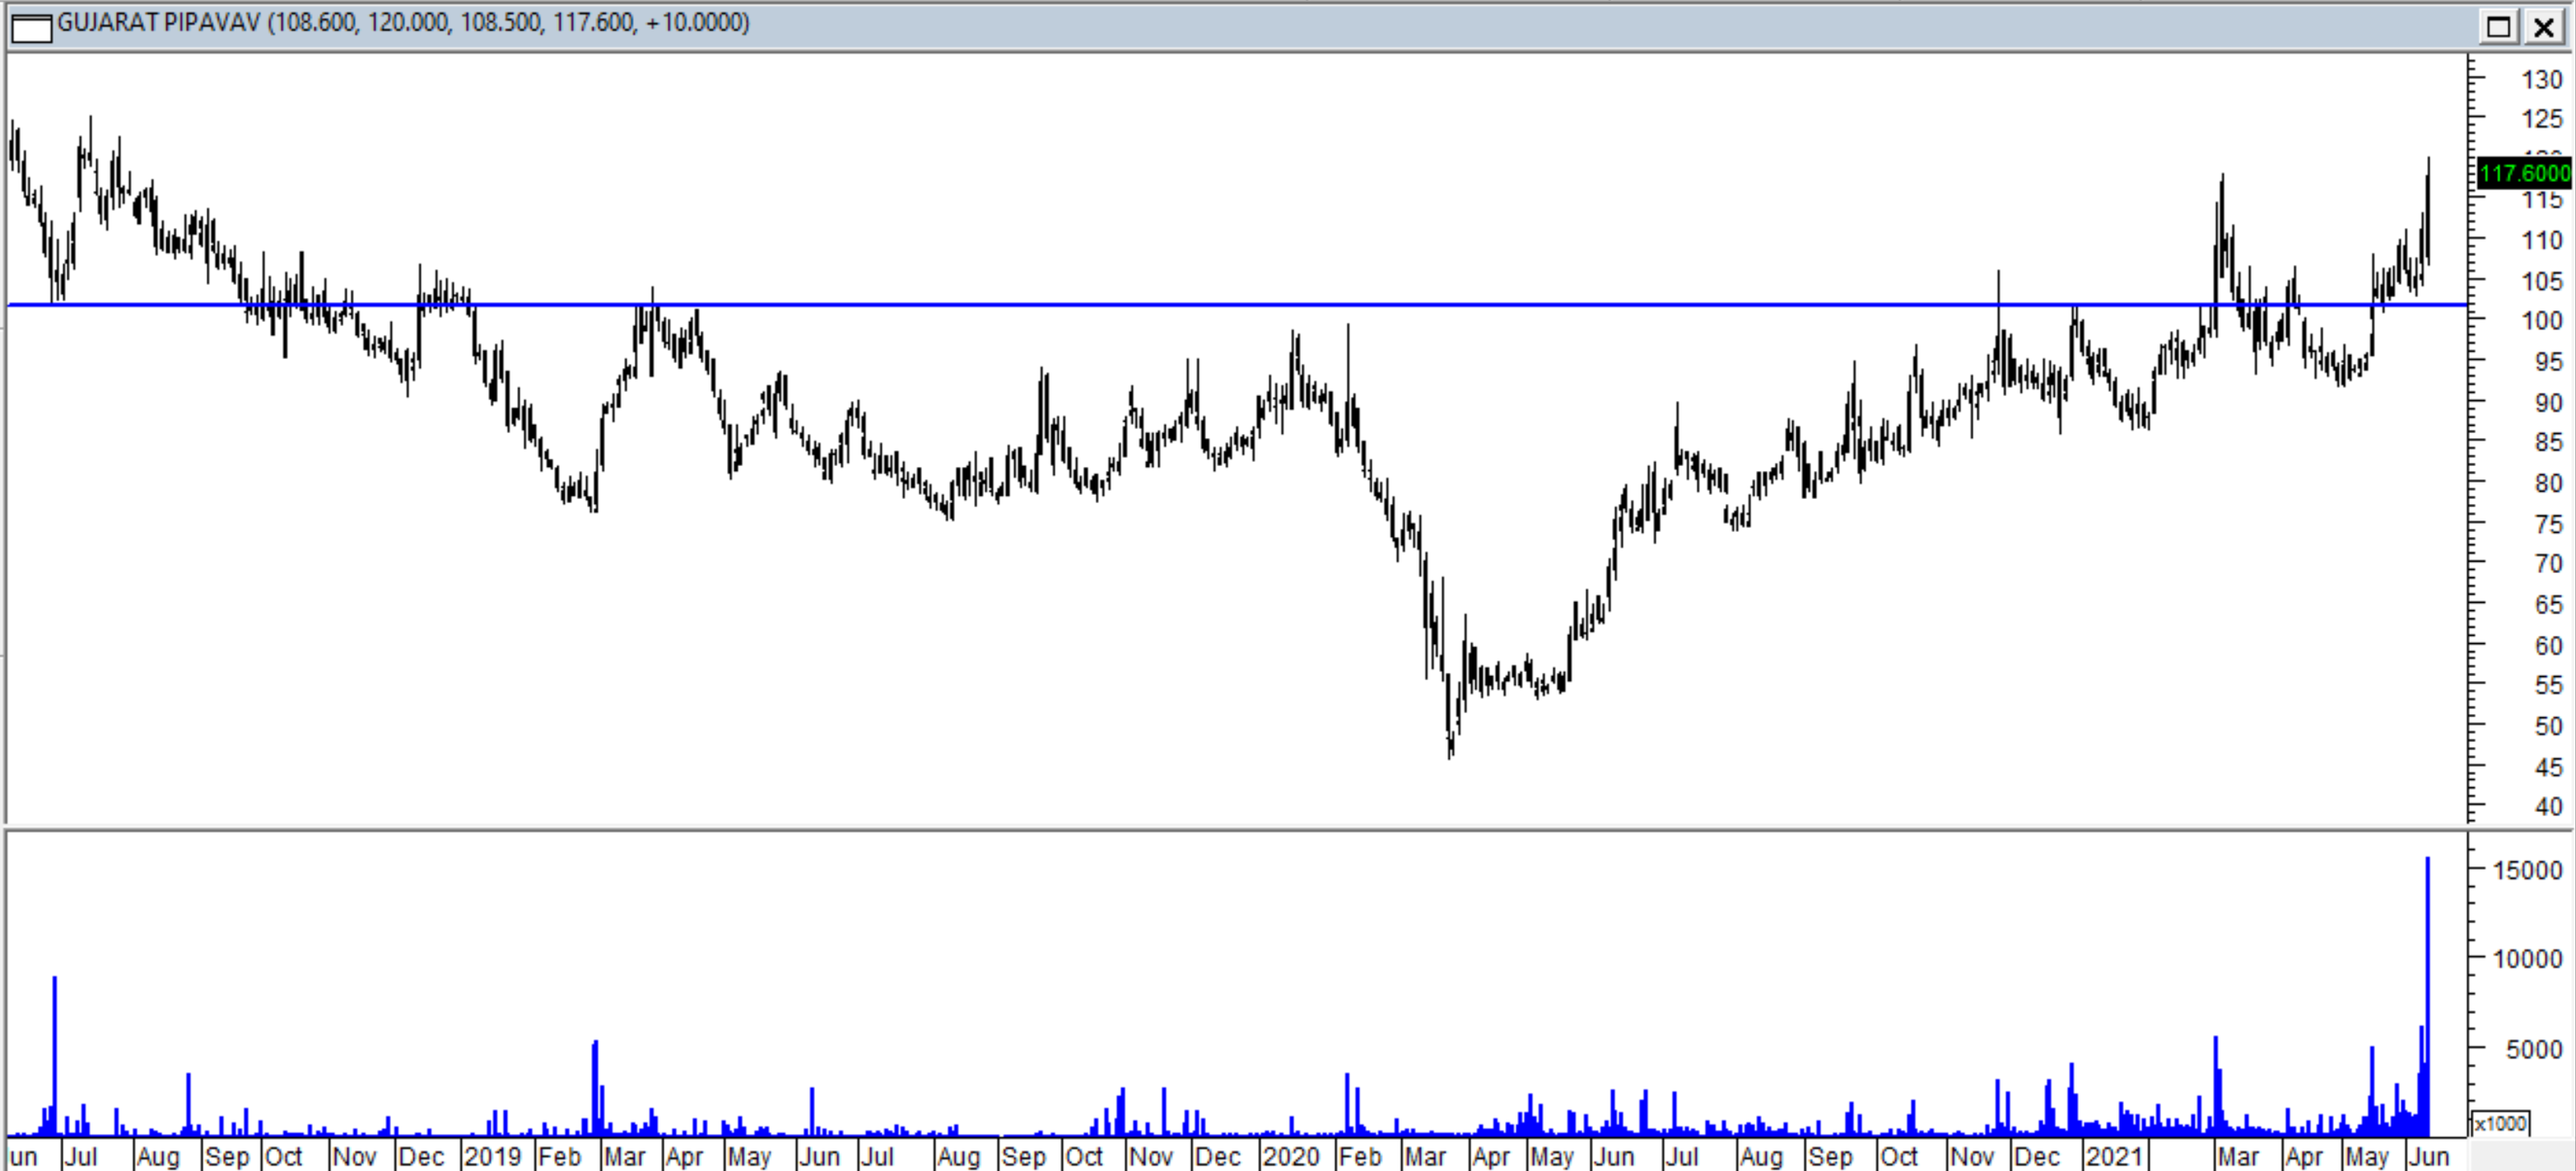
Essar Shipping

5 Likes
Most sectors now are near their highs. Whats the point of the above chart?
4 Likes
@alexander I will explain a few points for you.
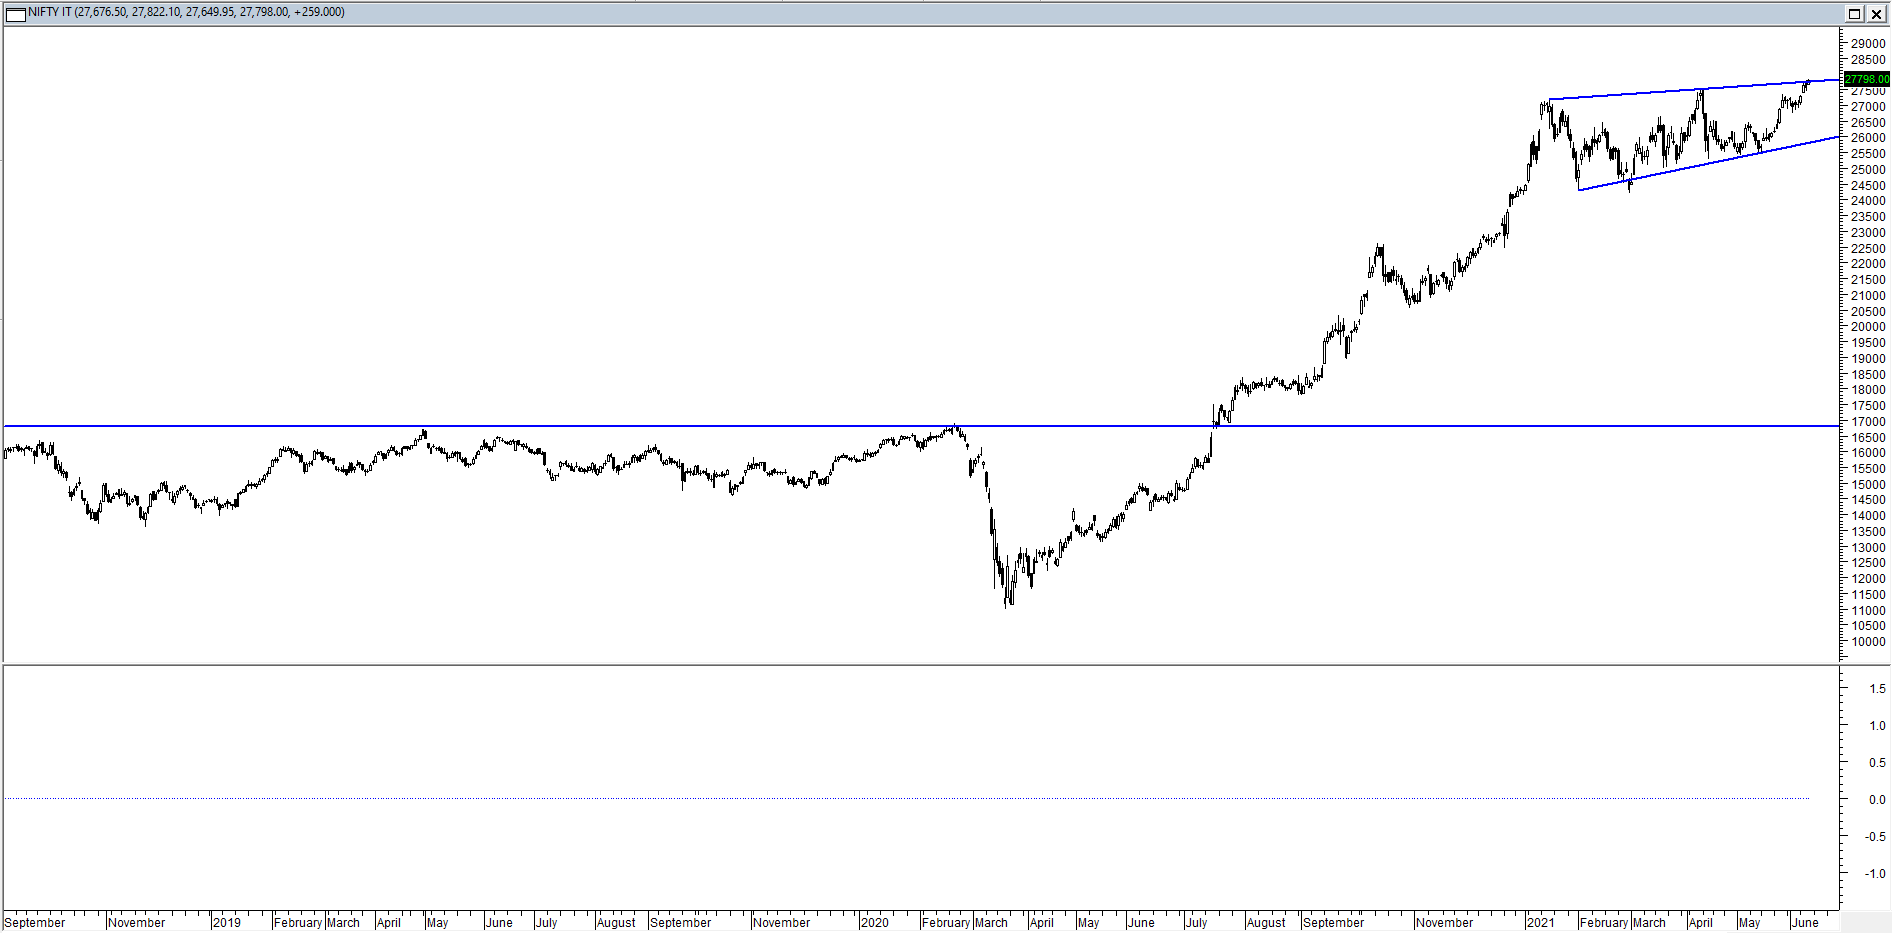
You are right that post the huge run we have had in broader markets, many sectors and stocks have hit all time highs. In technical analysis, the basic idea is that if a stock or sector hits an all time high after forming a technical chart pattern such as Cup and Handle, it is expected that the run will continue to much higher levels. This was seen in many sectors. One of the cleanest examples is the IT sector. It crossed an all time high around 17000 levels and today at 27000+. See chart below. So I could have said “whats the point” but thats exactly the point. I want to look at stocks/sectors making fresh highs after some consolidation. Entering such chart structures at these breakout points can give lucrative returns
Coming back to shipping, below is the baltic dry index, which has made a decade high. This was mentioned in the post above. The shipping sector has its own demand-supply dynamics and things have changed for this sector in last couple of months. Shipping rates have gone through the roof. So it makes sense to look at shipping related stocks, which could give a breakout.
36 Likes
Very good explanation @pikrohit .
In a market where most sectors are hitting fresh 52 week highs/all time highs, one can get better returns as a positional trader if one selects good chart patterns.
Many sectors have run up a lot and are now seemingly undergoing time correction. These are sectors we want to avoid as entry into these names at current juncture will block capital and even might cause us to be stopped out in whipsaw like moves. THE PLACE TO BE IN POSITIONAL TRADES ARE STOCKS WHICH HAVE BROKEN OUT OF BULLISH PATTERNS POST STRONG BASE FORMATIONS AND/OR ARE CONSOLIDATING POST THESE BREAKOUTS. These kind of opportunities give a low risk entry point and since these are on the verge of bigger moves post breakout, there are chances of higher returns.
These kind of stocks are for investors/positional traders who have atleast some knowledge about technicals or atleast recognise basic patterns and ready to read or learn about these things if they do not know about them. Beauty of these patterns is that if these play out and you get your entry right, there can be very quick returns to be made. For buy and hold or buy and forget kind of investors these things do not apply.
I feel there are times to play momentum and times to play defensive. Current time seems to be a momentum trader’s paradise and one can generate a lot of additional returns if they can spot patterns and play them. We at VP are fortunate that there are a lot of guys who take the trouble to post these patterns and some of them are actionable and hence applause for them.
42 Likes
@hitesh2710 If you see multiple such breakouts in various sectors/stocks, do you follow any way to rank them? And in the current broad market rally many sectors/stocks are breaking all time highs/52weeks high, making CnH over long periods etc. So do you follow any process to rank stocks/sectors as after all the capital is limited?