Hi @Lucifer , not used any screener but you can look for clues for narrowing range in the widely available ATR and those kind of things. Since i am not very good at idea generation I look for clues within the VP community itself when people whose opinion is trustworthy post. Many times though, they don’t have time to write posts but they are active readers and hit likes on threads that they are following. So I track likes of these rockstars and then look at the fundamentals, ARs, concalls etc. If I find an interesting chart pattern then it’s a straightforward decision to invest. You can understand the quality of the persons thinking from the way he/she writes and I wish more did that. Till then likes my hustle
I find it easier to do these things programmatically where I compute generic momentum of a short-range - say 6 months. First, the simplest momentum you can calculate is a product like this
(1+r1) * (1+r2) * … (1+rn)
where r1, r2… rn etc. are monthly returns. For eg. if a stock had these returns in the last 6 months
So essentially this stock has returned 40% in the last 6 months. This momentum would automatically give you the returns during the period (if you started with 1, 0.40 would be your profit. If momentum came out to be 4, your profit is 3 so the stock has moved up 300% or 4x and so on)
For range contraction, you are essentially looking for a stock that hasn’t gone anywhere. So this generic momentum value would be very close to 1. Most sideways consolidations are close to 1. Some upwards consolidations at 1.20 like the BSE example above. (Again depends on market conditions as well).
In addition to this, if you want consolidations on an uptrend, you compute 9month generic momentum which is say 1.5 or above (stock has given 50% returns over 9 month period) but its 6month generic momentum is 1.0 (stock has given no returns in 6 months) - This way you can easily filter out different types of consolidations like consolidation in uptrend, downtrend, sideways etc. You can even get rid of volatile ones where returns of a specific month are -50% (stock down half way) so its (1+rn) will actually be 0.50 - you can weed out stocks that are very volatile by ignoring the ones that are moving say > 20% either way and so on.
When you look at the screened results of something like this, you will be surprised how efficient the method is than trying to screen by daily OHLC values. Based on time-range, same method can be used in different time ranges as well since its like a fractal but human behavior and worldly events though aren’t - so I prefer to do this using a monthly return product as above which is relatively more stable.
If you are not able explain the indicators you are using, it does not make sense for the other investors to study the charts. So if you are not going to reveal your secret indicators, please do not post charts on this forum.
What is the mechanics for applying this? Like which site you go to for computing this data also where do you get the data? Is there any platforms available. Would like to explore this more. It would be great if you can expand. Consider me at level 0
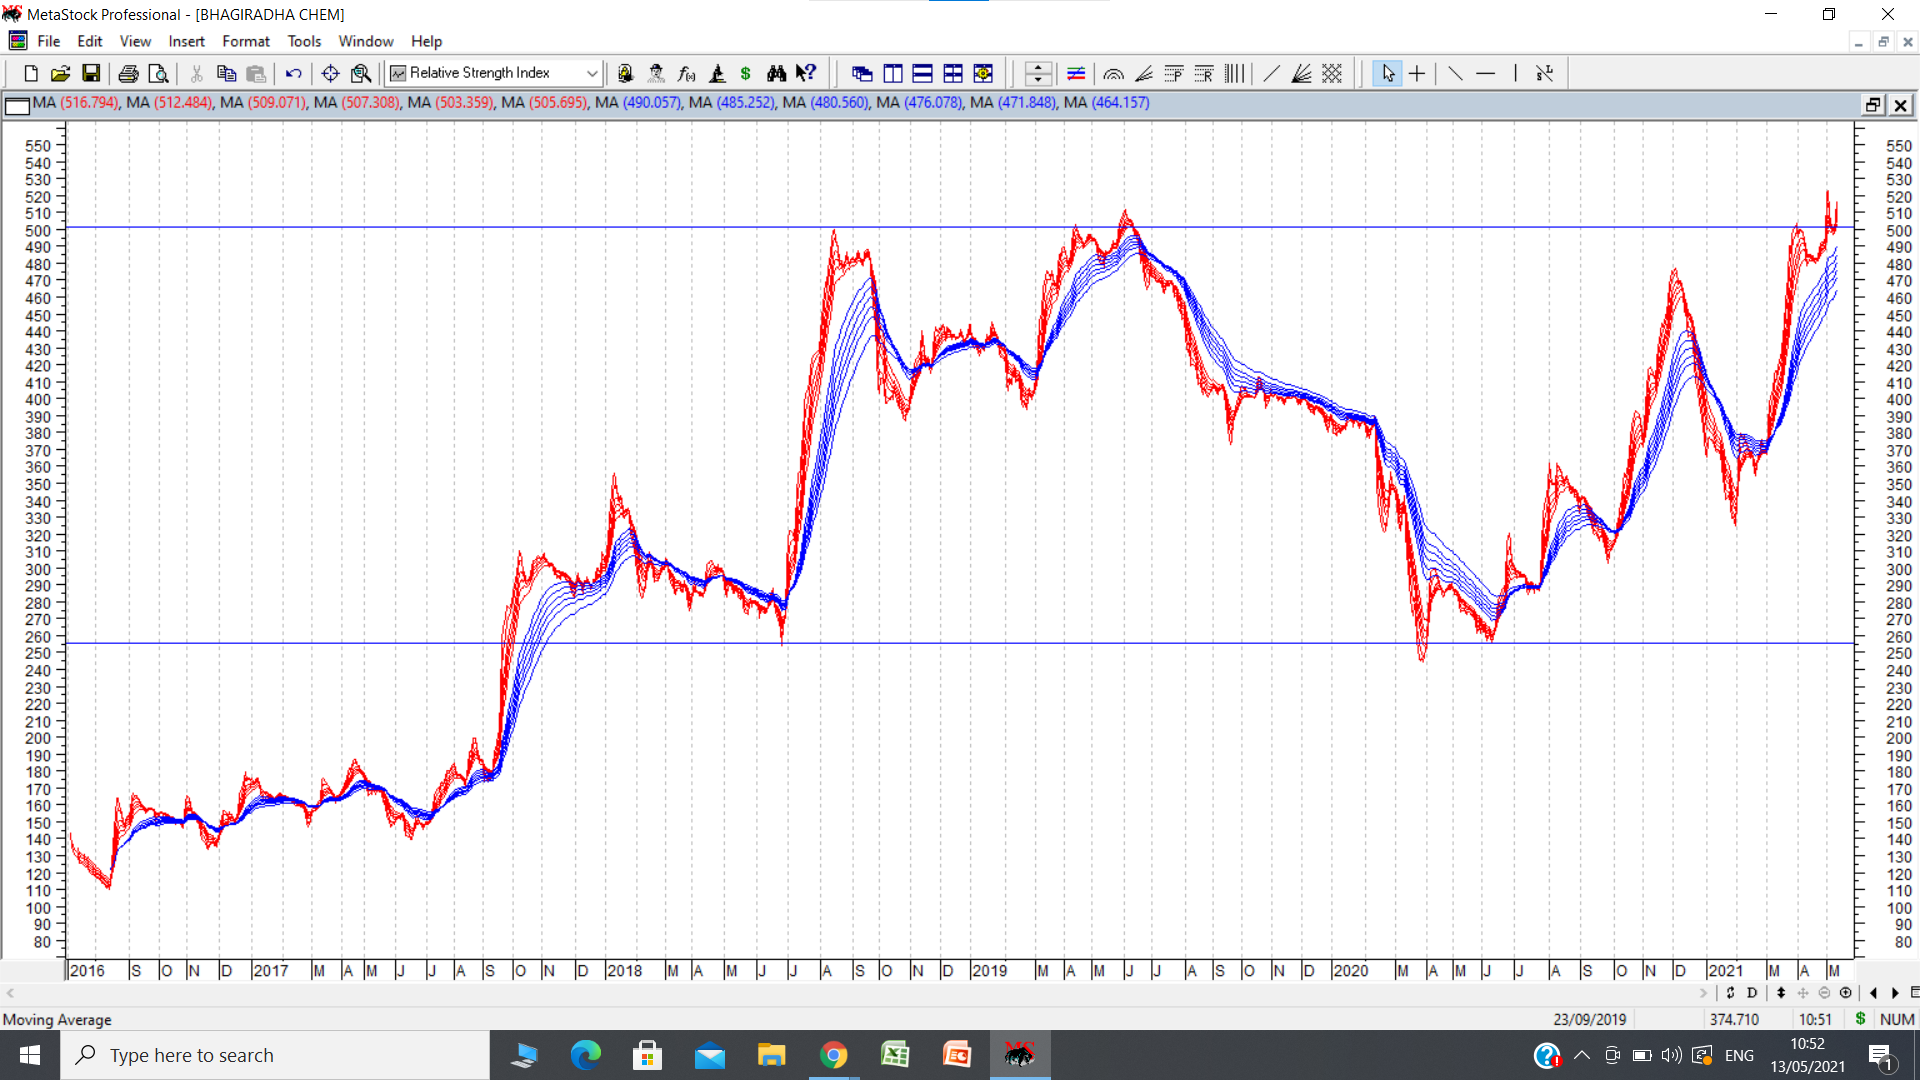
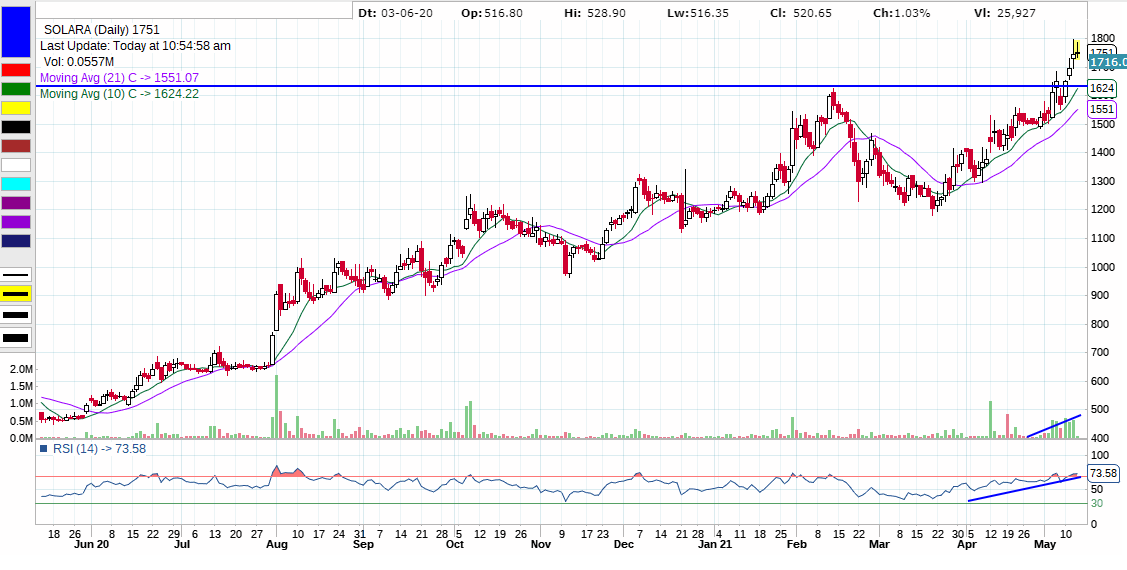
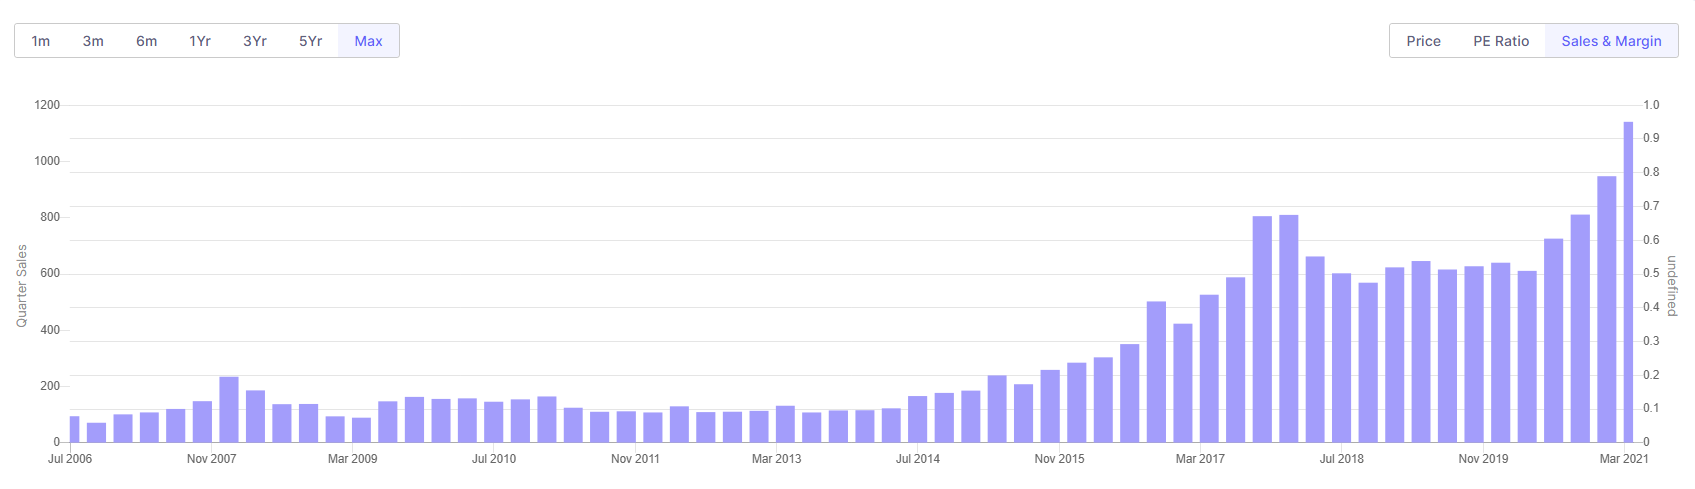
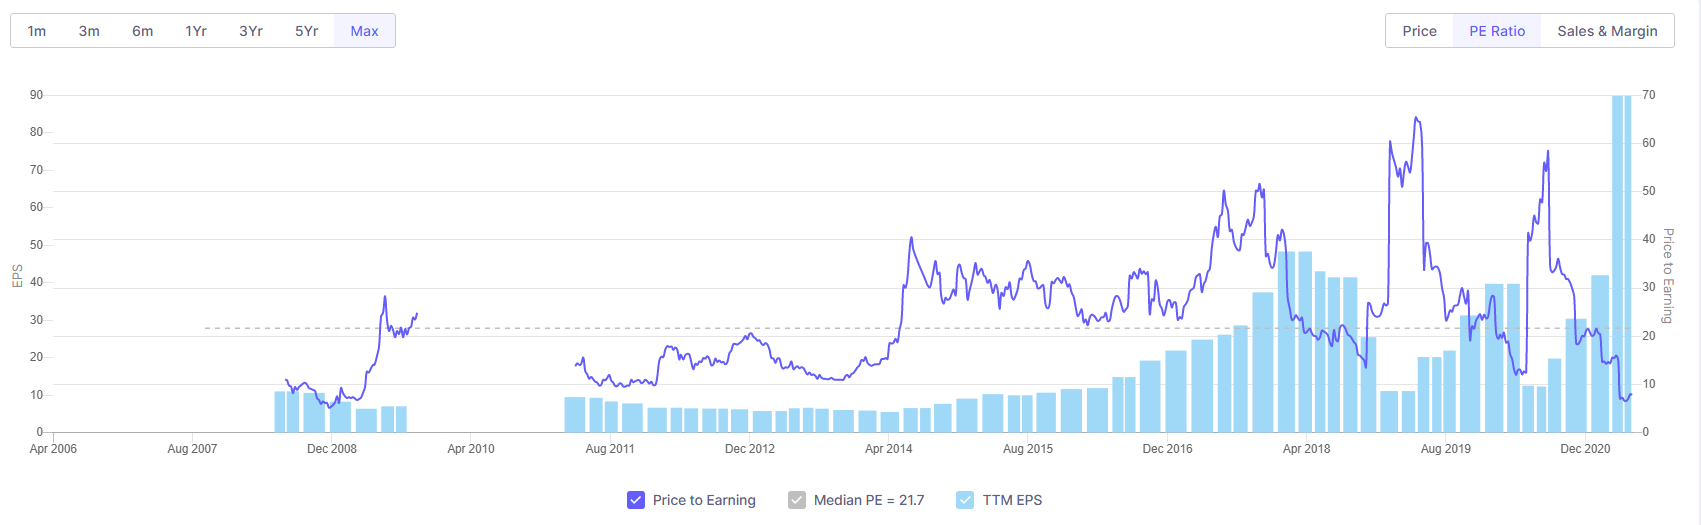
Bhagiradha chemicals. Good results in last 3 quarters of fy 21. Company suffered due to environmental and other issues in fy 20. All time high breakout before results, and subsequent sell off and now seems to be moving up. A double bottom pattern is visible. If successful, target could be 750. disc: own it as a technofunda bet. Negatives: very little information available about the company. Low liquidity.
@hitesh2710 sir,
Apart from Bhagiradha chemicals other stocks in the same sector like UPL, PI Industries, Bharat Rasayan Ltd and Meghmani Organics Ltd etc are making all time highs.
Is it similar to something you witnessed for Pharma sector?
Hi I would not be able to share exact criteria due to proprietary nature of the tool. But I am posting with good intention that somebody can gain out of this. Please see all the charts posted till date. All have given fantastic results. Since admin has told me to stop, hereafter I will not post that also.
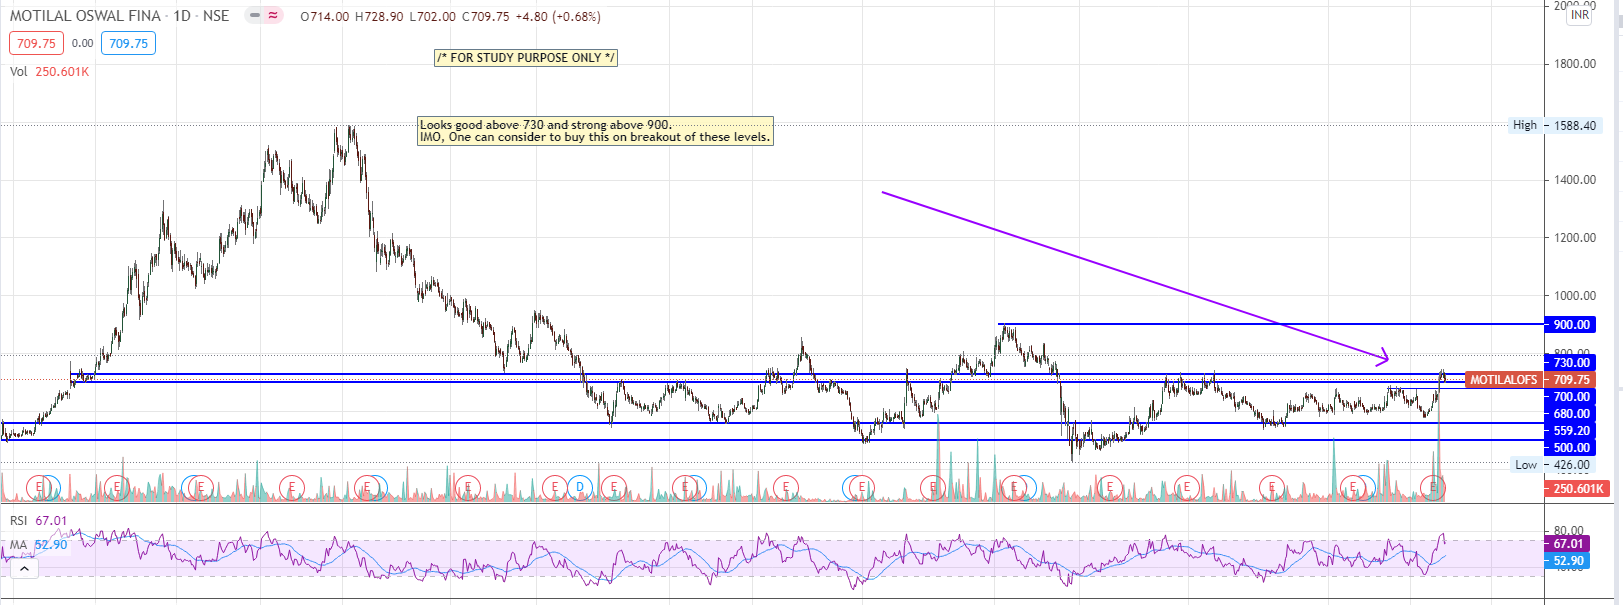
Though, the sector is stressed. MOTILALOFS looks attractive to me at current price for medium term (few months). Technically, it looks good above 730 and strong above 900.
Disclosure: Invested at recent support and current levels (staggered buying). Planning to add in chunks till ~900. Therefore, please assume that my view can be biased.
We do not encourage blindly following any of the investor or investment strategy. This forum is for collaborative learning. So even if your charts works, if you are not able to disclose how you have arrived at your buy calls, it does not make sense for others to follow you blindly. So if you are not able to disclose your indicators, please do not post your charts.
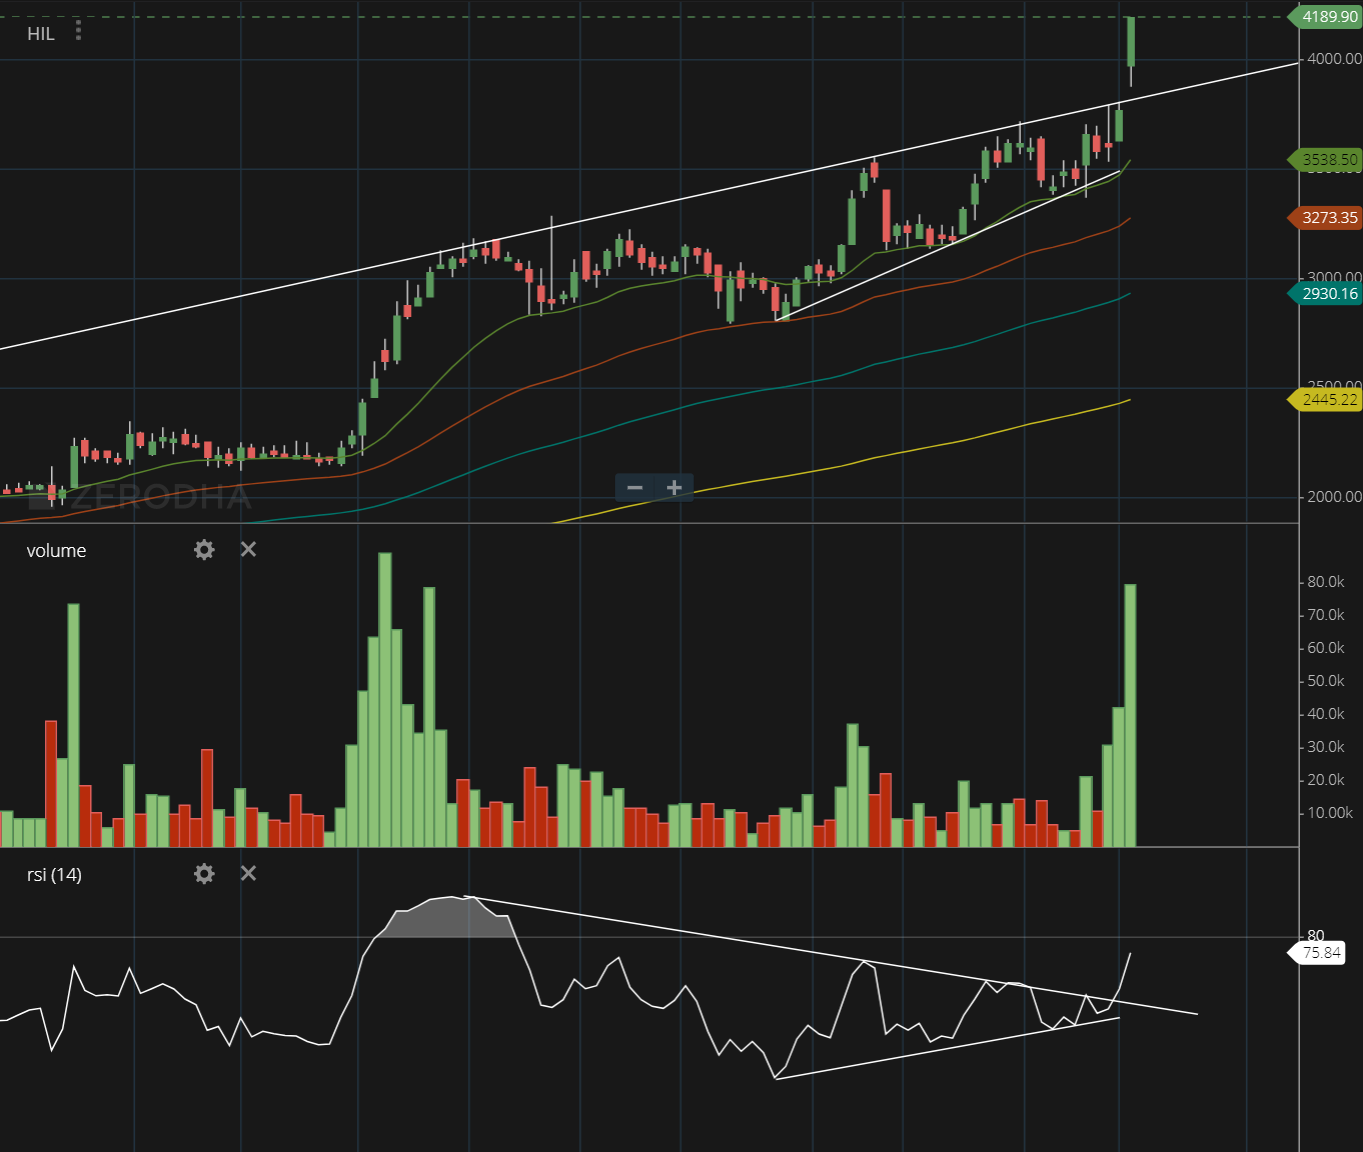
HIL, Daily - Seems to have broken out of upwards wedge. Have a position from here. Fundamentally, have put down my understanding of the business in the HIL thread along with latest results update. This business was perhaps misunderstood when it took a whole lot of debt to buy Parador and now that investment is paying off, along with pipes and roofing business showing stellar growth with even building materials showing green shoots as of last quarter. Lot of cash flows have helped reduce debt as of latest balance sheet (numbers in the last post in the HIL thread). Valuation is still cheap as the Asbestos business which was around 80% few years back is now just around 25% and rest of the businesses are also being valued at the same level. Could just be a matter of time as re-rating happens.
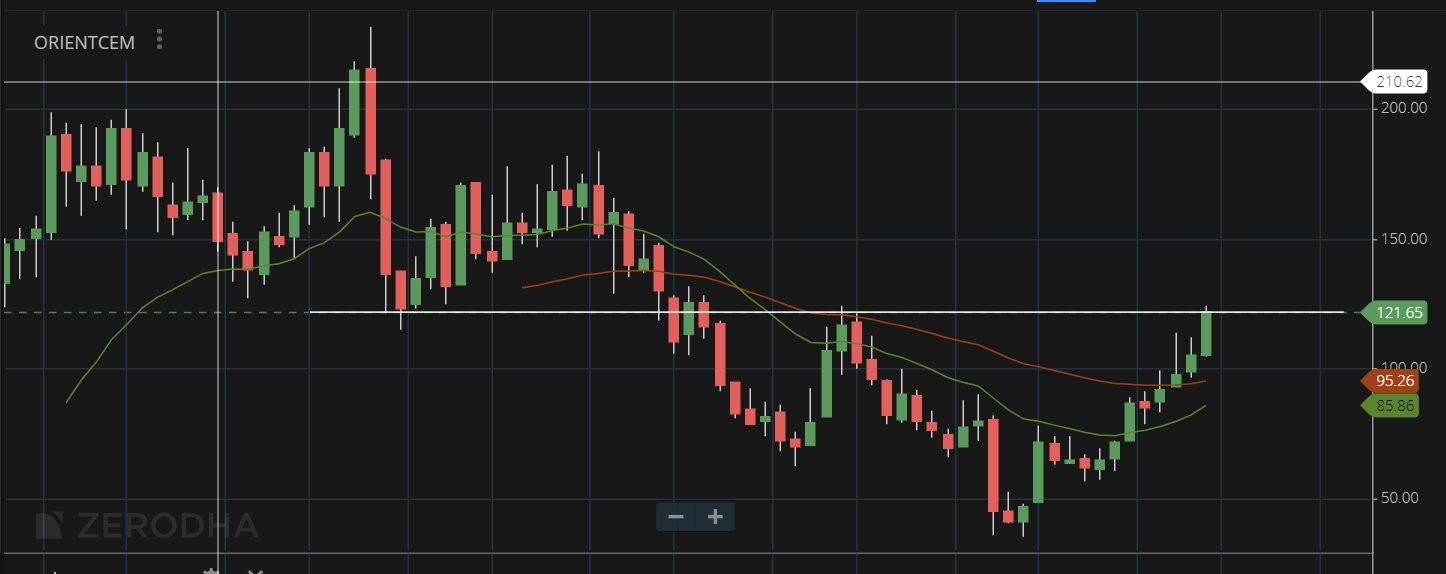
Orient Cement, Monthly - Update from here. At crucial resistance around 120 levels. It may have got the firepower needed to break past this resistance with the Q4 numbers today.
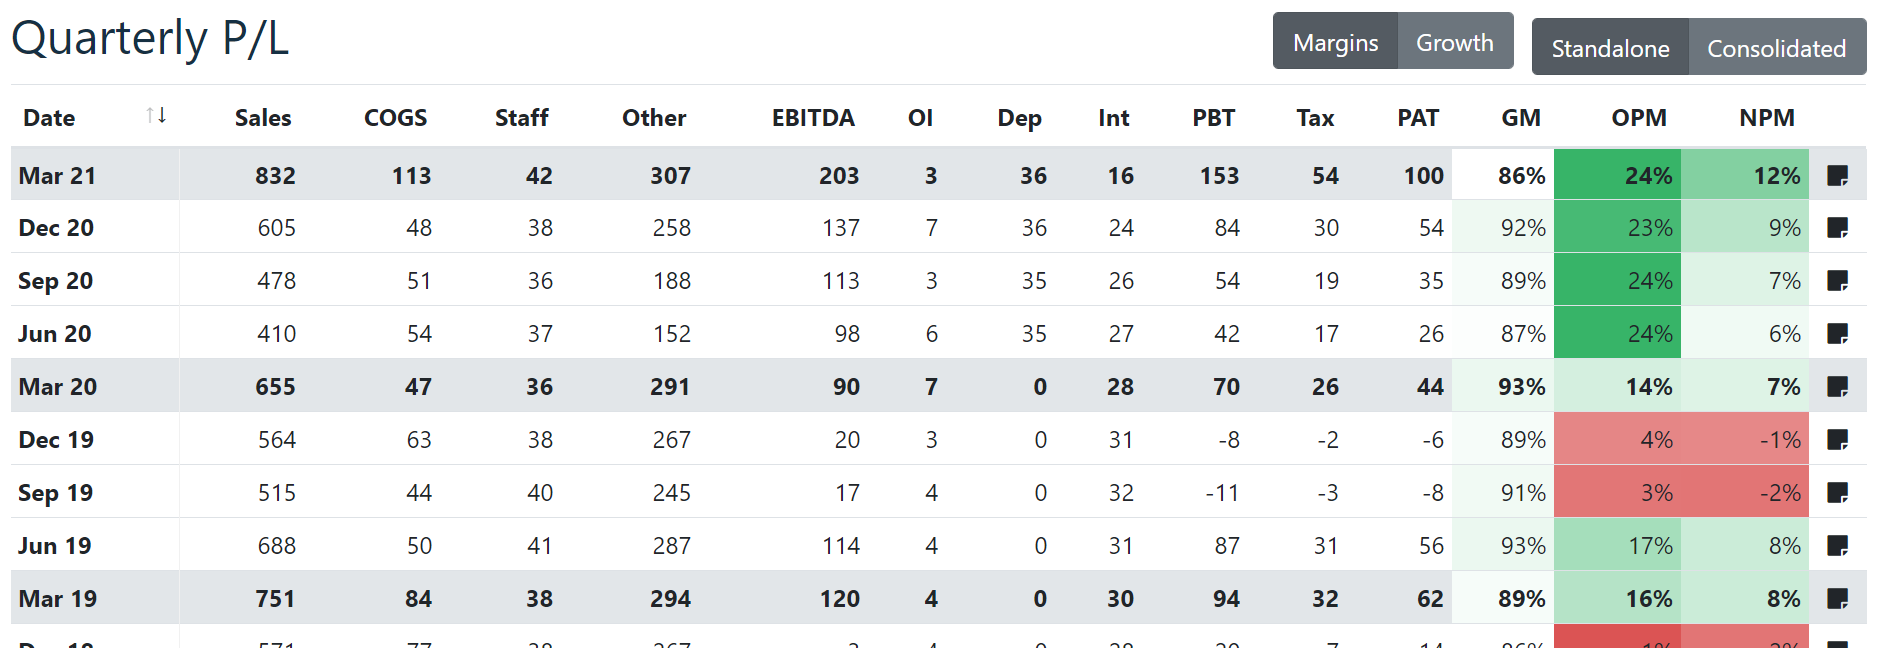
It has done better than the already stellar numbers reported so far with ACC, Ambuja, Birla Corp etc. Operating Margins are stable at around 24% while Gross Margins are lower. Sales has grown 27% and EBITDA and PAT each around 125% YoY.
Valuations are cheap still at 12 P/E and 6 EV/EBITDA. With much improved D/E and a great improvement in WC - Receivables down from 160 Cr to 110 Cr despite the 27% increase in Sales. Inventory as well 236 Cr to 170 Cr indicating much better Inventory turns, the valuation still appears cheap, especially given the growth. (It is still a commodity though, although perhaps cartelized)
Disc: Have a position from around 85 levels. No recent transactions
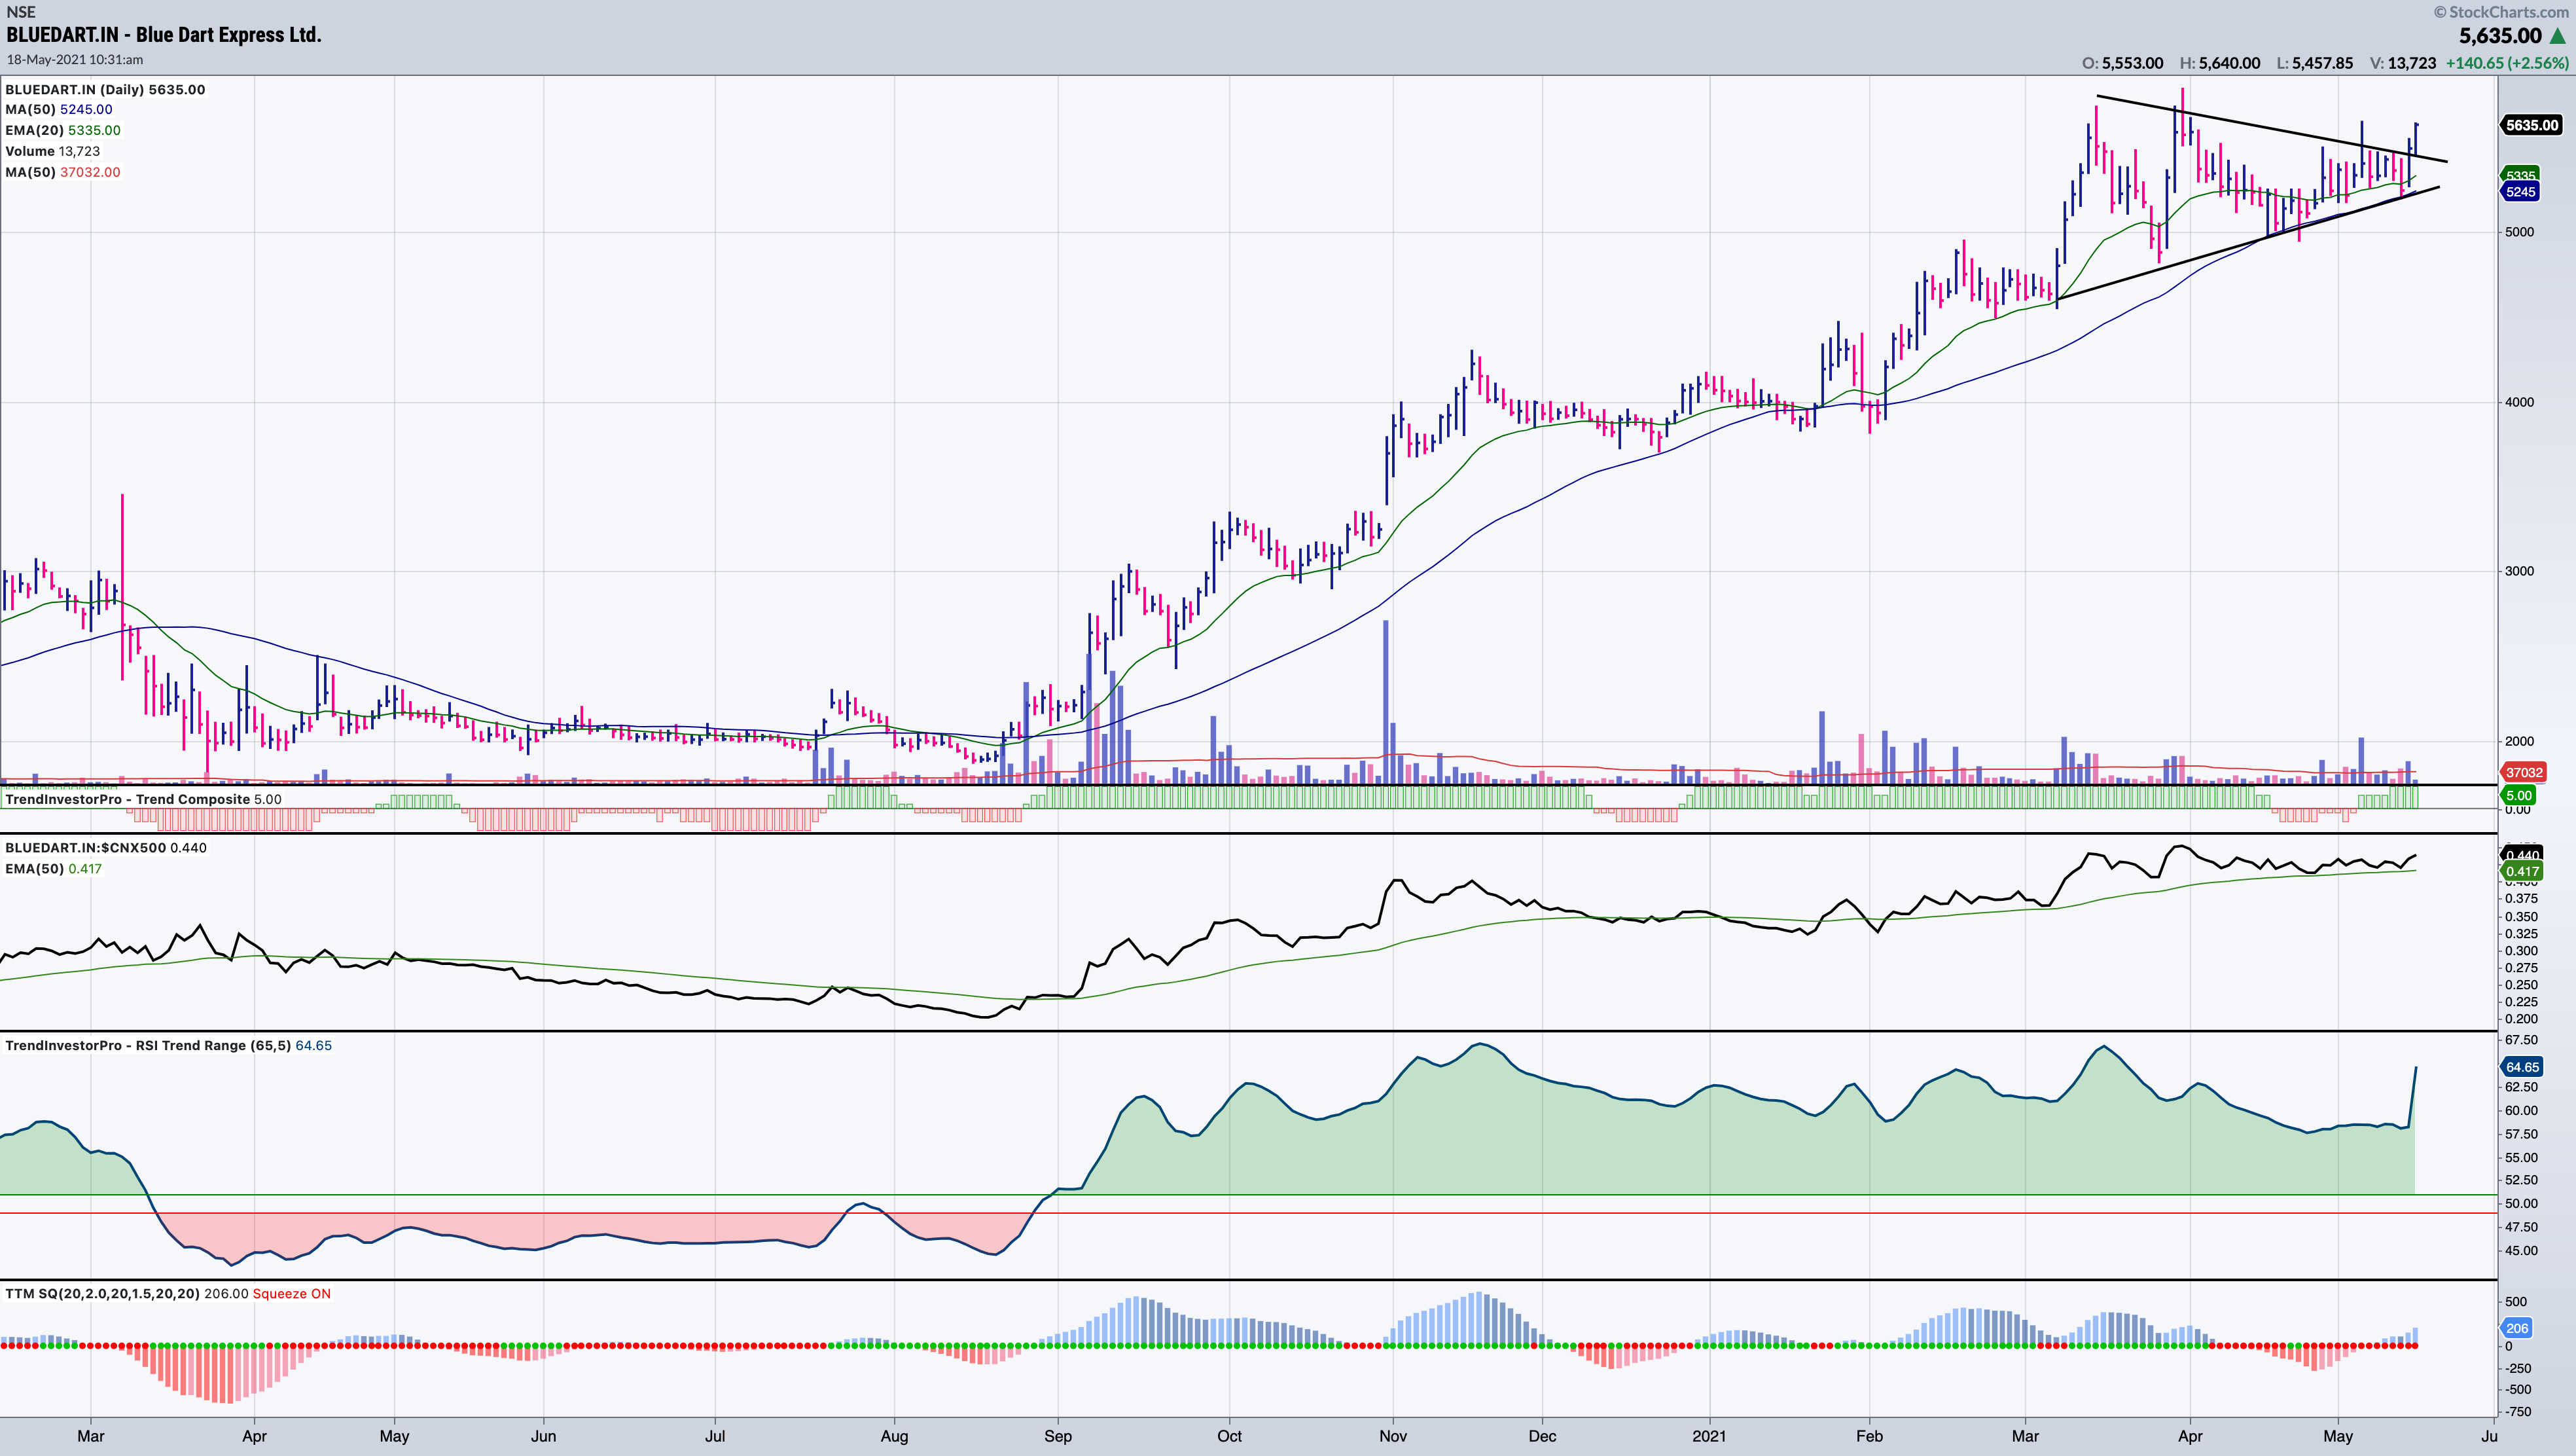
Breakout from triangle pattern.RSI is trending up with good relative strength to CNX500.
Currently BB and Kelter channels squeeze is on, May expand to upside.
Company has reported good YOY quarterly numbers.though QOQ is down. Down from 52w high -6.05 %
Qtr Sales Var : 33.3 % and Qtr Profit Var : 394 %
QoQ Sales : -6.64 % and QoQ Profits : -5.58 %
Daily Chart:-
Stock is posing to breakout the resistance line.Price has been consolidating at the ATH from a long period.5-day SMA of the RSI(65) pointing up.Company clocking good sales and EPS growth.
Couple of years back it had formed similar setup and is visible in your weekly chart…If history repeats it may breakdown also…!! But nothing can be predicted till breakout/breakdown happens.
Fellow VP members, please have a look at Bajaj Steel Industries. Looks like a good ‘technofunda’ bet for next 3 to 5 years
I have attached the word doc with the graphics and commentary Bajaj Steel.docx (1.6 MB)
Views invited
Thank you!
Disc: not invested yet, but planning to take a position around Rs 545-550 levels
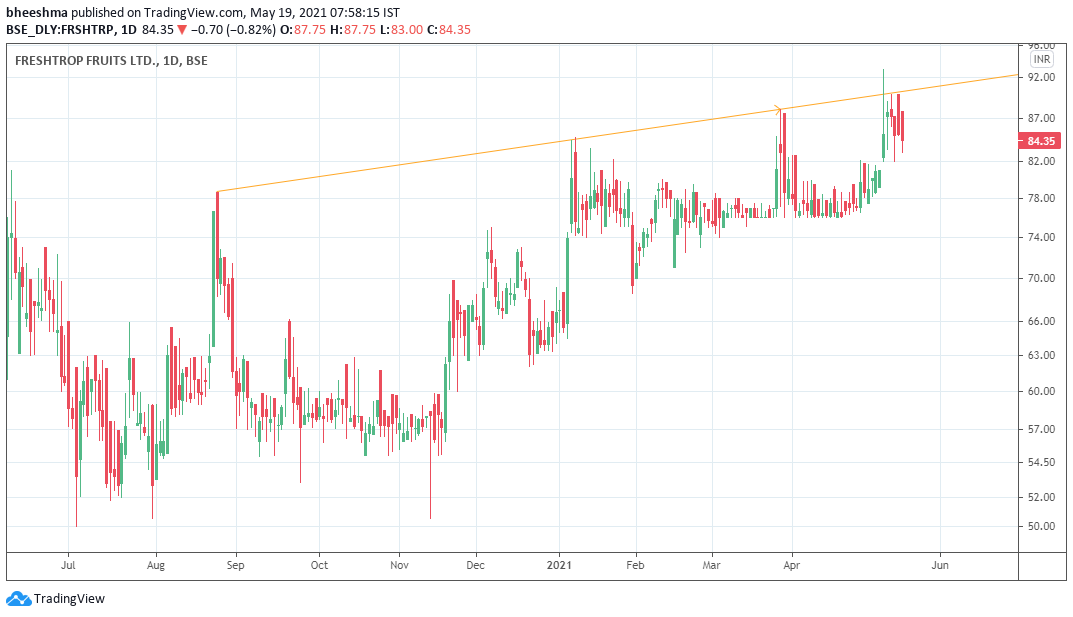
Nice rounding pattern on the freshtrop fruits daily chart just before the beginning of the main Q4/Q1 quarters which account for most of its topline. Operating Margins are at a 10 year low and it finished 2020 with an operating margin of 7%. Peak margins have been 14% and in case margins revert there will be a boost in profitability going forward. Co has also done well to grow topline throughout the cycle although topline has stagnated for the last 3 years. Indian grape export is a 2000-2500cr business and Freshtrop is a major player.
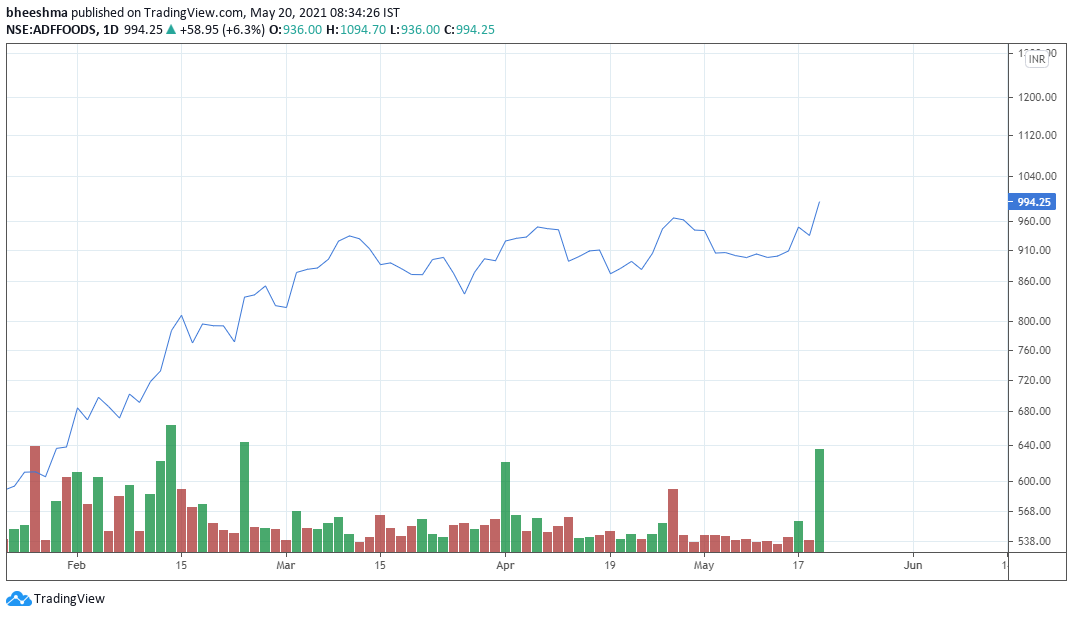
Classical cup & handle breakout on heavy volume in the ADF Foods chart. Pattern target seems to be 1150 - 1200. Cup is also shallow, which is an added bonus - shallow cups are considered to be more bullish than deep ones.
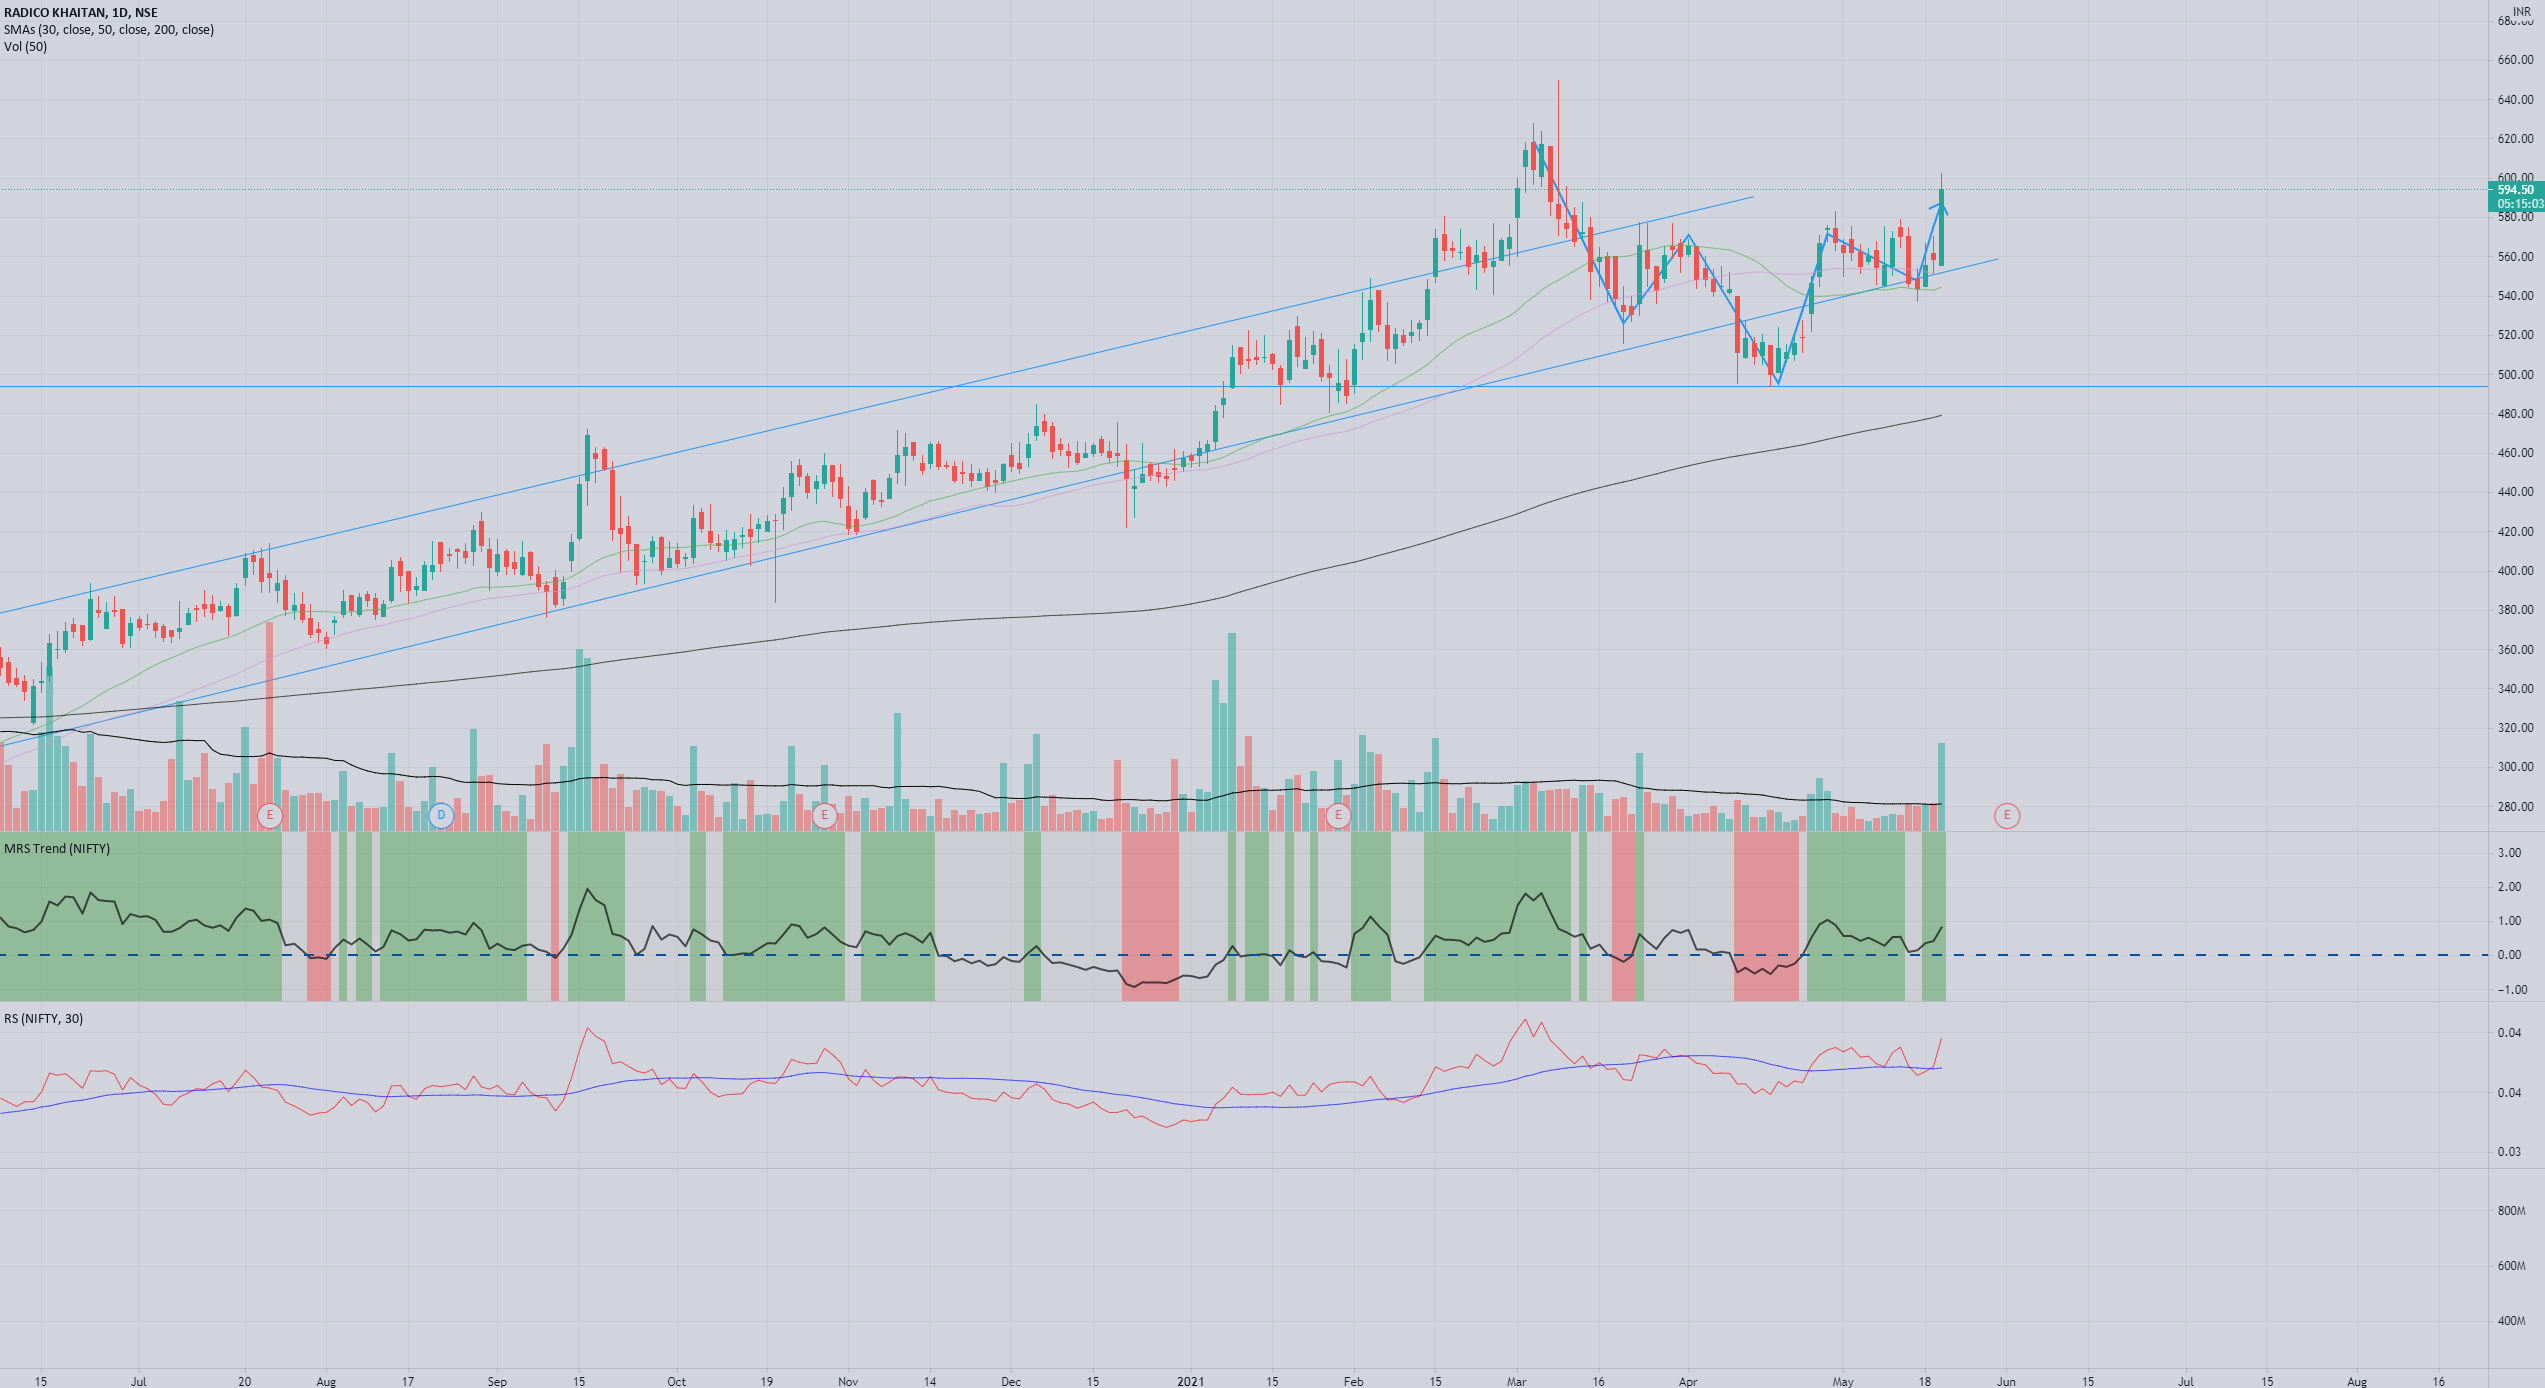
A classic O’Neil W-shaped bottom with handle on daily of Radico. Breakout today with volumes too. Is a rerating on the cards when United Spirits quotes a much higher valuation?