
BKT came out with good results, with improvement in profit margins. It just crossed its 3 year and All time high. Looking good on both technical and fundamental fronts. Any expert opinion on the set up please? @hitesh2710

7 Likes
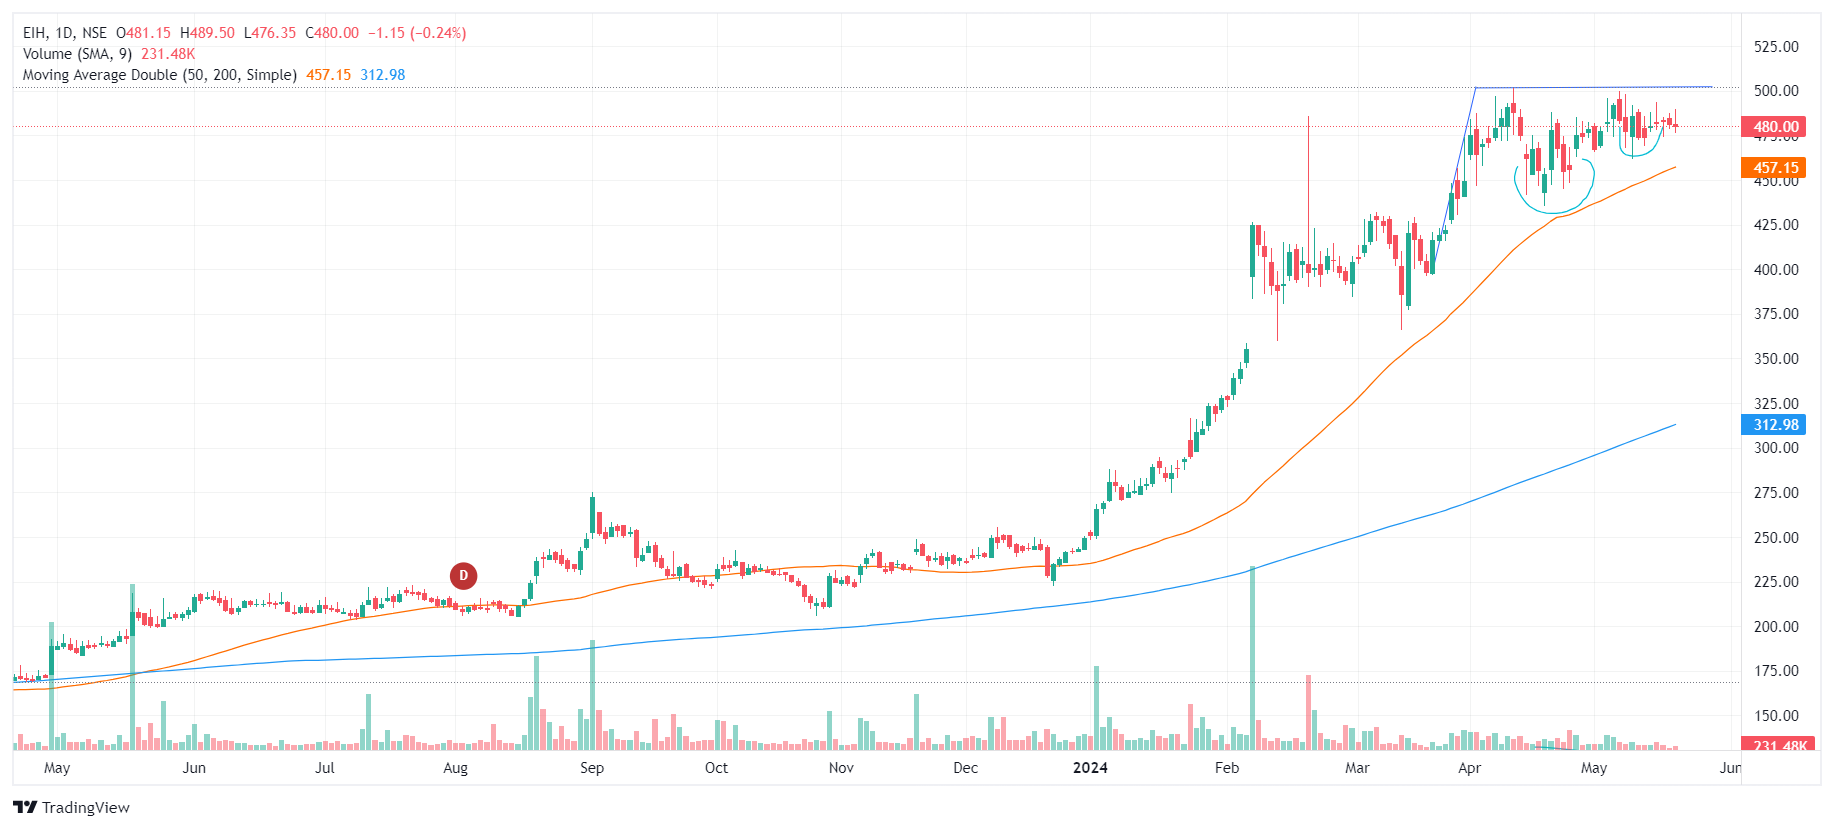
EIH Ltd CMP 482 - Update.
Stock price of EIH Ltd has been consolidating since April 10, 2024 when the stock price hit an all time high of 502 Rs. The stock price is consolidating since April and the volume has reduced as well. This is type of consolidation is in a form of Volatility Contraction Pattern (VCP) coined by Mark Minervini, It is showing constructive price and volume action as supply is absorbed from left to right during a price base and the accumulation The VCP breakout is when the stock moves through a clearly defined pivot point which is at 502.
Fundamentally, as per the announcement by the company the Q4 results will be out on May 28. The results were good in the past quarters and the luxury hotel industry is in a better shape.
Disclosure : Same as above.
4 Likes
Hi Vishal…One query, as I am learning and came across VCP and Minervini book recently.
The 2nd basic condition for VCP as well as overall momentum investing is the sector of the respective stock should also be in momentum.
But when i check hotel sector…
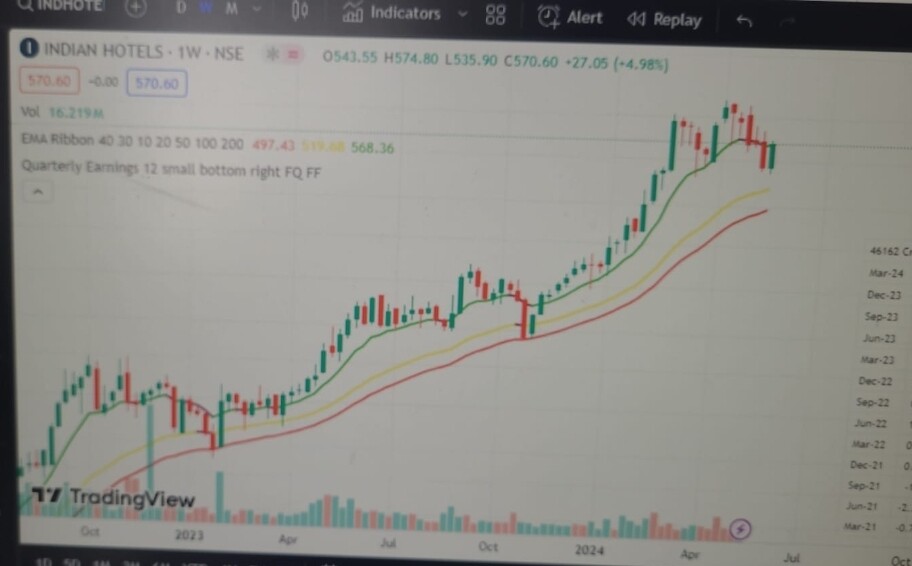
Indian Hotel seems to be in stage 3
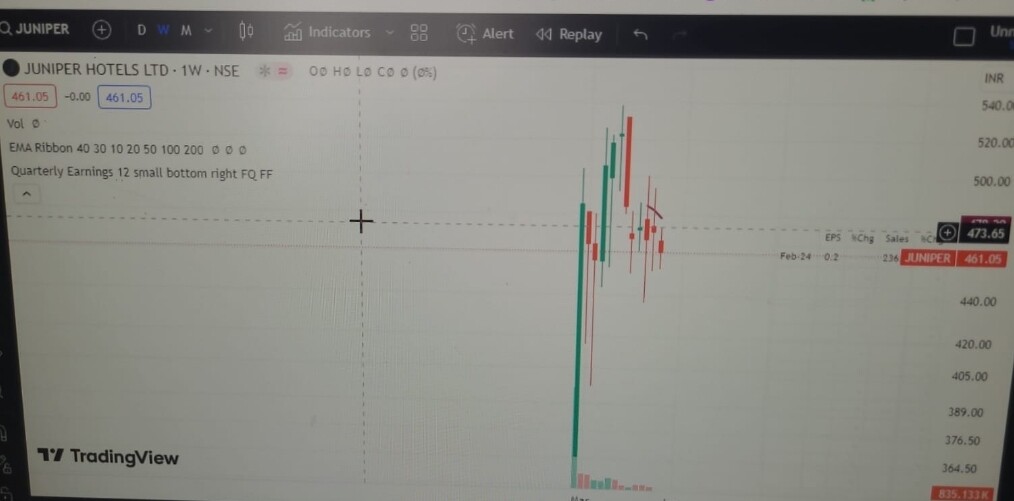
Juniper hotels in stage 4
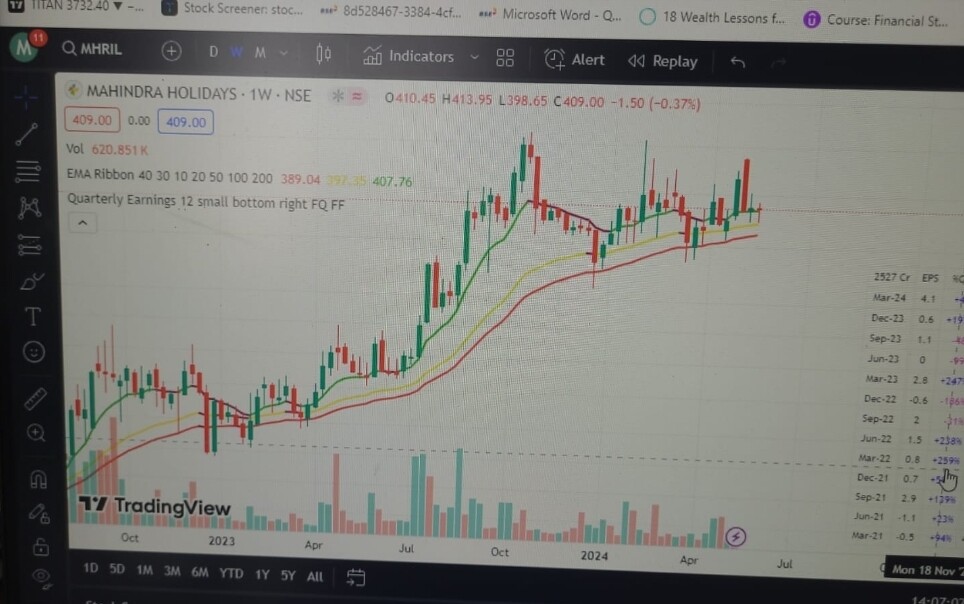
Mahindra holidays in stage 3…
Somewhere i read that the 50% upmove of stock is due to overall market and itse sector being in momemtum.
EIhotel is cleary in stage 2 and in VCP but its not from sector which is in momentum. That is the reason, even if I hold this stock in my PF, but have low confidence, which may prompt me to sell at any slight downfall. Please help me clear my doubt and pls say that I am reading it all wrong ![]()
4 Likes
Hi All,
Paras Defence ,

On one side we are seeing a breakout after a long consolidation from technical perspective but on the other side , Q4 FY24 results are not that great(QoQ up, YoY down). How should we proceed when market opens on Monday from short term perspective?
3 Likes
Hi Mudit,
Fundamentally the sector has done good in FY24 and the same was seen in price up moves of the entire sector. Now on it has to be seen how the sector does in coming years, if the profit growth continues the price action will continue. I don’t use technical indicators alone I would also look at profit growth as well. From the sector I am invested only in EIH ltd, as technically the price broke out of multi year consolidation and in my view fundamentally it is undervalued compared to the peers and the sector leaders trade above 60 PE X and technically it is consolidating in form of VCP. Now it has to be seen how Q4 pans out for EIH ltd. On the Q3 con call the management was confident of holding on to the ARR trend which was seen in Nov and Dec. These are my personal views and this is not a recommendation, I maybe wrong in my analysis, as I am biased and invested. You can take your own decision after doing your own diligence.
Regards.
2 Likes
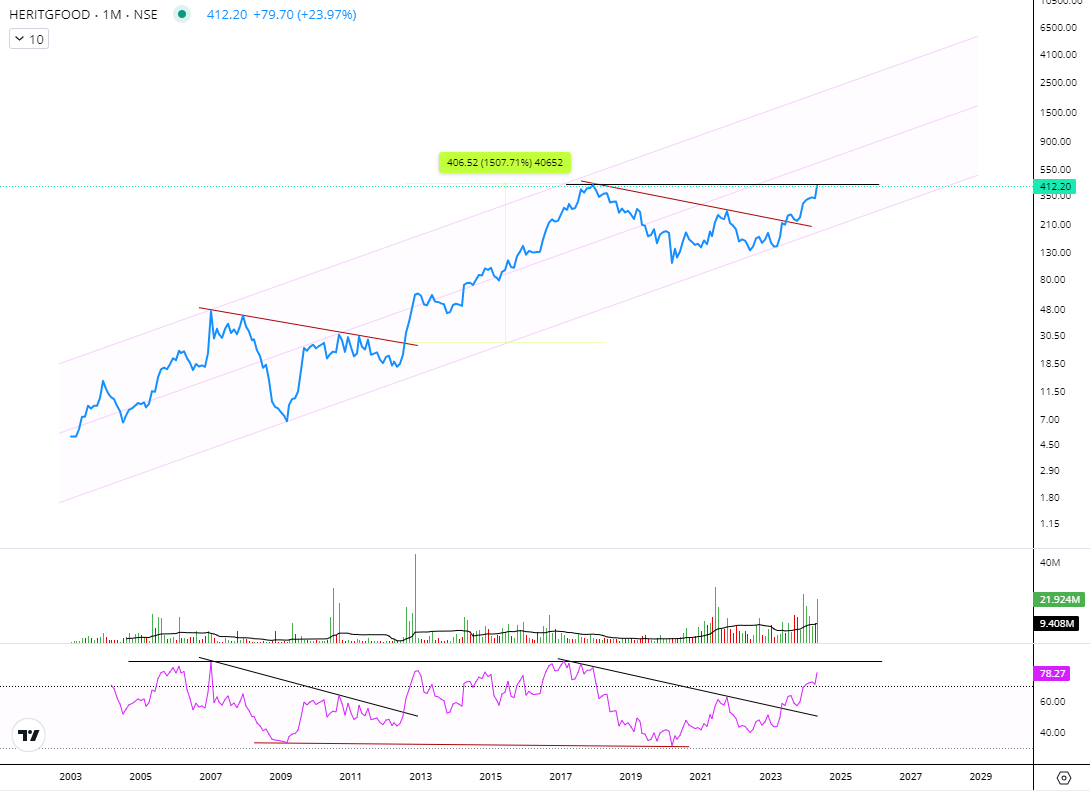
Update: HERITAGE FOODS: 155-245-413 CMP
- Long term trend reversal seems to be possibly taking shape
- RSI has broken out on Monthly chart
- Downward Slant line broken - (Confirmation would be monthly close above)
- Hidden Bullish Divergence (Brown TL) played out well with price almost nearing the Previous ATH.
Safe to assume bullish bias ahead.
11 Likes
Zomato cmp 172. Yesterday in the overall market panic it went down to test its 200 dema and posted a swing low of 146 and bounced back to close at 172. It formed a daily hammer candle with low near 200 dema.
Zomato is a very good example of understanding early stage rounding bottom, and importance of support (75 levels ) which later becomes resistance for some time and then again support and then a launchpad for a big move up. Now levels of 169 which was previous all time high is key level to watch for support/consolidation. disc: no positions. under watchlist.

23 Likes
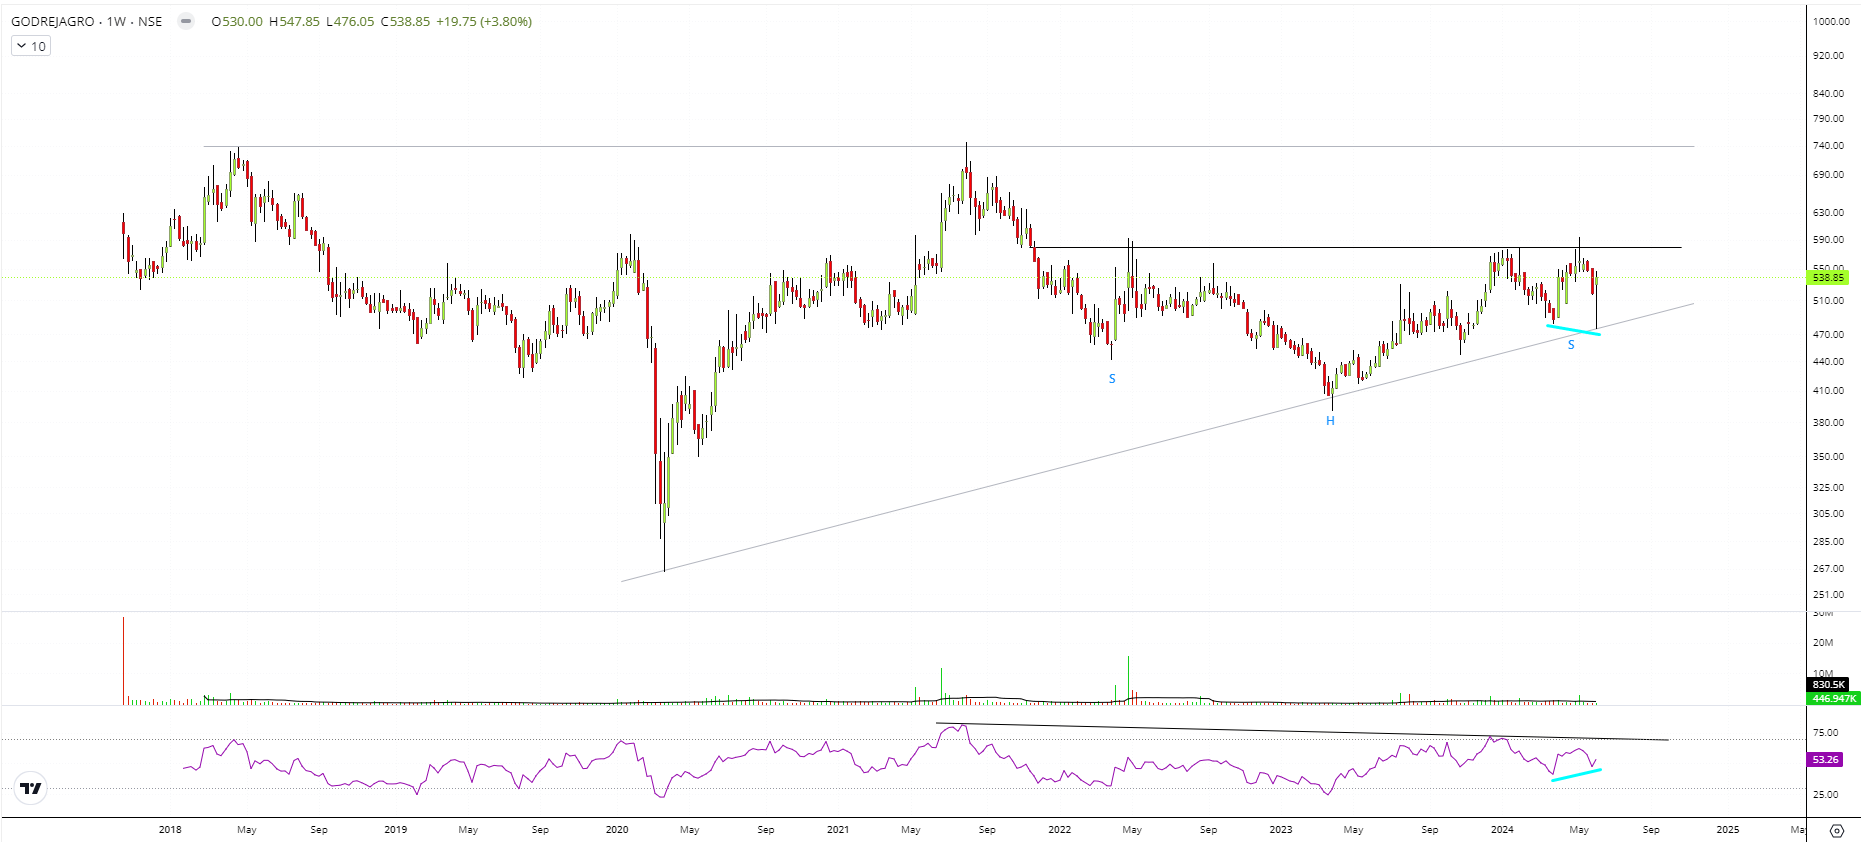
GODREJ AGROVET 480: Weekly Time Frame Chart
- Inverse H&S pattern forming since November 2021.
- Positive RSI divergence seen (blue)
- Ascending Triangle setup longer term…
Safe to assume bullish bias ahead post breakout of Inverse H&s pattern.
5 Likes
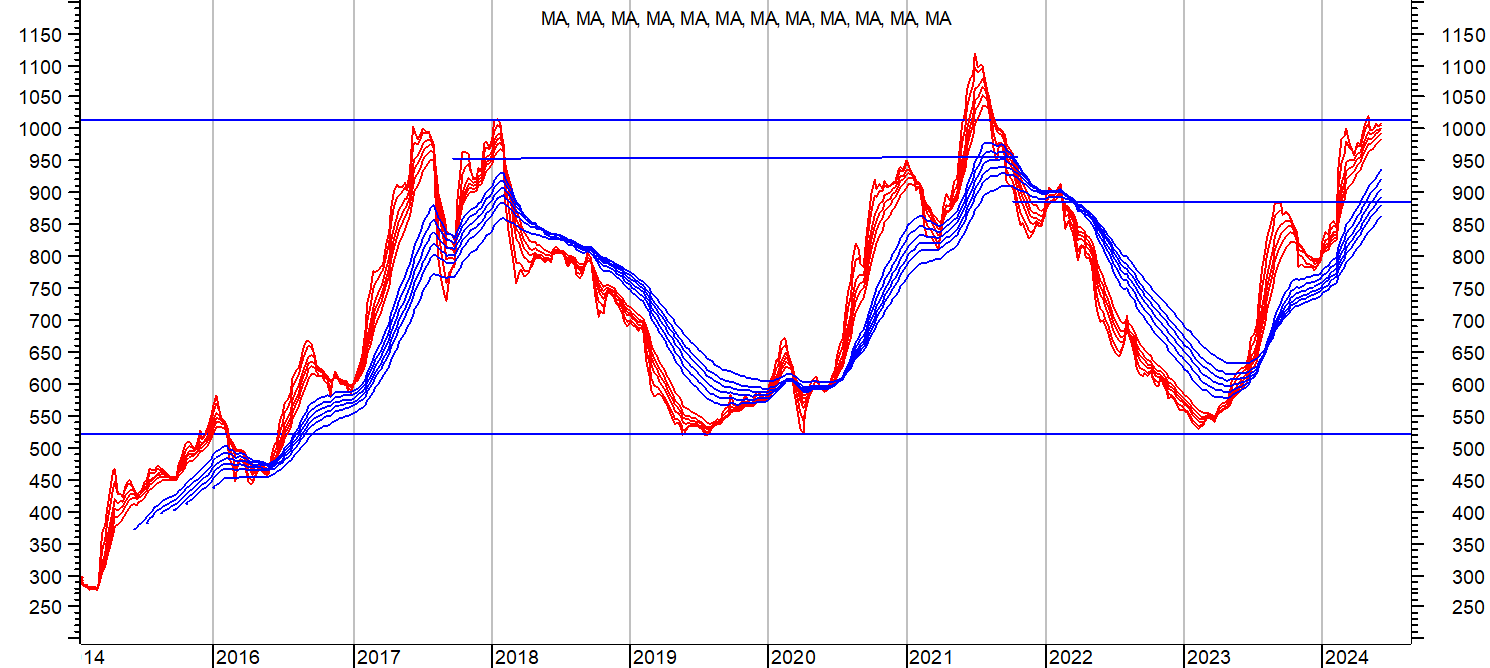
Natco update. Post the earlier post I had bought Natco and sold at around 850 kind of levels with decent profits. Since then I did not track it too regularly. But I happened to see the recent results and on reading the concall, came across management comments about delivering atleast 20% growth for FY 25. Just for the record, FY 24 net profit was at 1388 and this is after some write offs as mentioned in results/concall. Revlimid momentum continues and overall growth seen from geographies other than US also. Cash on balance sheet close to 2000 crores with around 120 cr debt.
Post results it hit a high of 1100 and promptly corrected and along with the rollercoaster market it also went down to post a swing low of 952 in the turmoil yesterday and managed to close again above 1000 today.
Attached chart contains GMMA (guppy multiple moving averages ) and is a weekly chart. Range bound trading was seen in Natco from 520 to 1020 from July 2016 till date with ocassional attempt at levels above the range which was for brief period.
On right side of chart a cup and handle pattern is marked and stock price has broken above that and managed to stay above that. Technical target for that is 1300 plus. Now we can also see a previously marked cup and handle breakout that happened and stock price went up briefly only to correct significantly. Hence the need to check on fundamentals.
disc: invested.
For anyone wanting to study this company, there is presentation, concalls etc. disc: invested based on techno funda picture. (anyone contemplating investing should do their own diligence, this is not an investment advice)
26 Likes
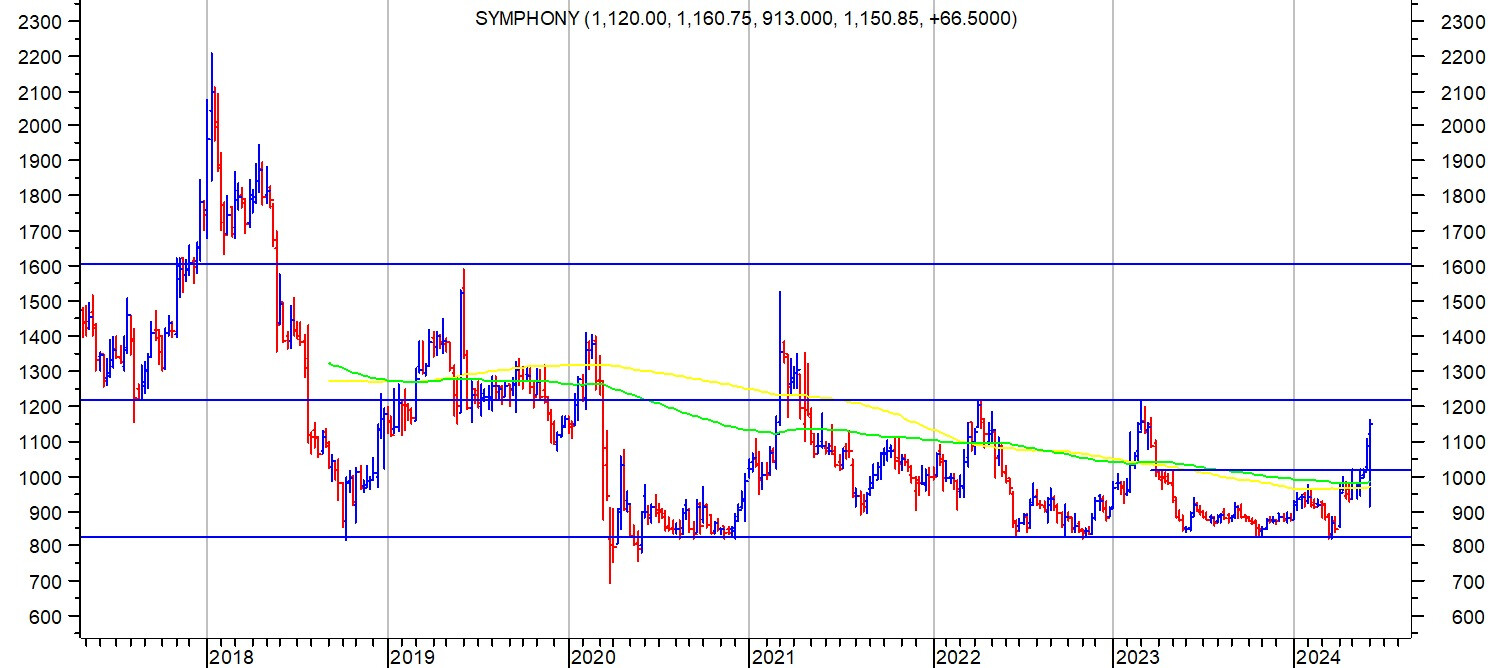
Symphony had a massive rally from levels of 100 in 2012 to 2200 in 2018, a 22 bagger in 6 years. It then went into a corrective mode and made strong base between 800-850 ( with the panic Covid low of 690) q4 fy 23 and q1 fy 24 results were poor. q4 fy 24 numbers already reported have been good. In view of the extremely hot summer, q1 fy 25 results also likely to be good. Management commentary has been good. Subsidiary performance (barring Climate technologies Australia) has been good.
Attached chart shows a rectangular consolidation going on between 826 and 1216. If stock price manages to break out above 1216, technical target can be 1600 plus.
disc: bought as a tactical play on quarterly results . (not a recommendation. please do your own diligence if investment is contemplated. Presentation, concalls etc resources easily available)
26 Likes
@hitesh2710
Sir, one apprehension, if you could help…there is nearby resistances at 1200 level and little bit faar away even 1420 resistance is there. So is it more prudent to wait till it crosses 1420 and comes in blue sky zone? Or …
Your apprehensions related to overhead resistances are quite valid. There are resistances at the price ranges you mentioned. Here the chart presents a first entry point kind of opportunity with stock trying to consolidate above its 52 weeks high. Next logical expectation is to see it cross overhead resistance at 1200 plus kind of levels and stretch a big higher, or maybe consolidate around 1200 kind of levels. As you can see, since 2022, two attempts at 1200 have already been made without success. With an improving fundamental picture, and slight change in preference in markets for “quality” companies, my expectation is that 1200 range could be crossed in near future. We have had a very hot summer and all these AC and cooler companies will report bumper sales.
My strategy is to play Symphony for quarterly results, and then review if the picture has improved to the extent to consider it for longer term. Dips to 200 dema or near term supports should be observed to see how the stock price behaves.
13 Likes
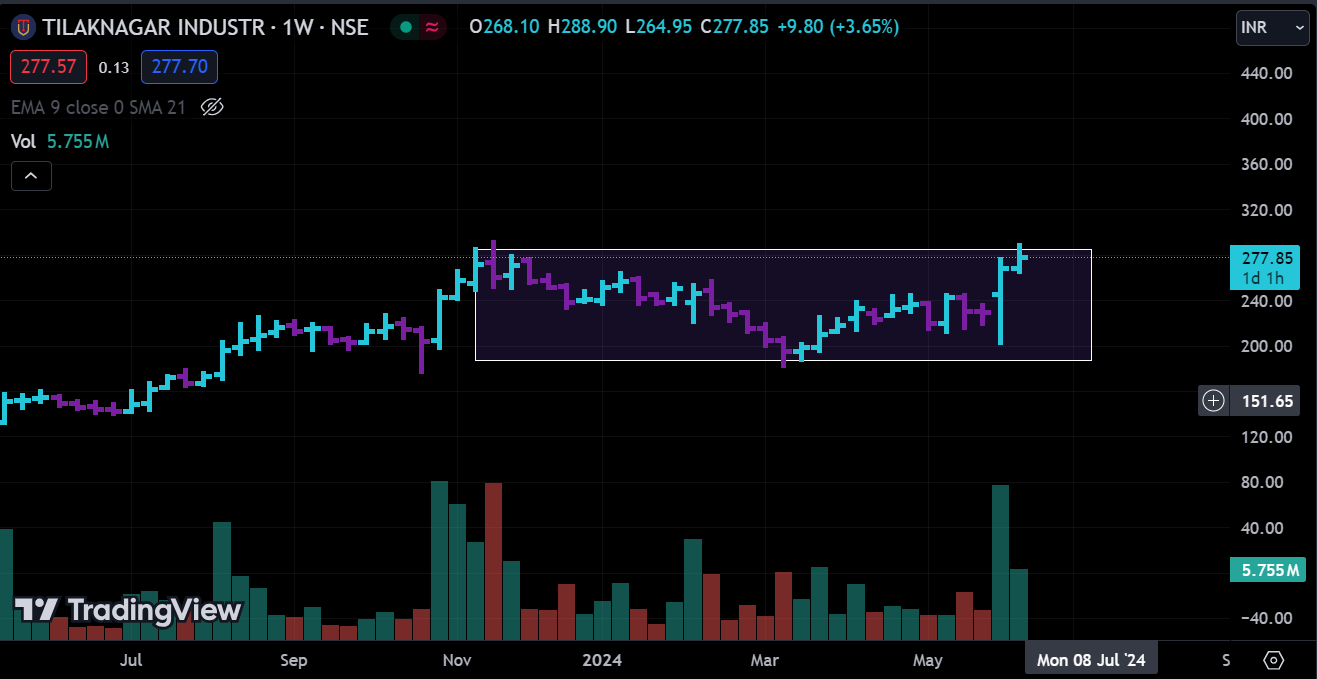
(Tilaknagar industries)
Company expects revenue to grow at 15% CAGR. EBITA growth will be more than sales that due to operating leverage. Company has reduced debt from 1200cr to 130 CR in 3 year span.
It is about to breakout above ALL TIME HIGH!
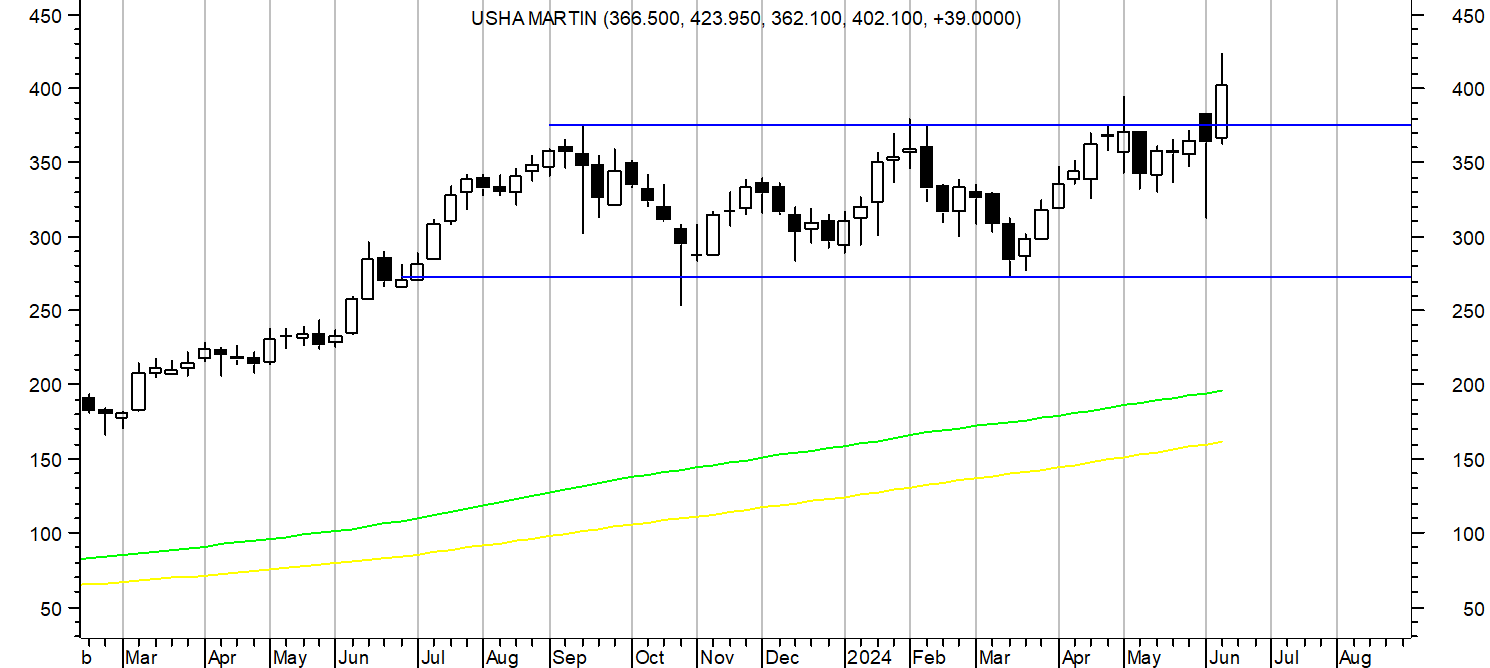
Usha Martin follow up.
After nearly a year of consolidation between 270-380, stock price finally managed to move above the consolidation zone and closed with a big bullish candle above the zone with good volumes. It has formed a W or a double bottom breakout with potential targets of 480. There can obviously be the retest and consolidation at or around breakout zone of 380-400. disc: invested.
28 Likes
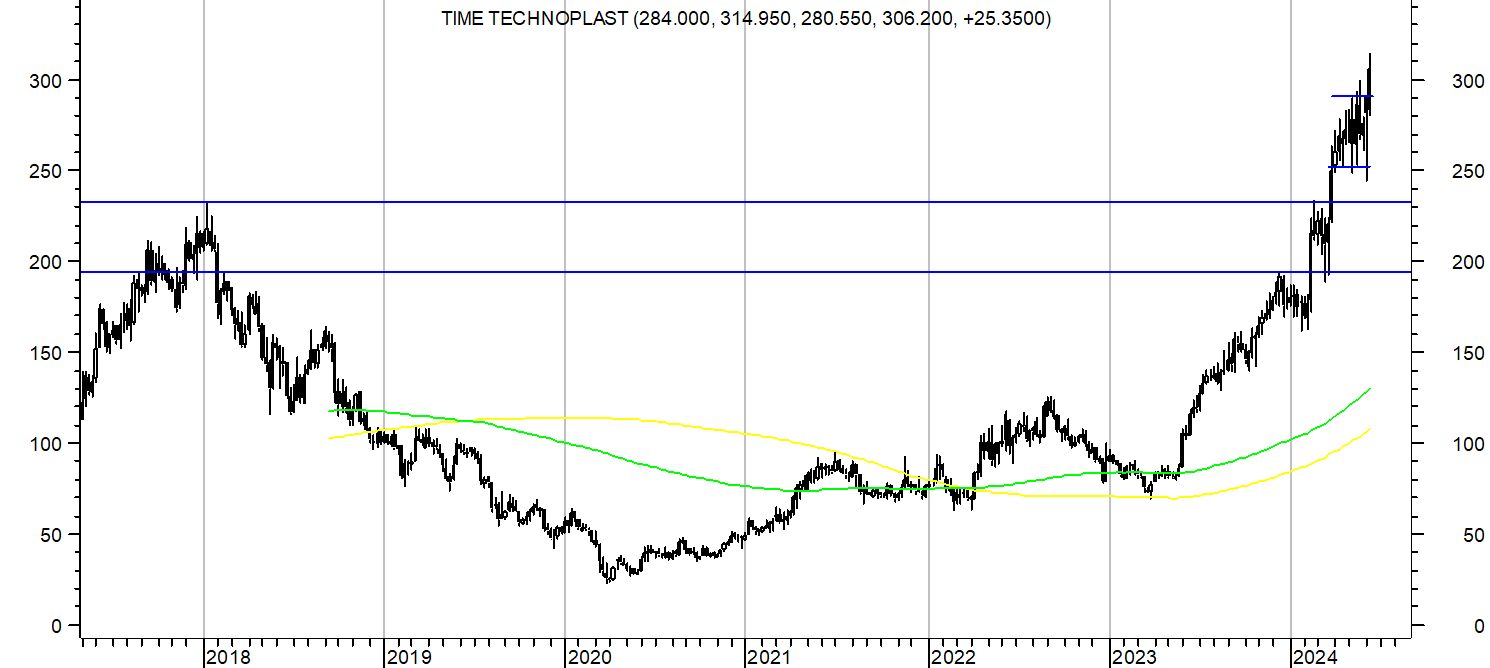
Time techno cmp 306 crossed its previous all time high of 232 (posted in Jan 2018) in March 2024. During this time it formed a rounding bottom structure with bottom at 24. After crossing its ATH of 232 in March 24, it consolidated in a range of 240-290 for 10 weeks and last week gave a breakout and close above the range. Some technical analysts use the range calculation method wherein target is calculated by adding the depth of rounding structure to breakout level. If that is done in case of time techno, target can be 430. If we use retracement method potential targets are at 360 (161.8% of entire fall from 232 to 24) and 570 (261.8% of entire fall from 232 to 24) These targets are just based on simple methods described in technical analysis and may or may not be achieved. Personally I prefer to keep riding the trend based on a simple subjective level like the 10 WEMA or 30 WEMA. disc: invested.
42 Likes
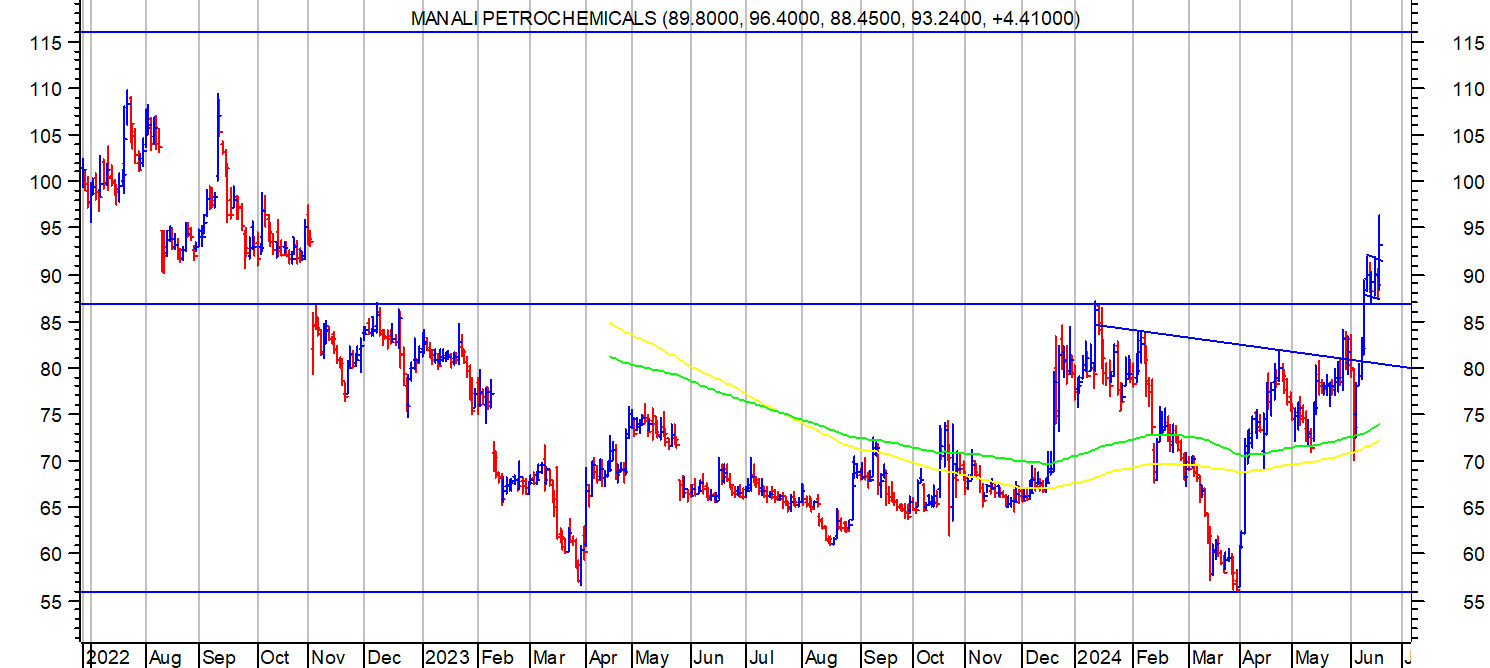
Manali Petro cmp 95. Along with all other chemical stocks this too went down after posting an all time high of 149 in April 2022 and went down to post a low of 56 twice in March 2023 and March 2024. It formed a double bottom at 56 and a confirmation of double bottom breakout was made on breakout and trading above 87. If double bottom plays out, then target can be 118.
Coming to daily chart, there is an inverted head and shoulders marked on right side of chart. A small flag breakout is marked on right side of chart which has happened after double bottom breakout. Another small point to note is a gap down area between 93 to 86 posted in Nov 2022 and which has as of now been negotiated with stock price crossing the gap down area.
Some chemical sector stocks are offering tradeable set ups. Whether this is a resumption of uptrend previously seen, or just a counter trend rally needs to be seen.
Company has applied for Anti dumping duty to govt for one of its products and if govt approves it, it can be a big trigger.
disc: invested as a trading bet. (not a recommendation, please do your own diligence if investment is considered.) Shared because the chart contains multiple technical patterns within same chart.
41 Likes
@hitesh2710
Your last comment of riding based on subjective 10 week EMA and 30 week EMA, if you could elaborate…Do you mean that once the 10 week EMA is breached , you start selling amd by the time it reachea 30 week EMA, you would have sold off all your quantity of that particular stock?
3 Likes
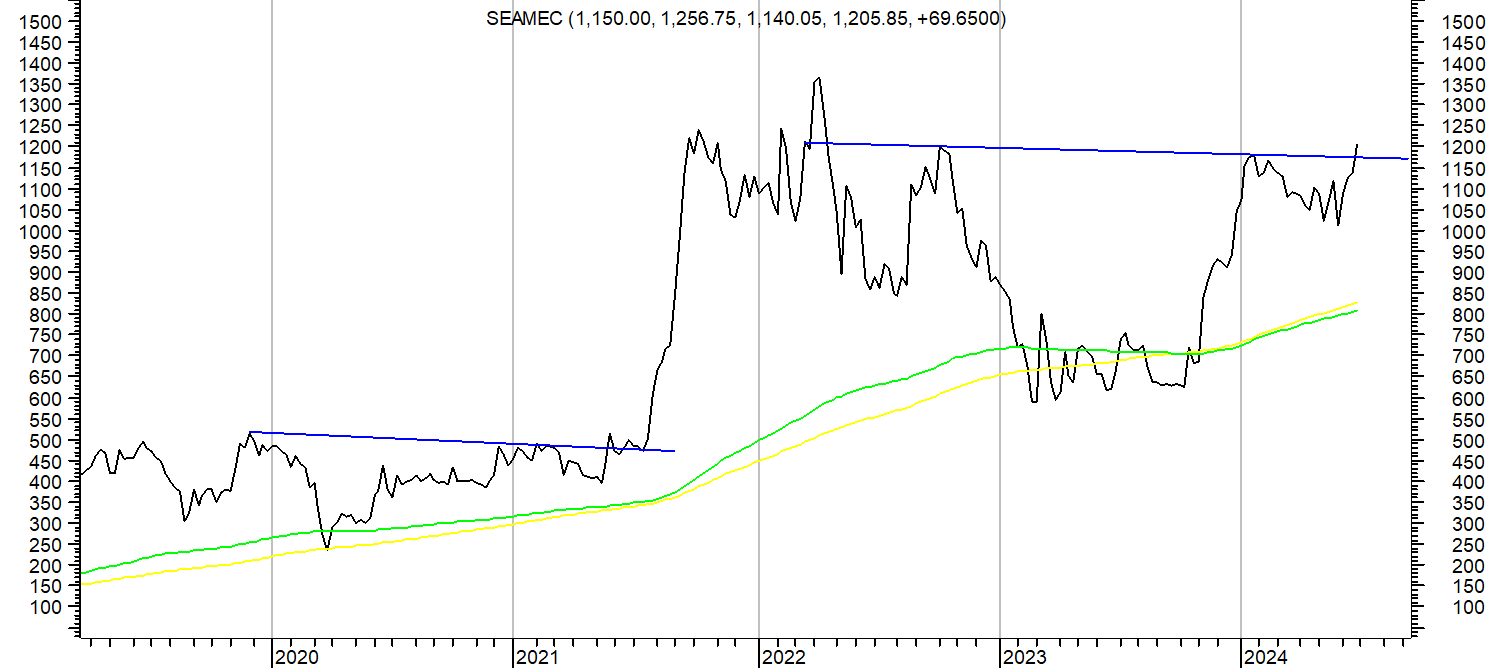
Seamec cmp 1205. Inverted head and shoulders pattern on weekly chart. A successful breakout needs close and consolidation above 1200-1250 kind of levels, and if pattern is successful, target can be 1800.
Also note another similar pattern marked on left side of chart which had played out successfully.
Not tracking it fundamentally. disc: no positions, but on watchlist.
23 Likes