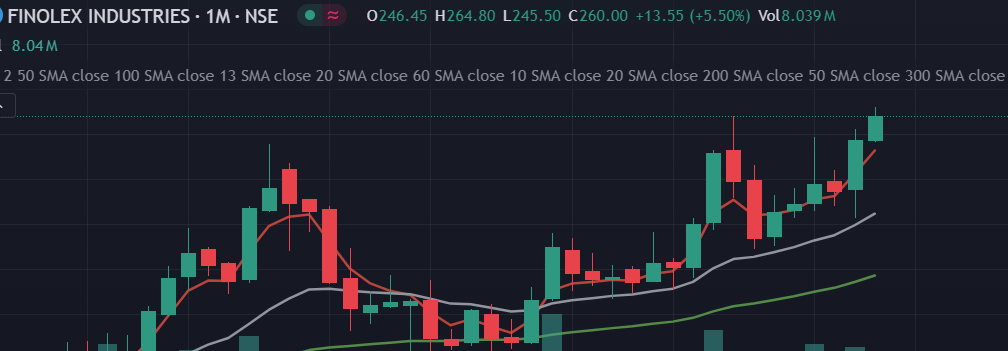
FINOLEX INDS looks good
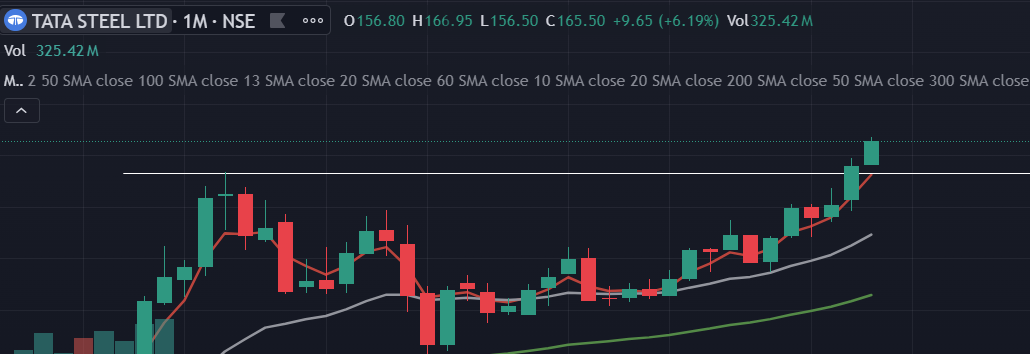
TATASTEEL looks good
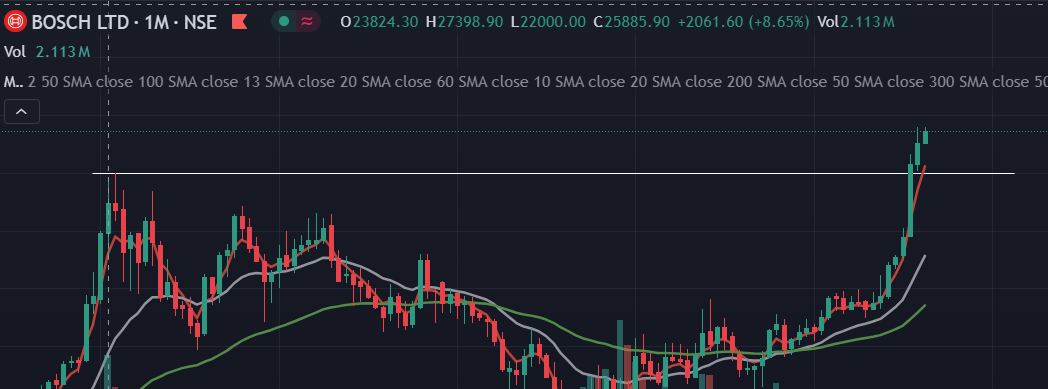
BOSCH
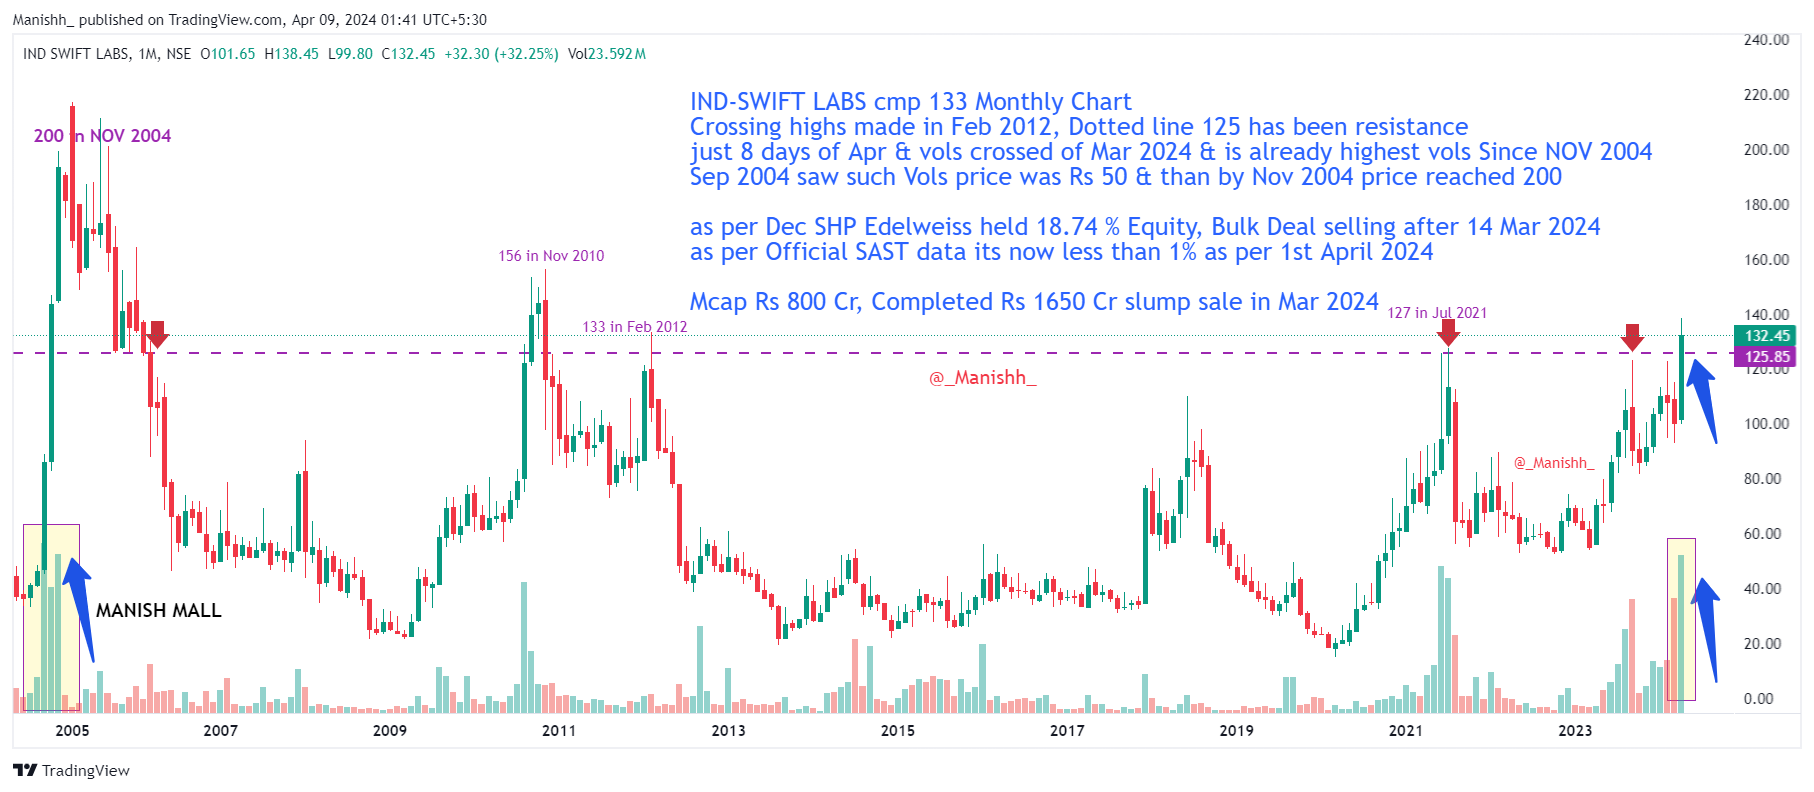
IND-SWIFT LABS cmp 133 Monthly Chart
Crossing highs made in Feb 2012, Dotted line 125 has been resistance
just 8 days of Apr & vols crossed of Mar 2024 & is already highest vols Since NOV 2004
Sep 2004 saw such Vols price was Rs 50 & than by Nov 2004 price reached 200
as per Dec SHP Edelweiss held 18.74 % Equity, Bulk Deal selling after 14 Mar 2024
as per Official SAST data its now less than 1% as per 1st April 2024
Mcap Rs 800 Cr, Completed Rs 1650 Cr slump sale in Mar 2024
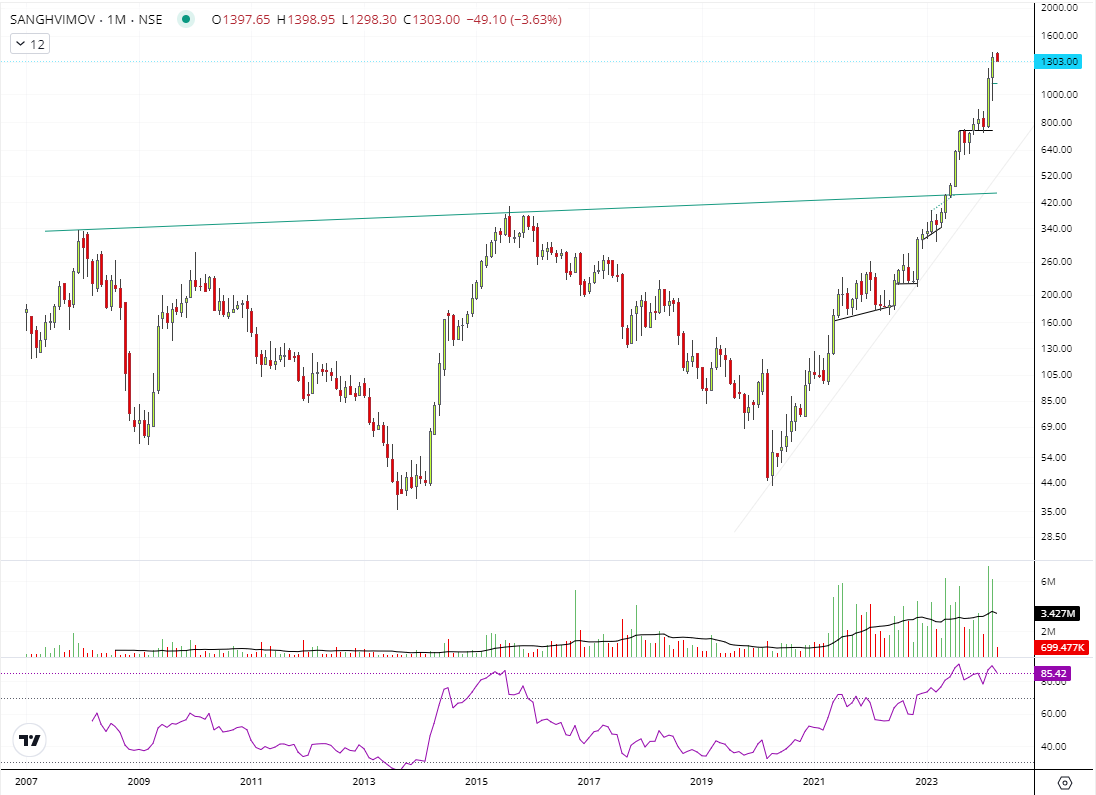
Update on Sanghvi Movers: 370-624-706-850-1099-1398
Has all led to it making an ATH. Monthly chart below
Returns from Dec 2007 Top to 1099, 3.2x in 17 years…
Returns from Aug 2015 Top to 1099, 2.8x in 9 years…
If business performance continues and narratives around wind energy and infra continue, assuming 30-40% drawdowns ( if and when they come), longer term bullish bias still maintained.
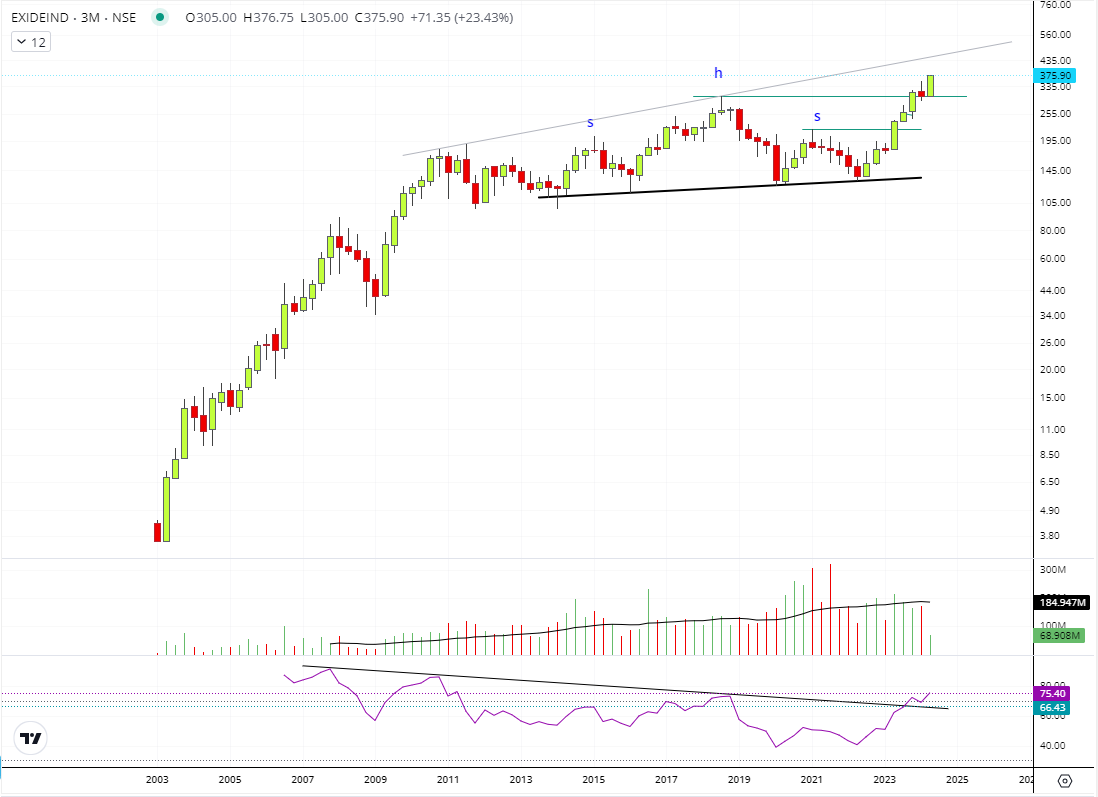
Update: EXIDEINDS 199-294-320-376 ATH
Quarterly Chart below:
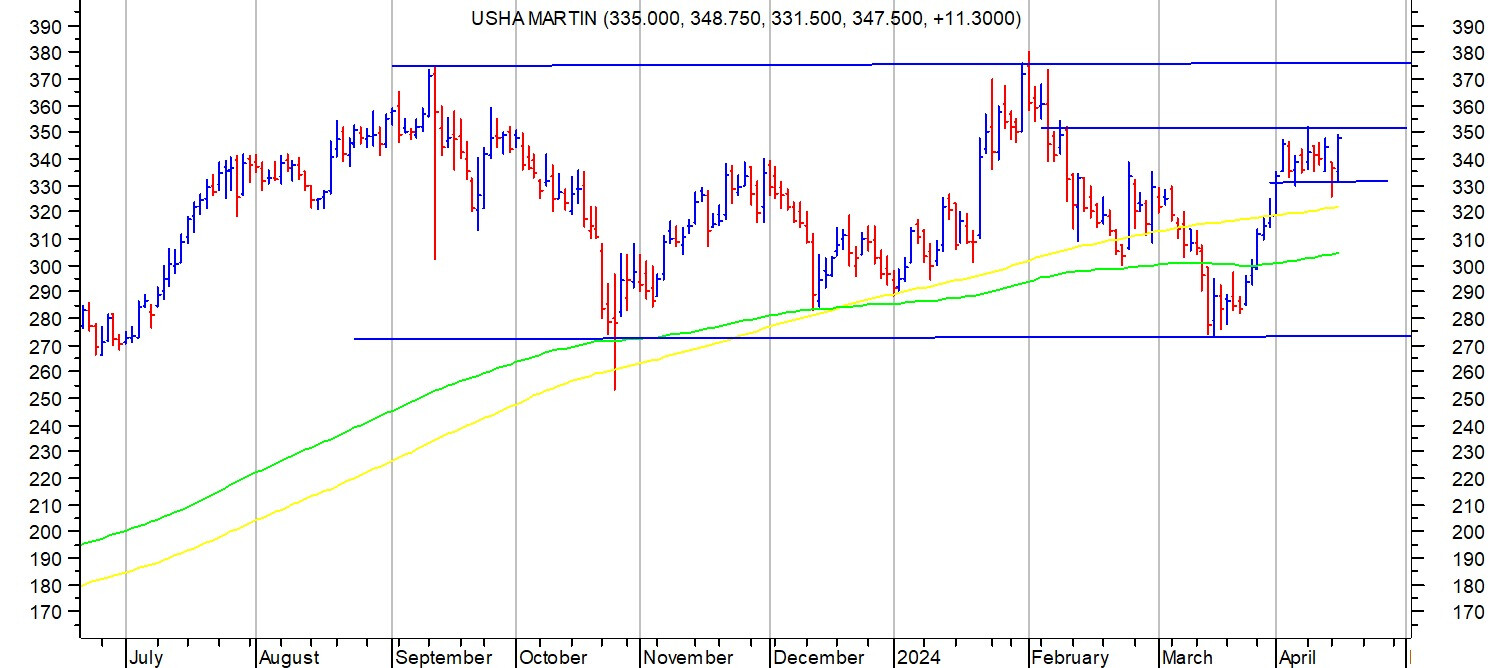
Usha Martin has been stuck in a broad range of 275 to 375 since July 2023. And in a narrower range of 330-351 since past few trading sessions. The chart attached has the above findings marked. A break above 351 today could mark breakout from short term consolidation. However levels of 370-375 need to be crossed convincingly and sustained for a major upmove.
The big overhang in this company is the frequent selling by Prashant Jhawar group. I think it will need a big newsflow/result to overcome this kind of supply.
disc: invested since a long time.
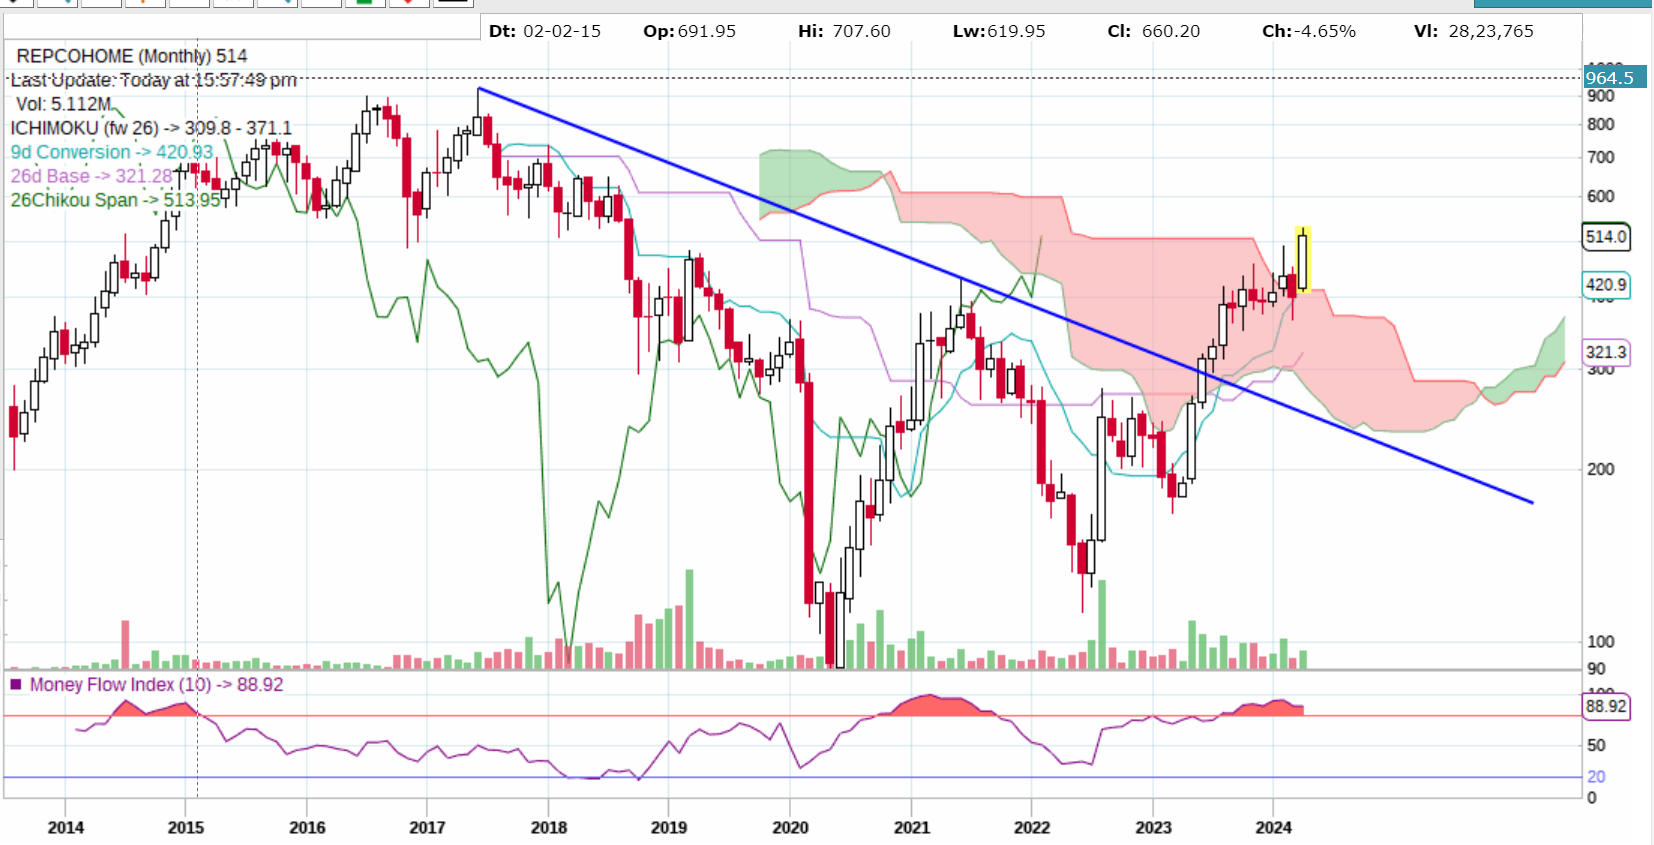
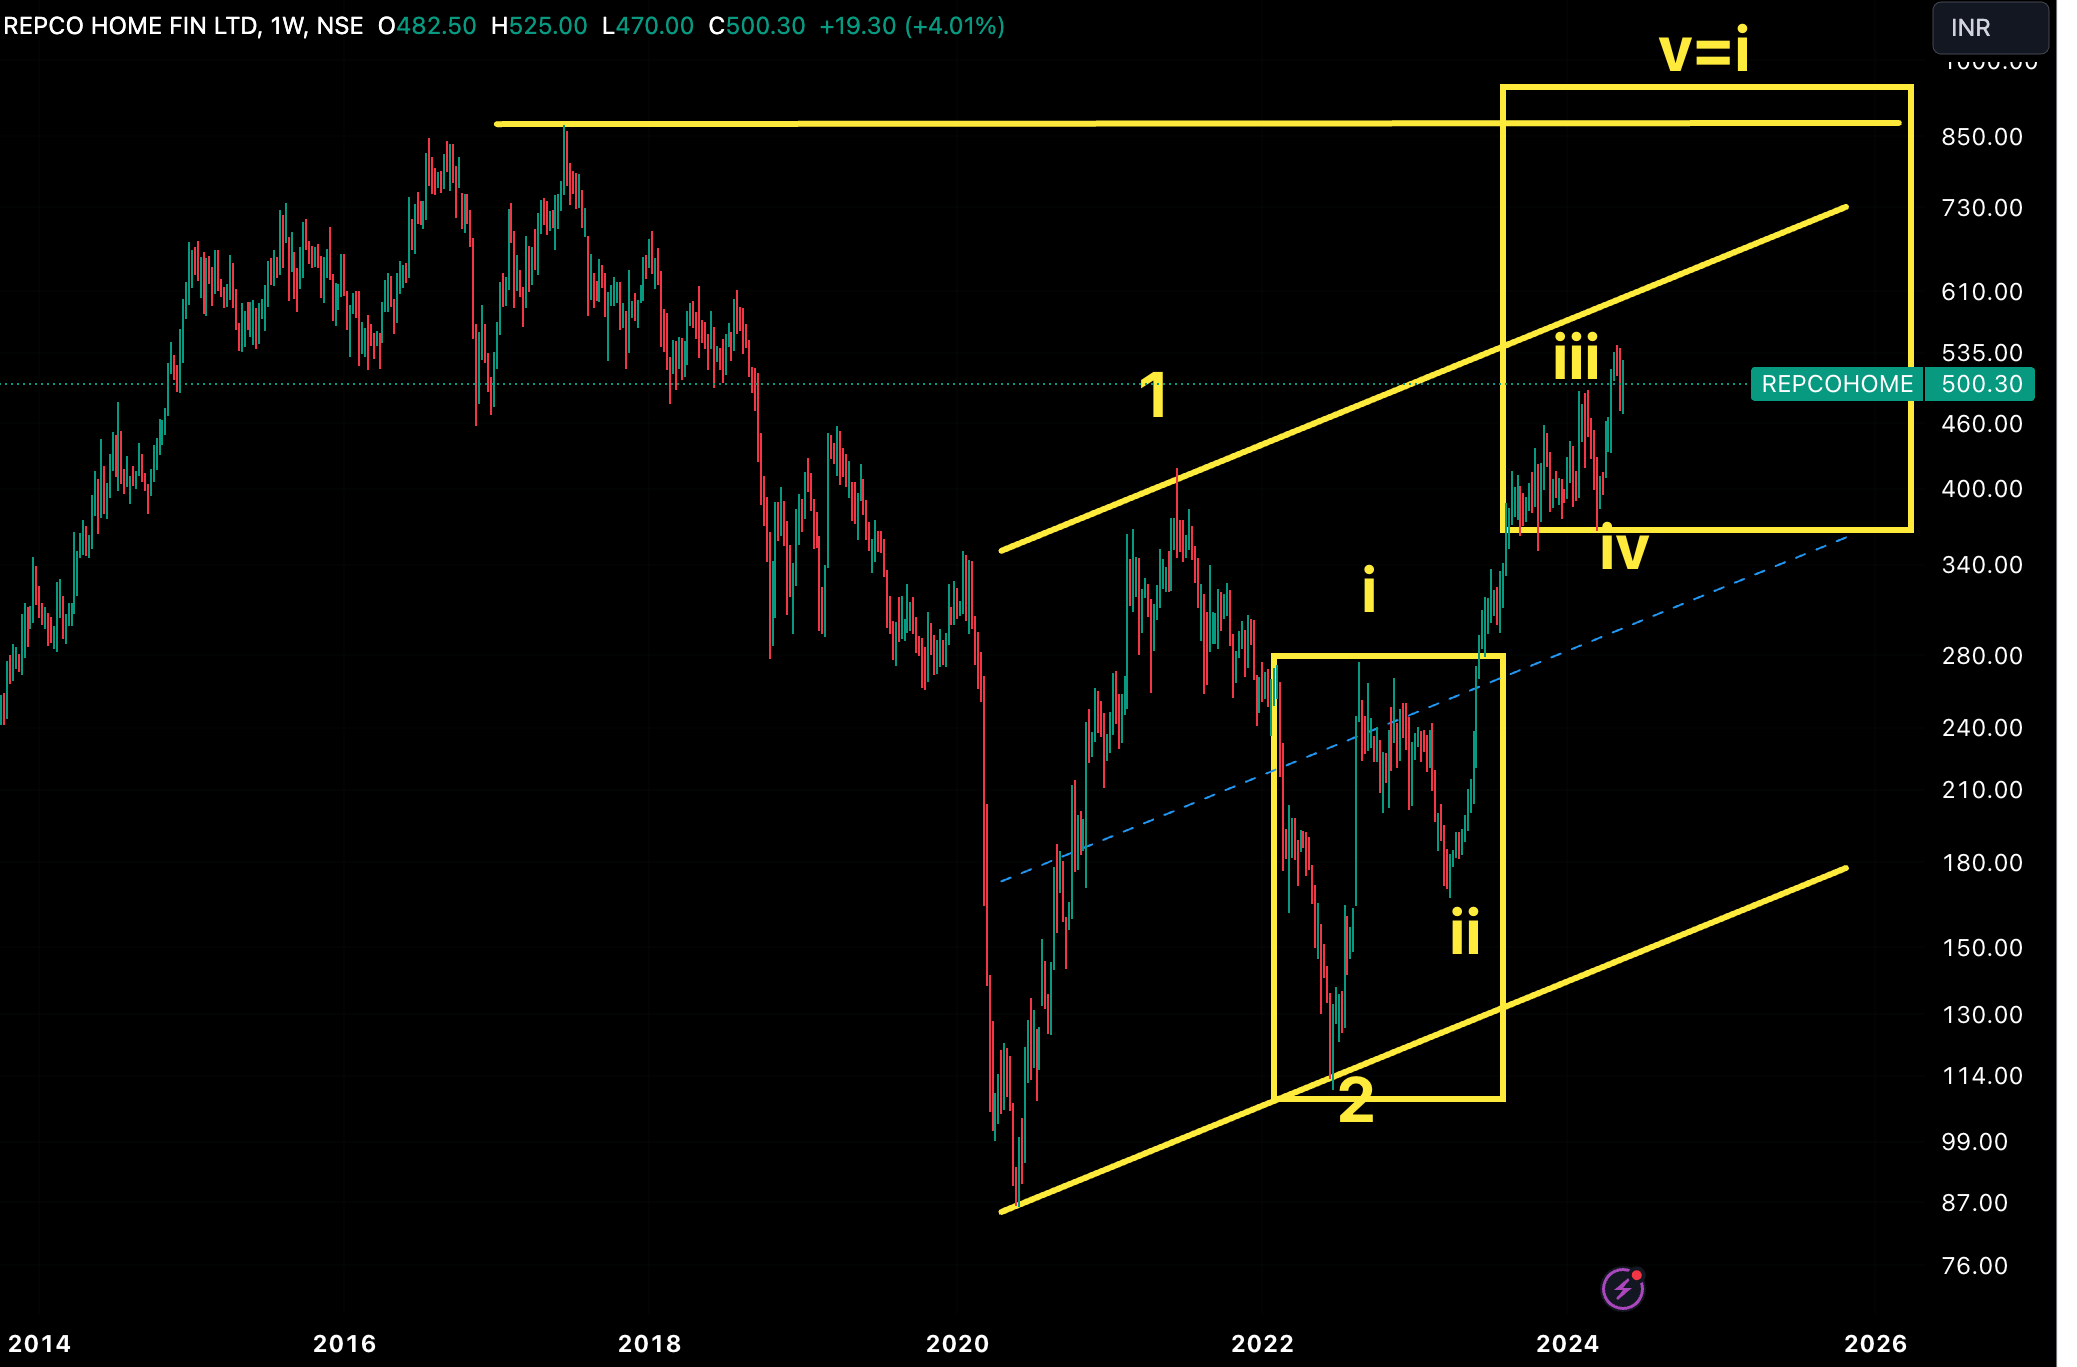
REPCOHOME looks good for the medium term. Stock has broken a huge bearish cloud and the lagging span is free and above previous price action. Fundamentally the company looks undervalued as P/BV is less than 1.5
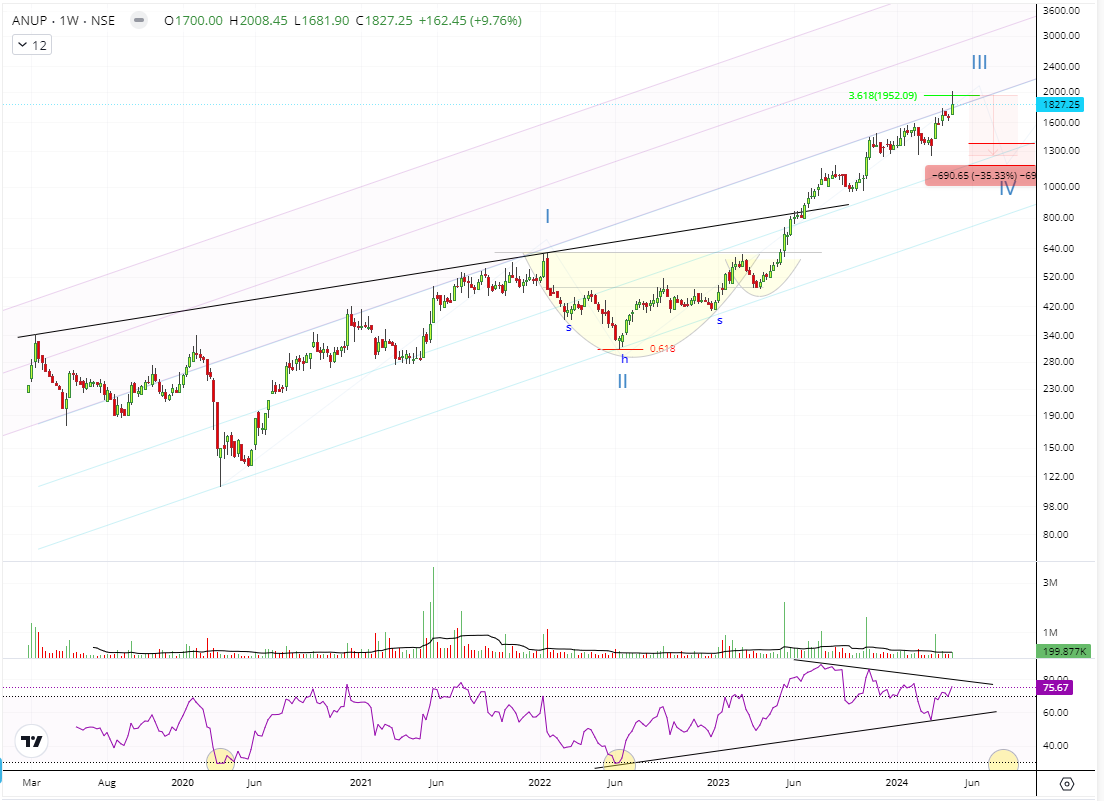
Update on ANUP Engineering: (Post Bonus) - 560-2000 touched ATH today.
( Disc: Maybe wrong in analysis, biased and invested)
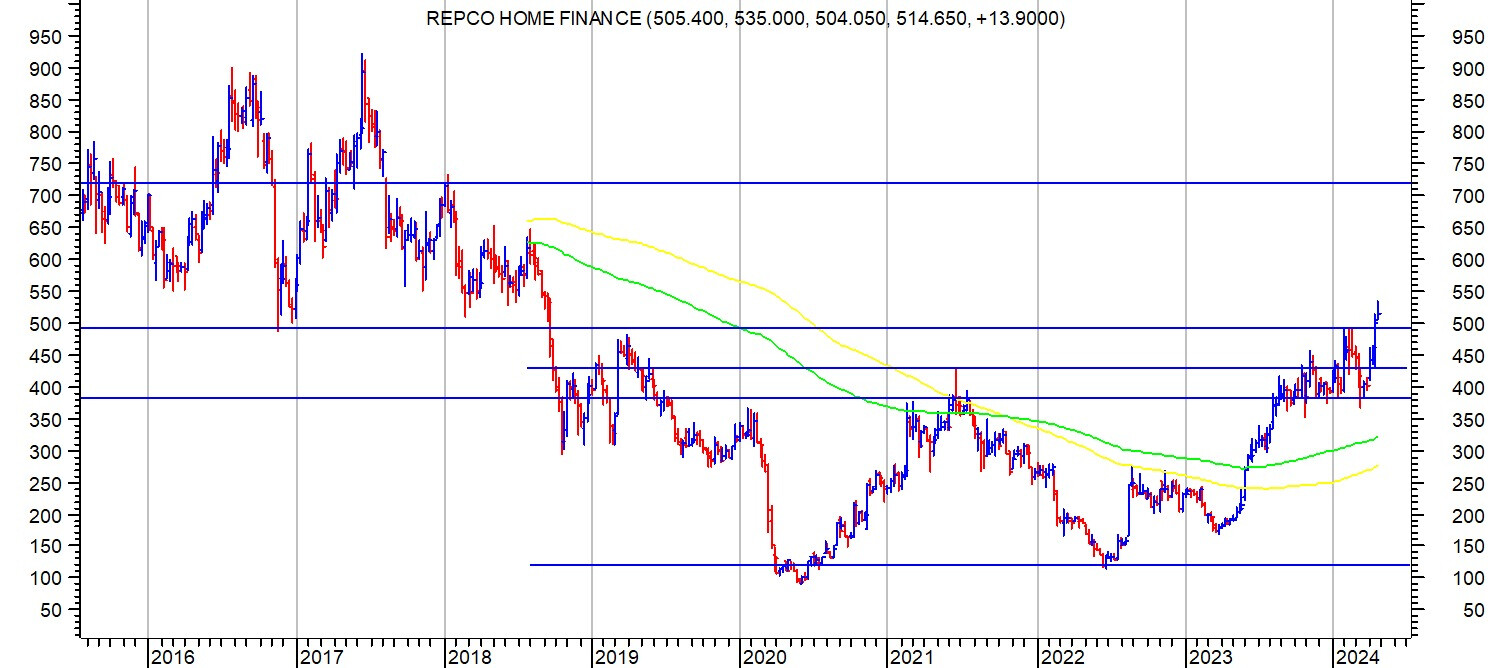
Repco cmp 516. Attached chart shows a W (double bottom formation) extending from 120 on lower end to 430 on higher side. Breakout on upper side happened in August 2023 and since then stock price was in consolidation phase. Recently it broke out above 500 and has been consolidating above that. Fundamentally company does concalls and presentations and one can study the details there. disc: invested as a techno funda bet.
One of the models I often use is multi year breakouts with cheap vauations post breakouts. On conventional parameters, Repco satisfies this criteria.
(This is not a recommendation. Anyone contemplating investment in this company should do their own diligence. )
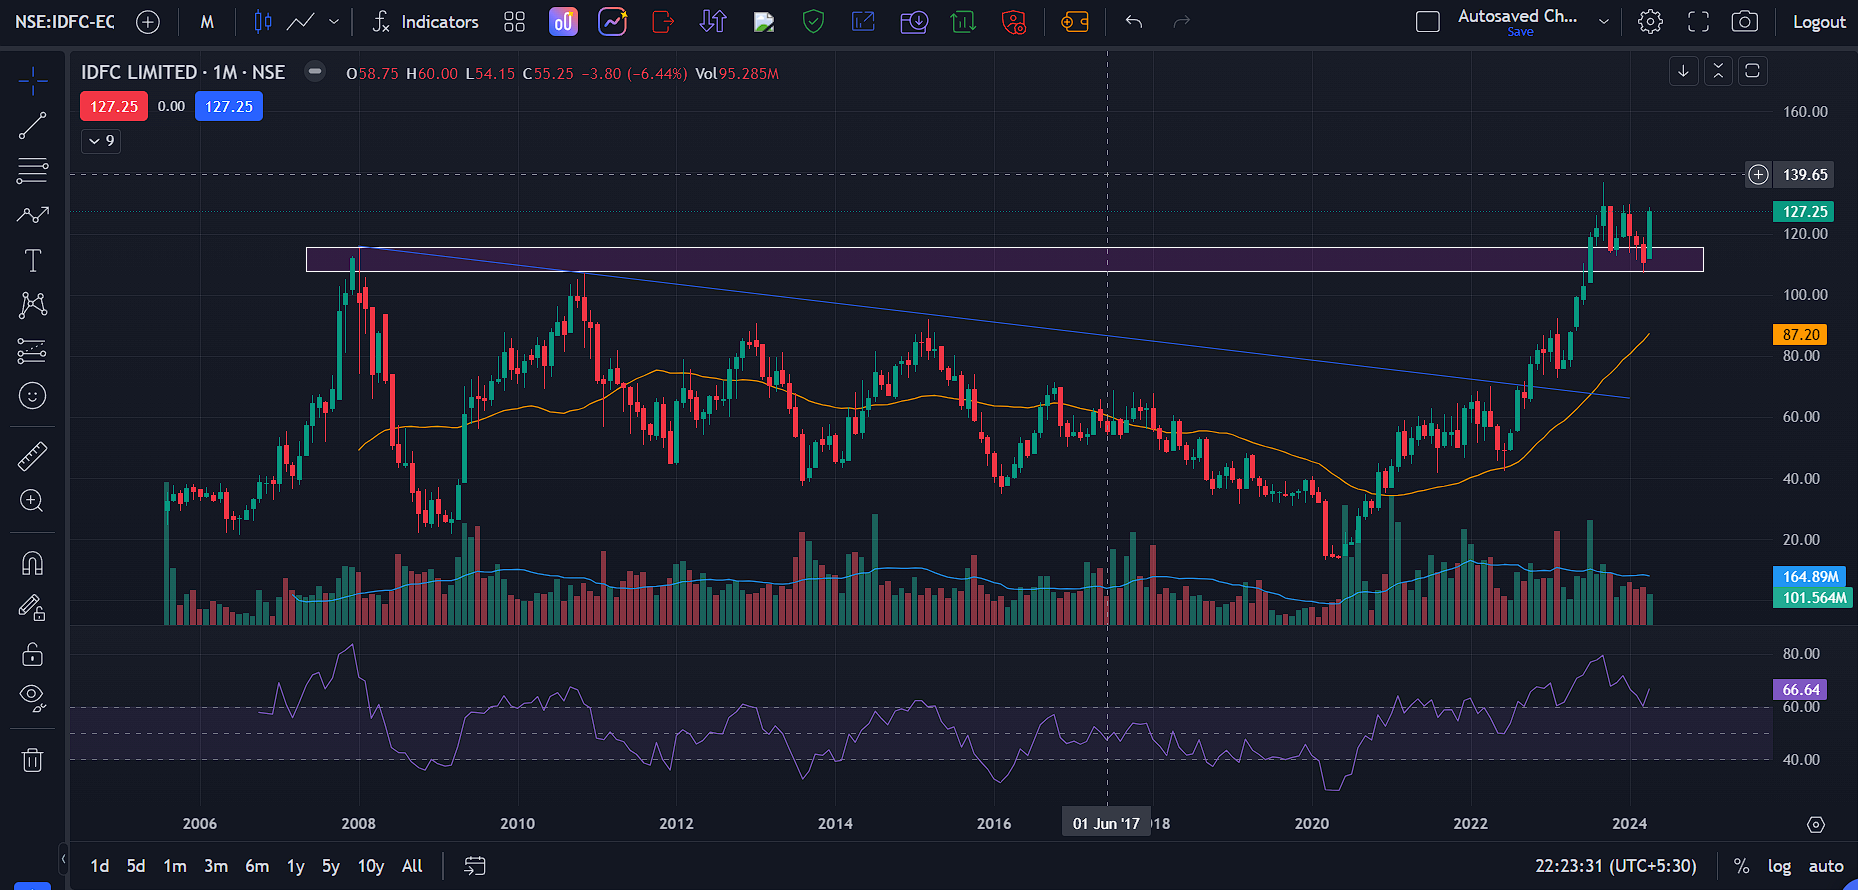
IDFC LTD is looking good after range breakout with good volumes and also the RSI is in bullish zone.
Price has also retested the support zone and it is trading above the 30MA. Chart below:
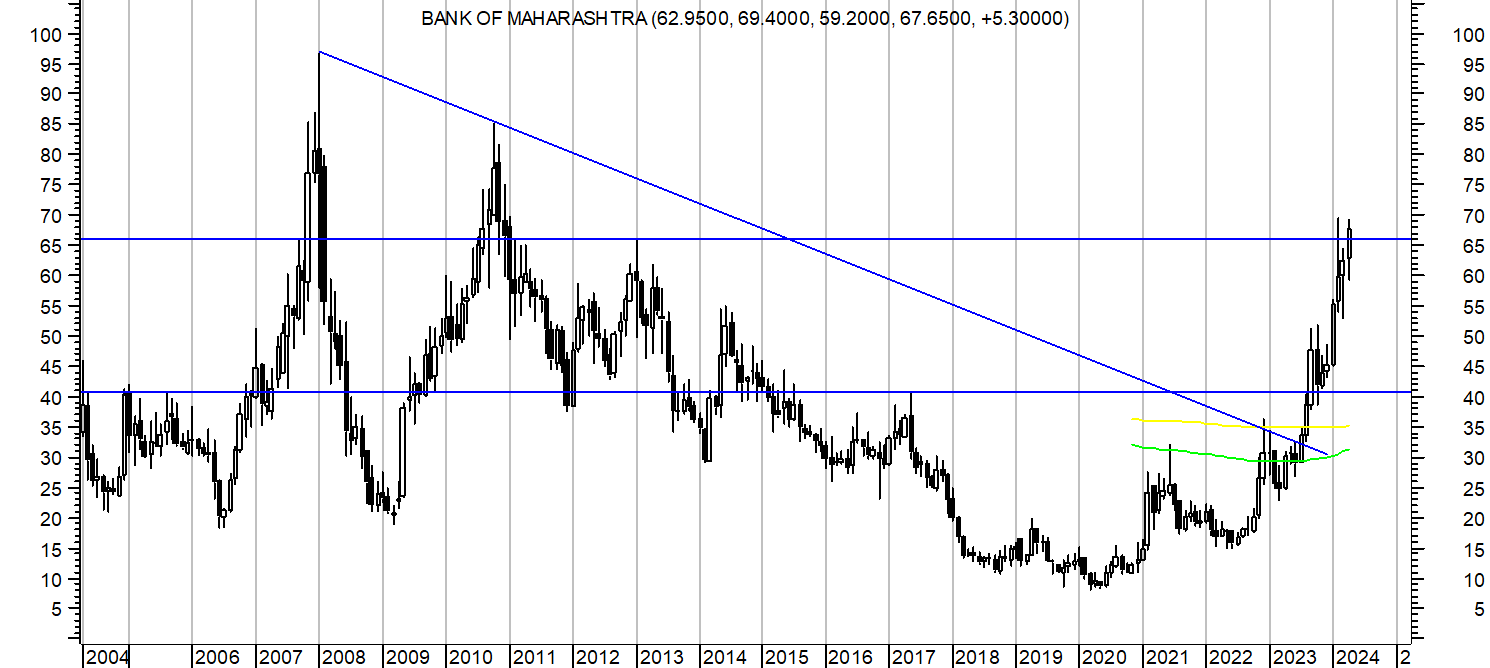
Bank of Maharashtra cmp 67.65. Yesterday it came out with excellent set of numbers for the quarter and year ended 31 March 2024. Presentation is available on exchanges. Concall is available on youtube at https://www.youtube.com/watch?v=UinPll2dWKs.
It has been showing good growth for 15 quarters now with excellent ROA, ROE, PCR, NPA , CASA
parameters. Management commentary remains strong.
Coming to the charts, it crossed important level of 41 in Sep 2023 and went on to hit a high of 69.45 in Feb 2024. In the process it crossed an important 12 year highs level of 66. It went into a consolidation since then for 2 months and on the back of current quarter results, has managed to close above 66 on a weekly basis. A monthly close above 66 this month would be an added bullish confirmation. Resistance at higher levels are at 85 and 97 which are previous major peaks.
disc: invested as a techno funda bet. Not a recommendation. Shared as an example of a techno funda set up.
Dear @hitesh2710 bhai,
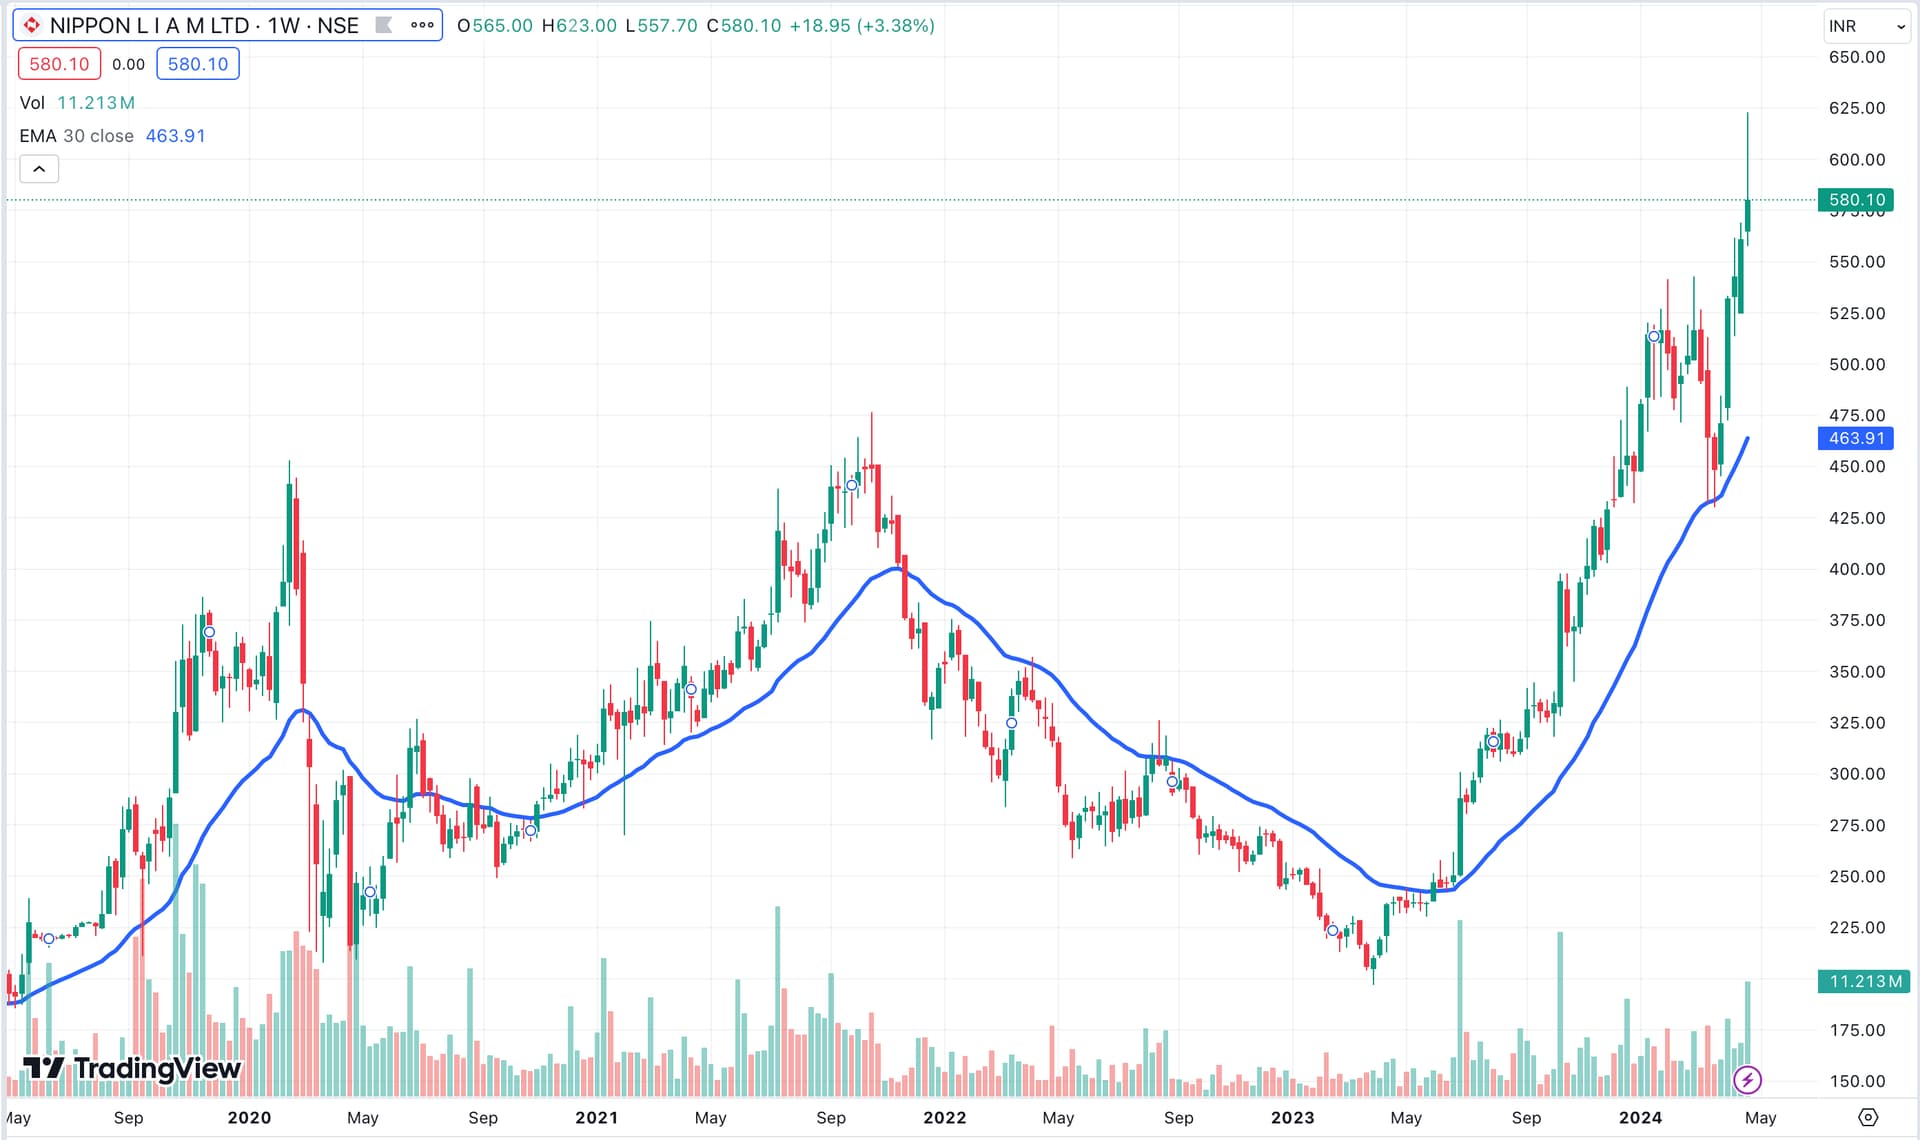
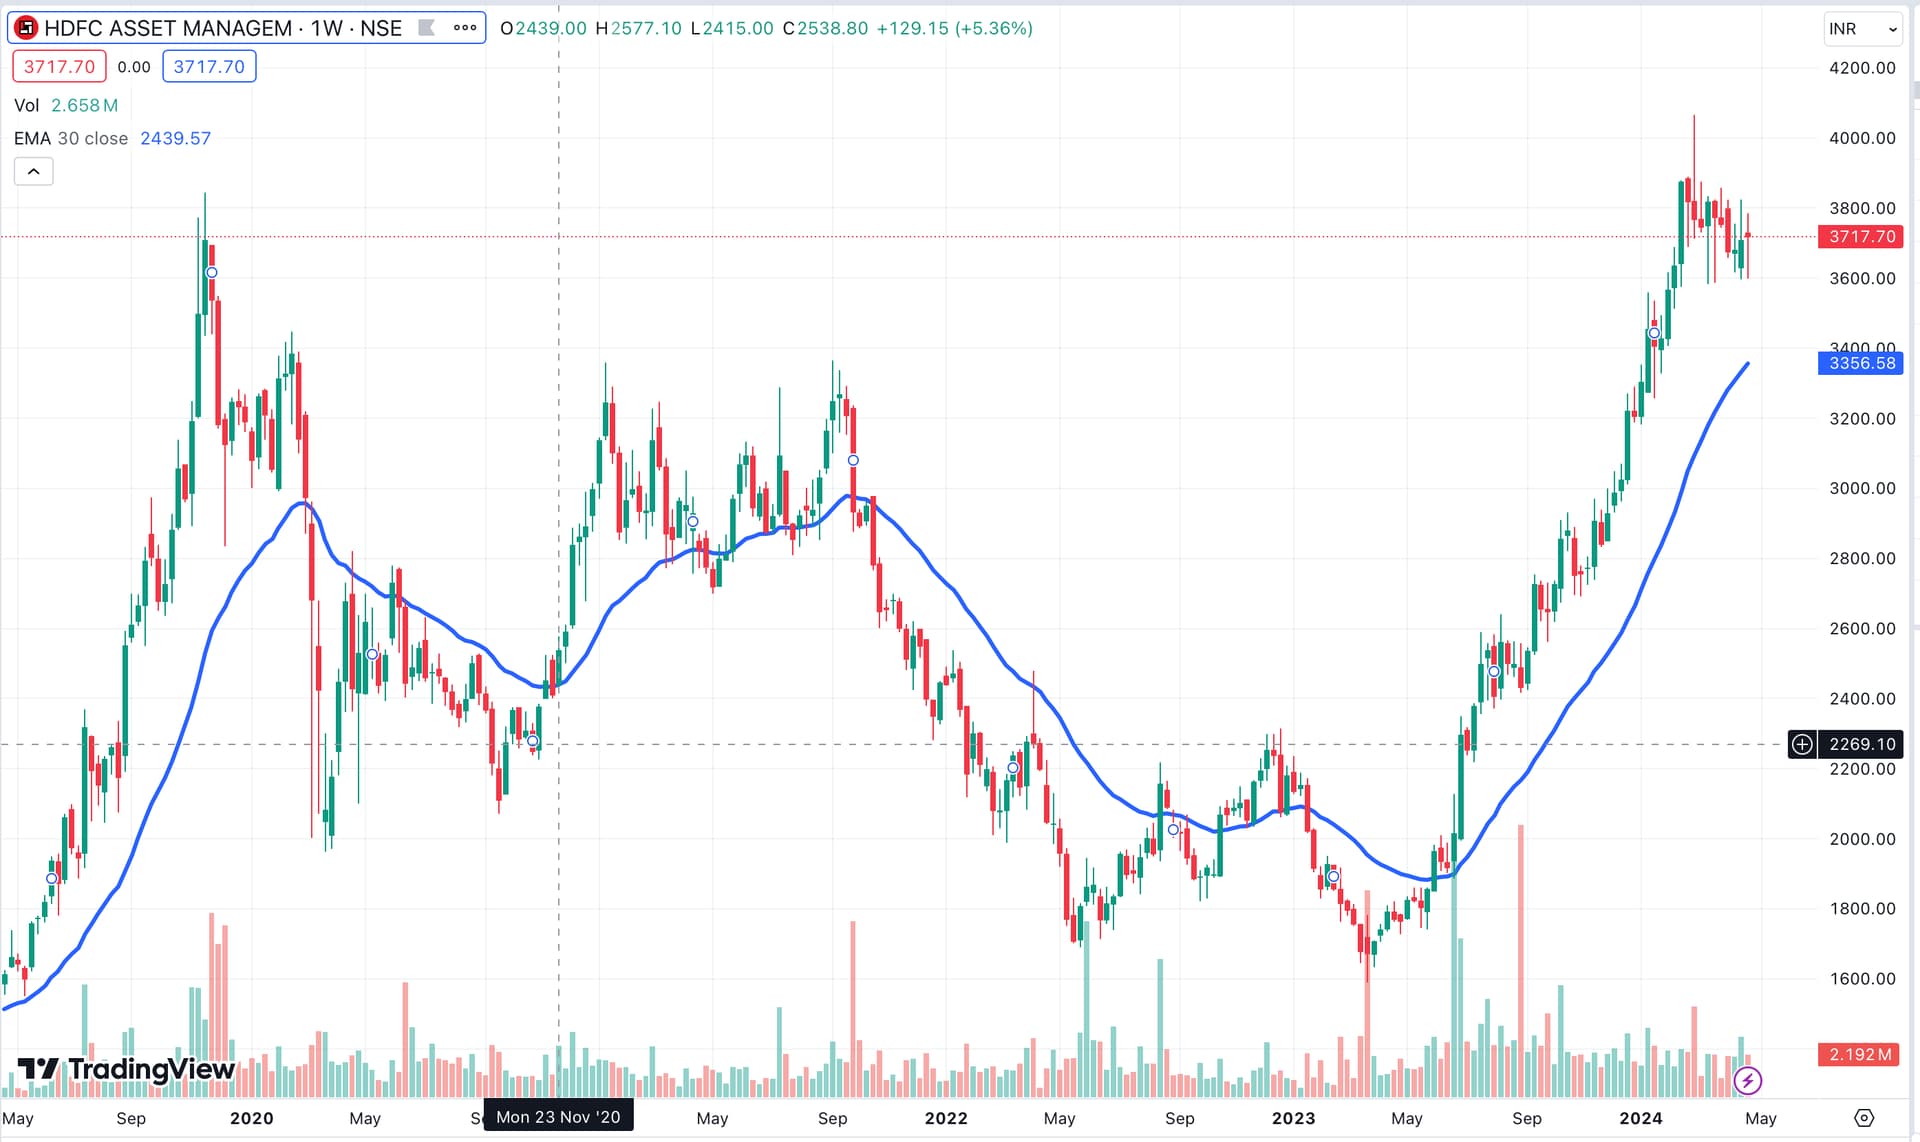
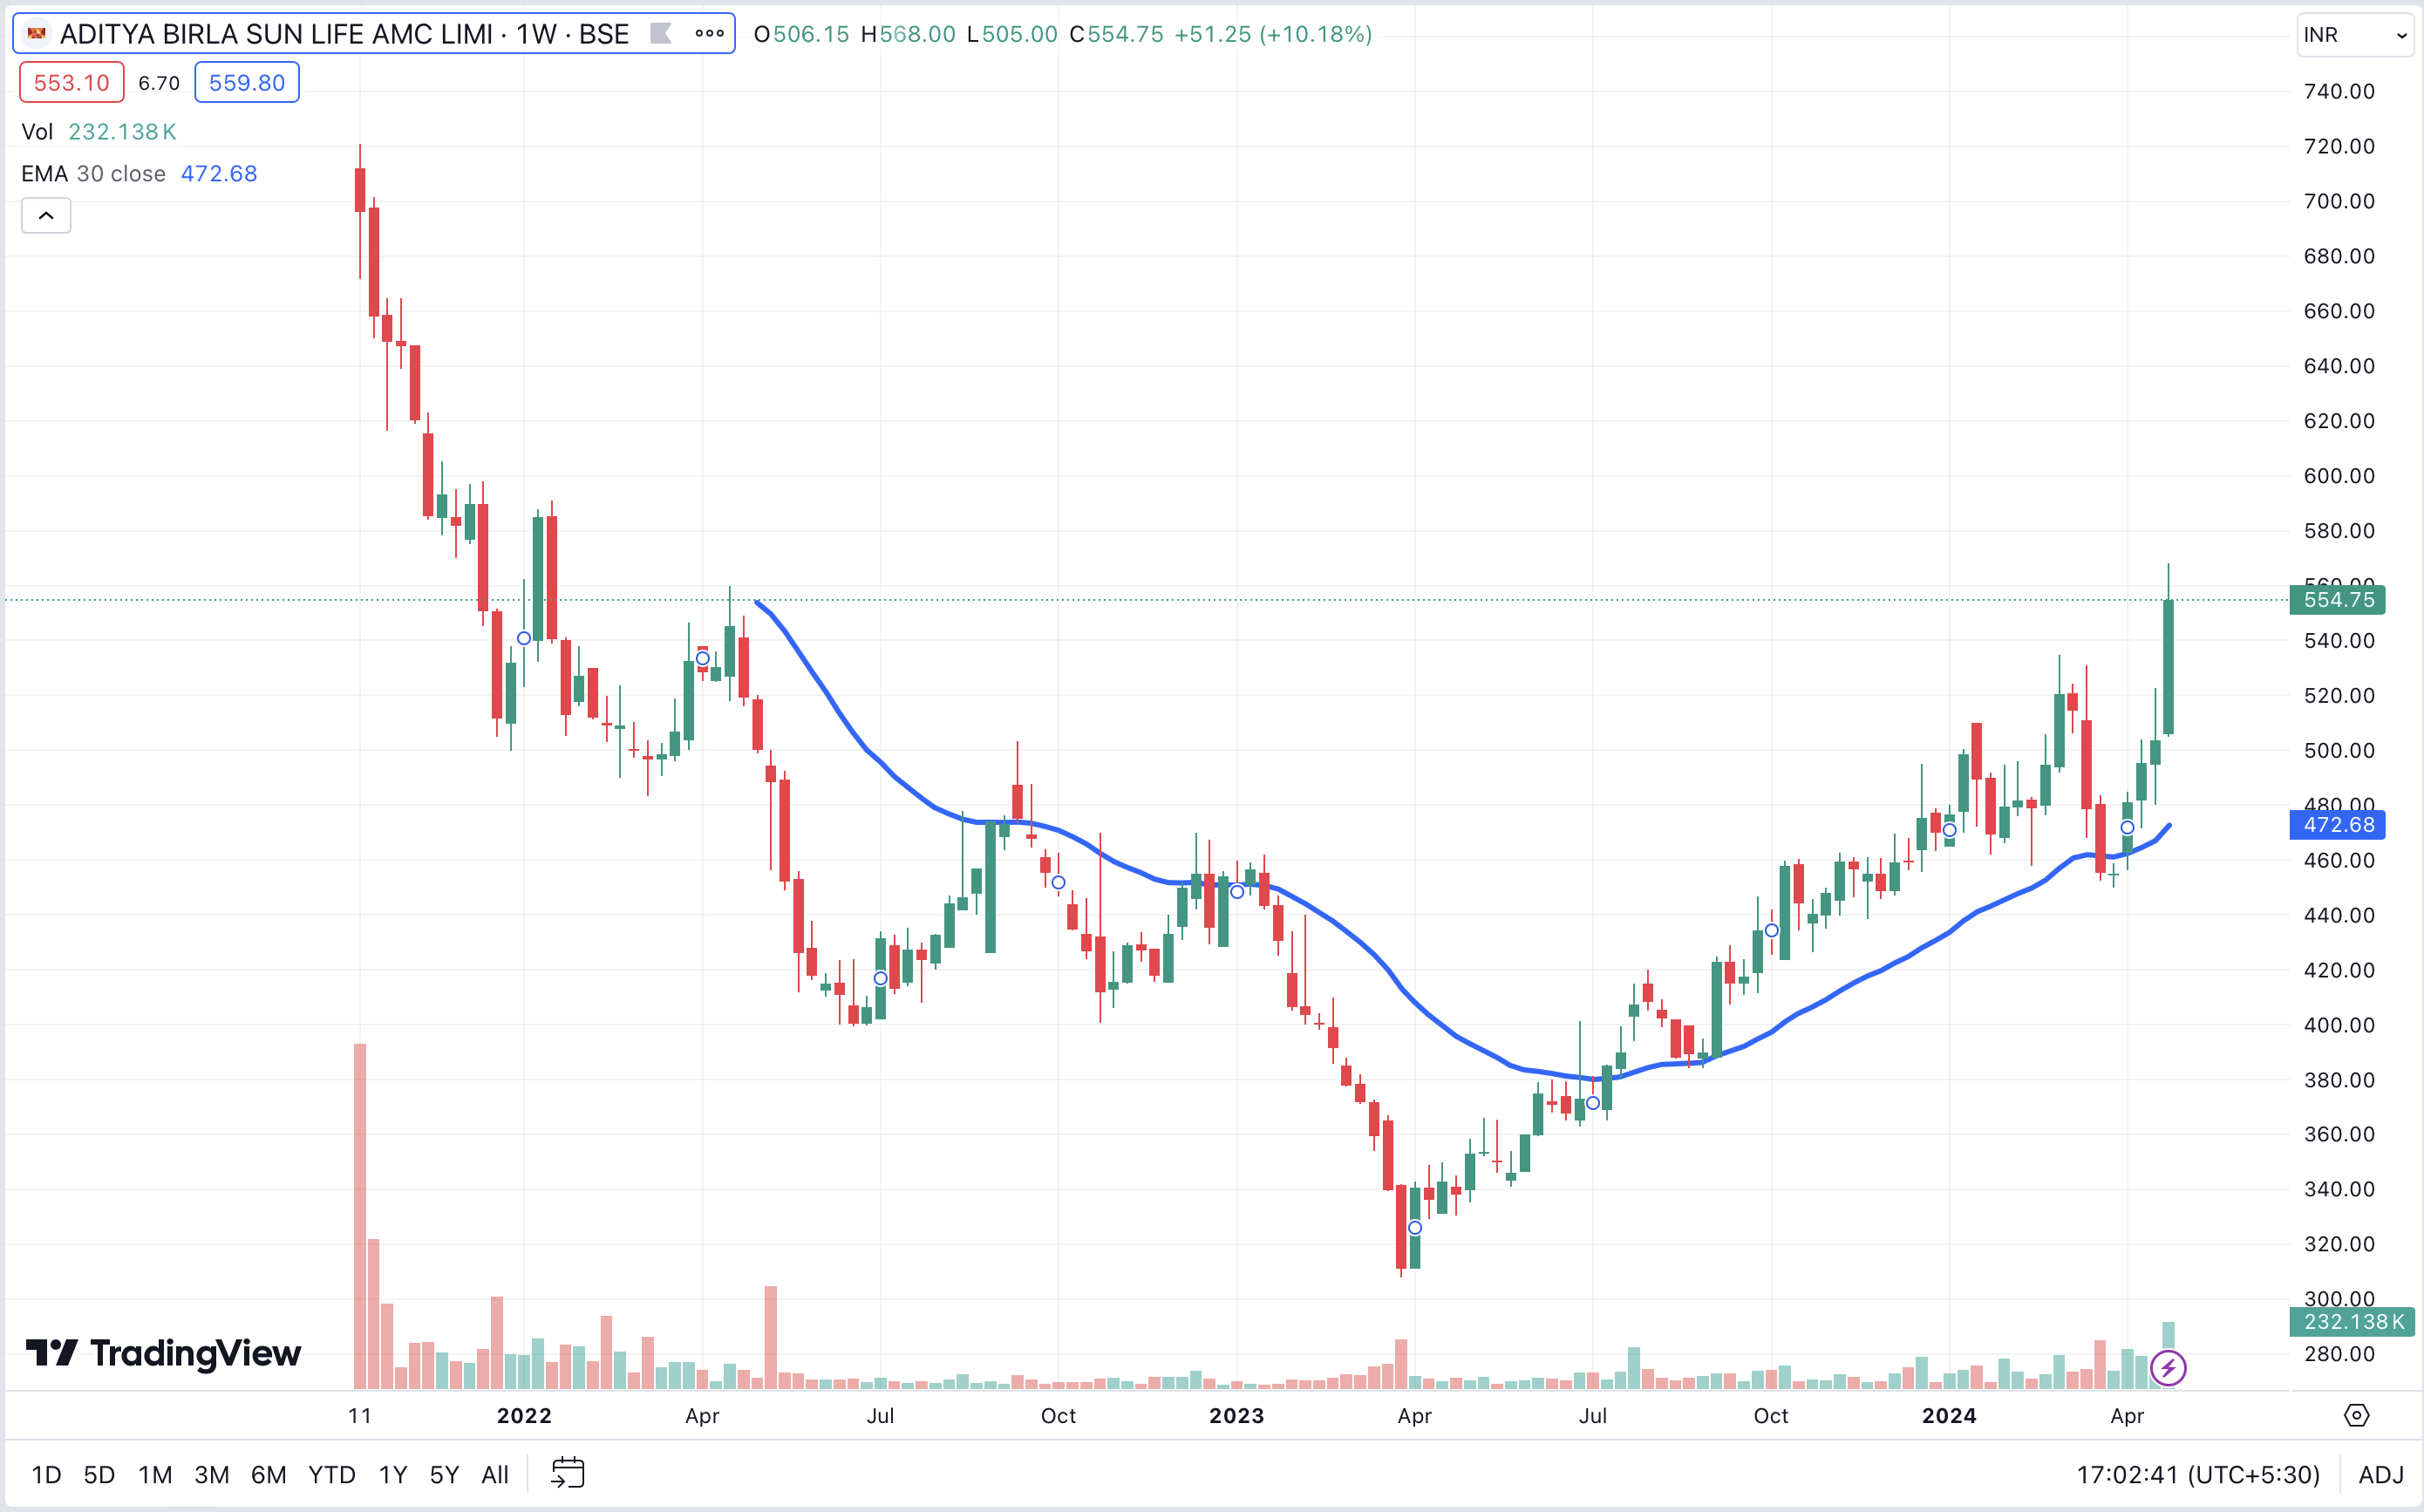
I am new to technicals & still learning. Recently noticed that all the AMCs are breaking out with large volumes & yearly highs.
Fundamentally also, the results have been outstanding & the companies are still between 20-40 PE (HDFC AMC - 40 PE, Nippon - 33 PE, Aditya Birla Sunlife AMC - 20 PE). The clampdown on TERs also seems to be behind us now.
Also, on the charts, they seem to have recently broken out of Cup & Handle & W formations. Looking for thoughts (& corrections) from the experienced investors on the forum
ABSL AMC is also making an inverse head & shoulders pattern around this region.
Fundamentally also, AMCs are getting highest ever AUM & SIP inflows in this bull market.
Does this indicate a sector rotation, with still reasonable valuations? Or am I missing something?
Disc. : Invested in HDFC AMC from lower levels. Planning to enter Nippon AMC & Aditya Birla AMC based on above observations.
Charts for your easy reference :
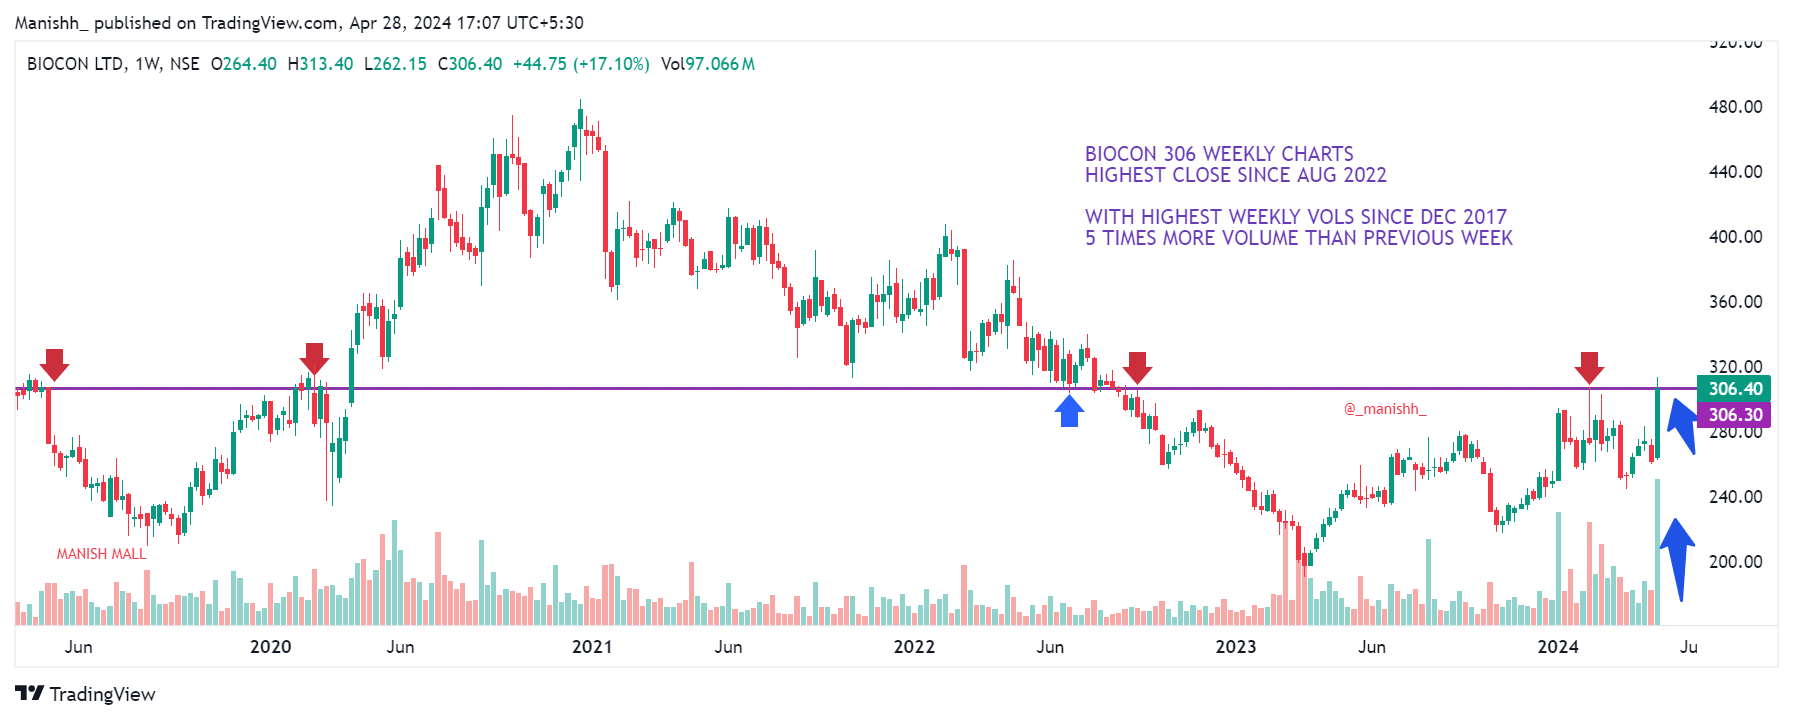
BIOCON 306 WEEKLY CHARTS
HIGHEST CLOSE SINCE AUG 2022
WITH HIGHEST WEEKLY VOLS SINCE DEC 2017
5 TIMES MORE VOLUME THAN PREVIOUS WEEK
290 to 300 has been a Multiple Resistance zone
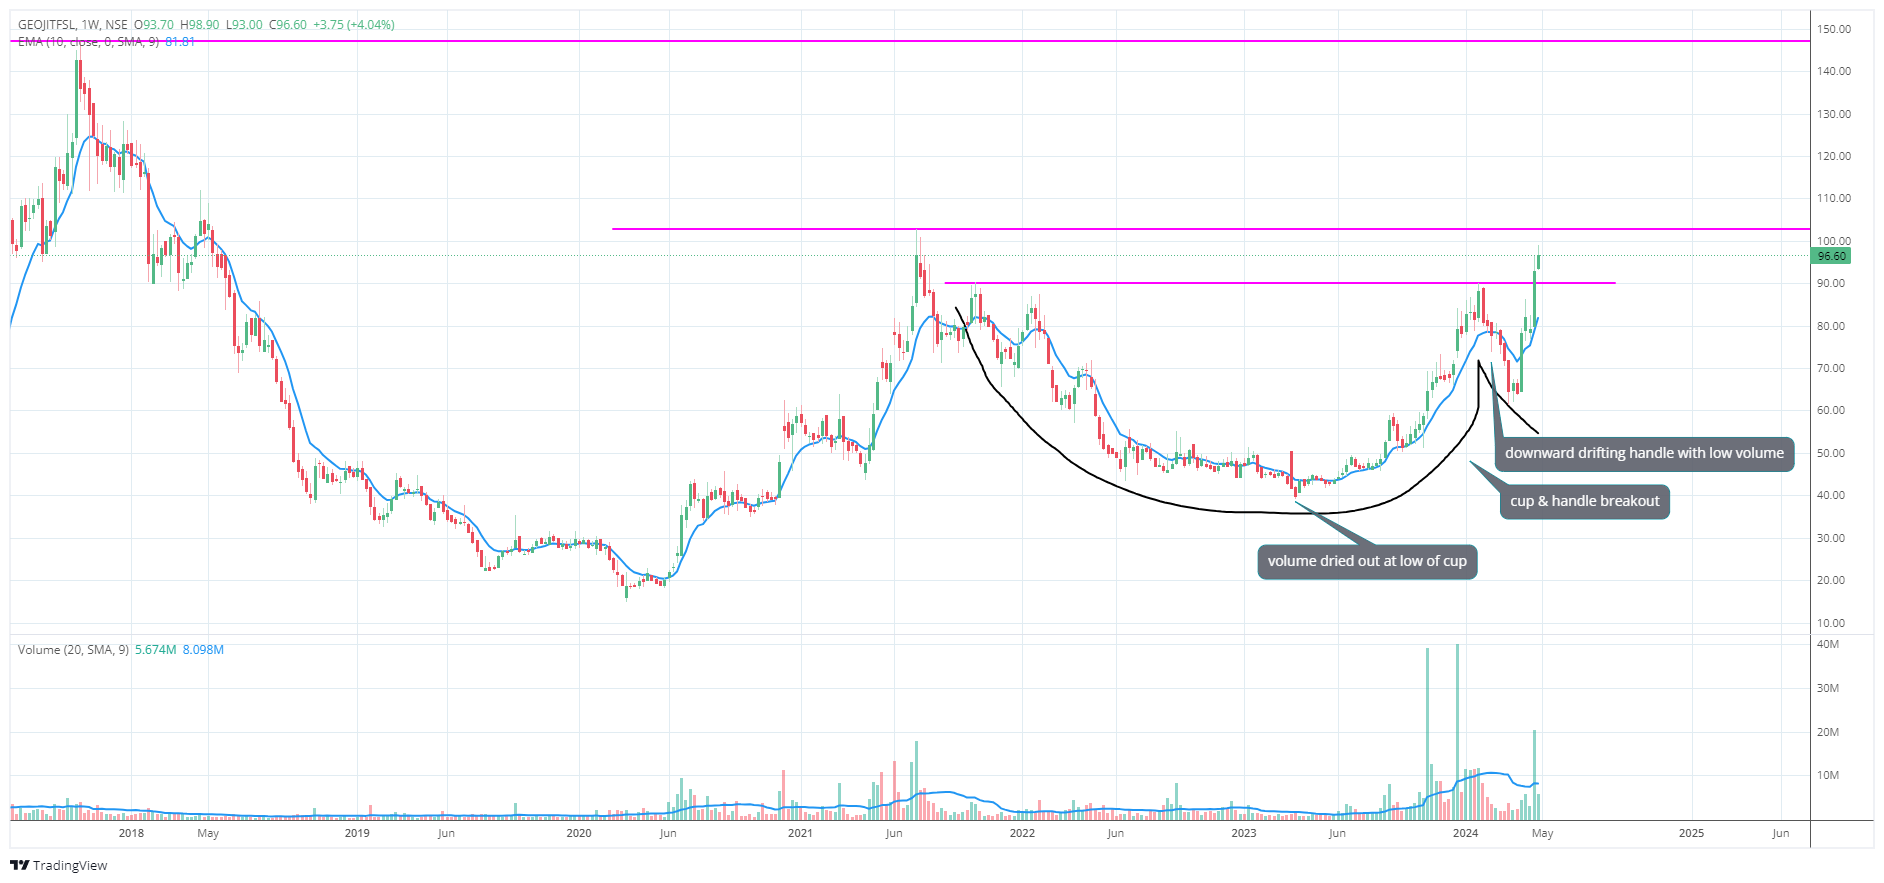
@hitesh2710 sir, I have started learning technicals in conjunction with fundamentals. Geojit financial gave a cup and handle breakout on weekly charts. On fundamental front, the march quarter eps increased by 78% compared to same quarter previous year. Yearly eps also increased by 50%.
Looking for your expert guidance.
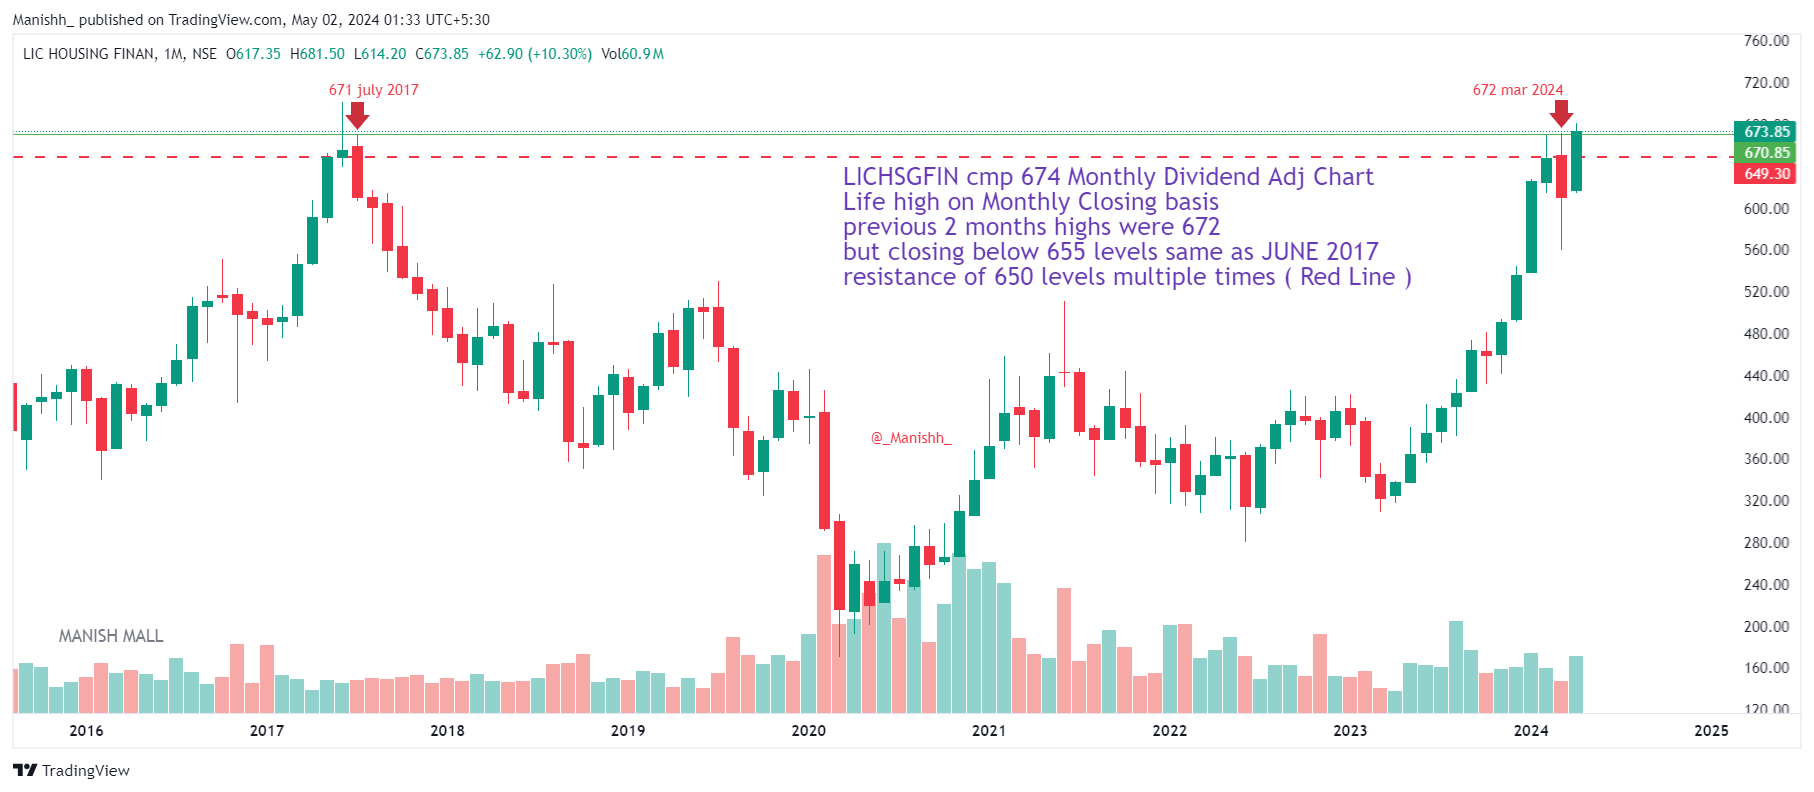
LICHSGFIN cmp 674 Monthly Dividend Adj Chart
Life high on Monthly Closing basis
previous 2 months highs were 672
but closing below 655 levels same as JUNE 2017
resistance of 650 levels multiple times ( Red Line )
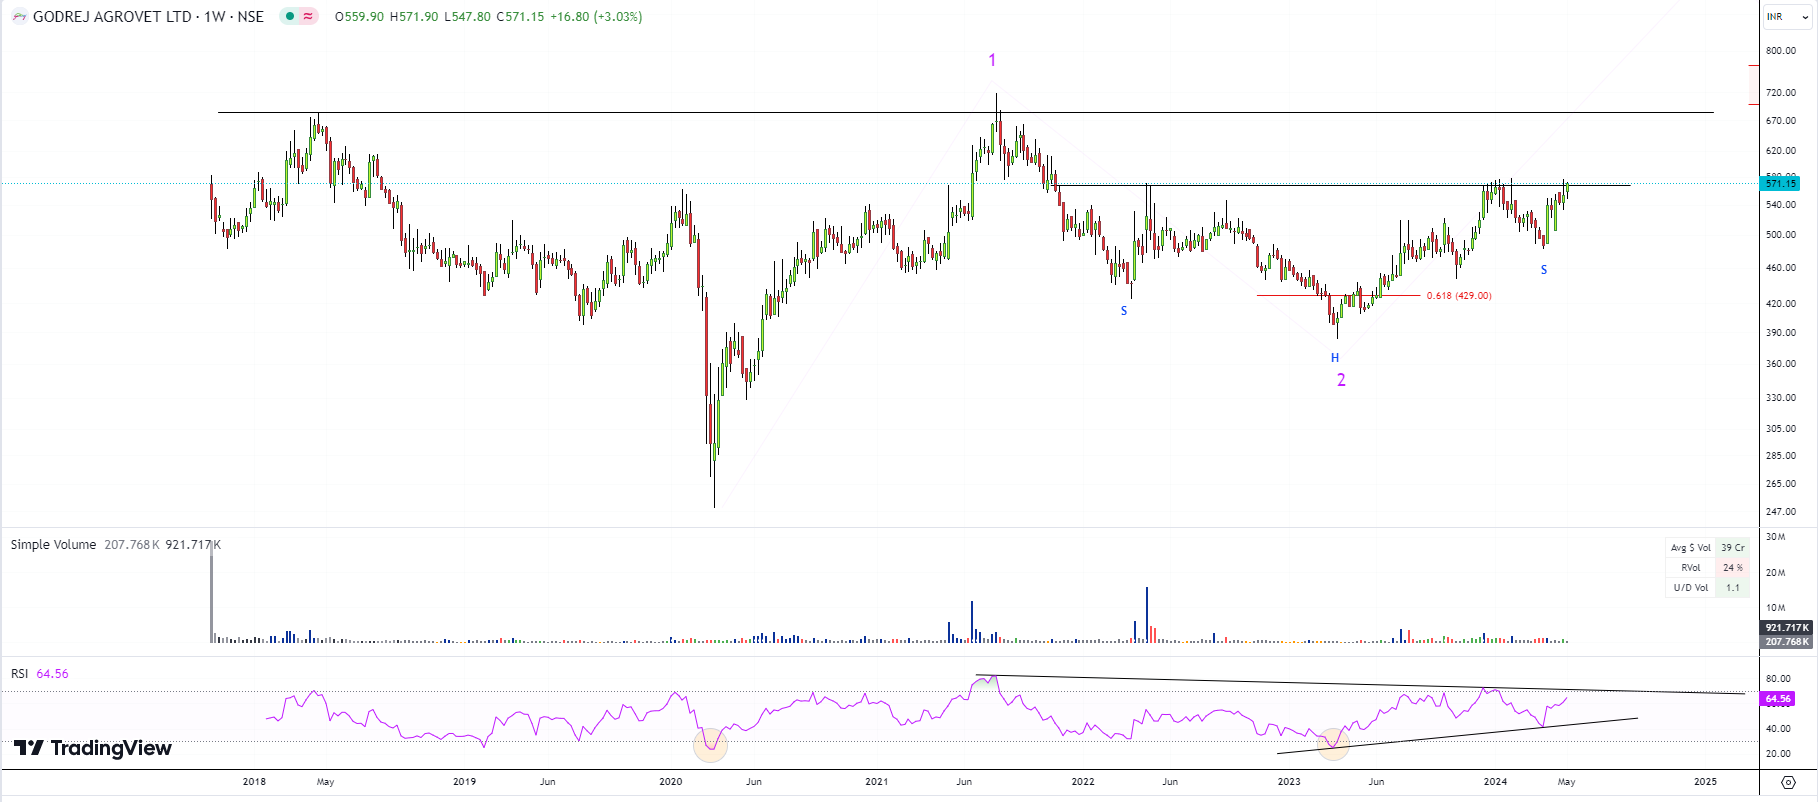
GODREJAGRO - 570 - Weekly Chart,
Breaking out of Inverse H&S can lead stock to previous highs.
Bullish bias ahead.
Finally, after posting solid quarterly numbers and further rating upgrade the stock has managed to reach its previous ATH mark.
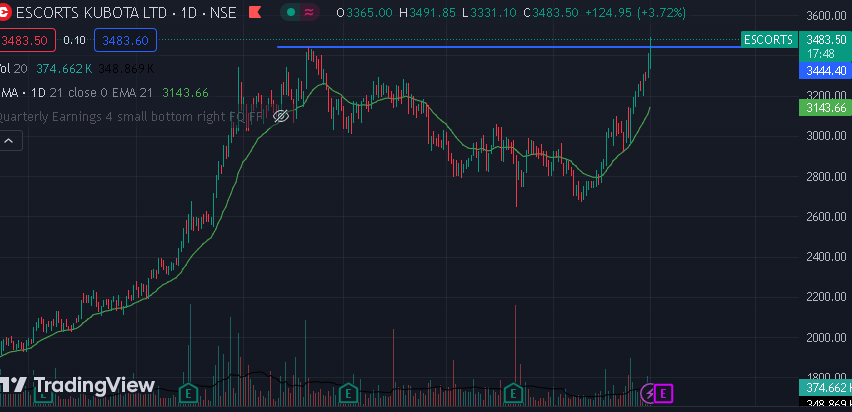
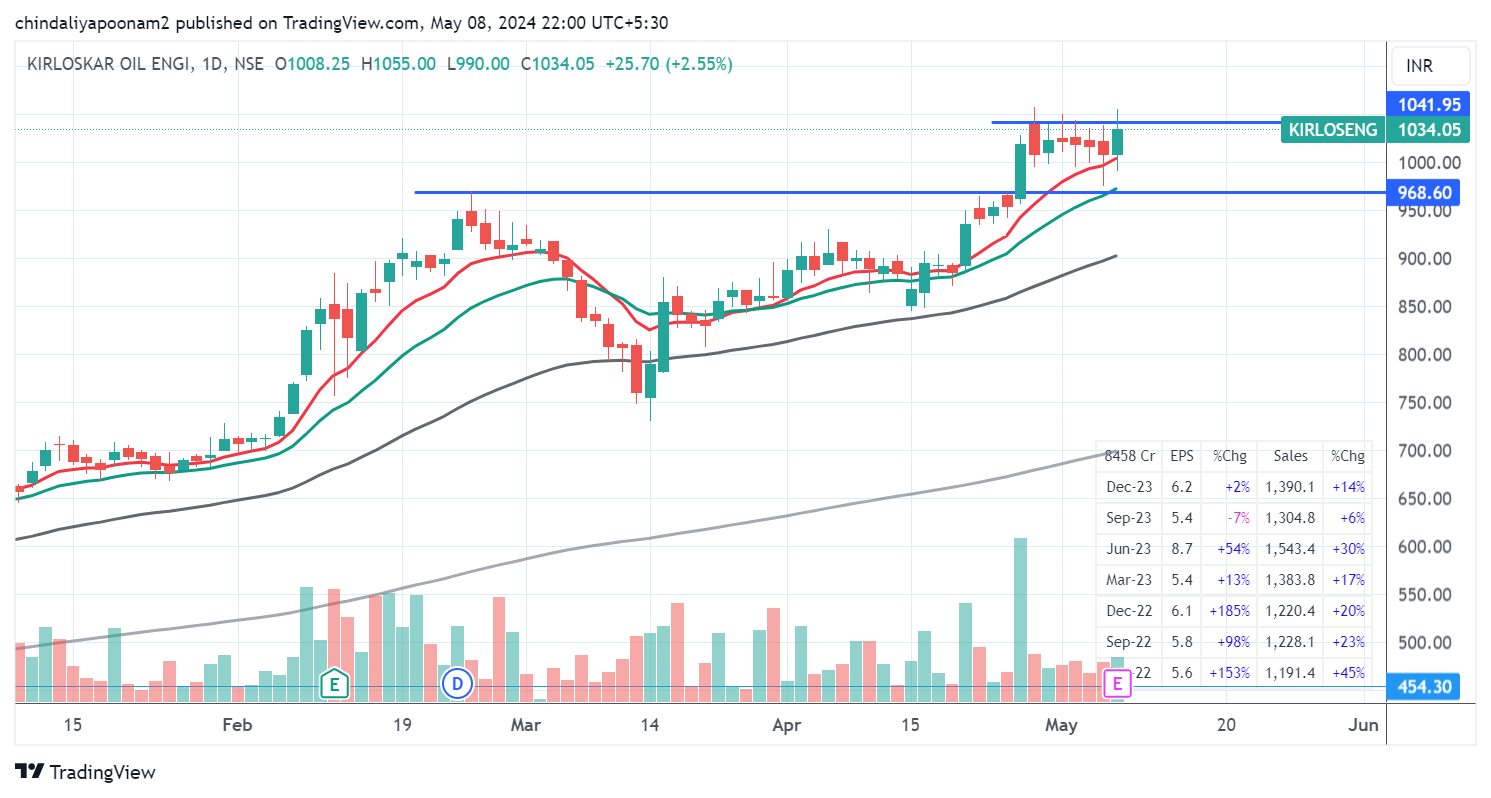
Kirloskar Oil Engine looking good on charts… Stock gave breakout with good volumes, now consolidating near ATH
Repco came out with decent results and growth guidance of around 15-20% disbursement and more than 20% profits for Fy 25. Charts remain the same with the stock price having retested the breakout zone of 480 during recent market turmoil and moving up post results. Valuationwise on conventional parameters it remains cheap. The main trigger in these kind of companies can be emergence of strong growth in numbers. As of now growth is tepid, though there is promise of higher growth in next few years. For those interested in fundamentals of company, concall provides details.