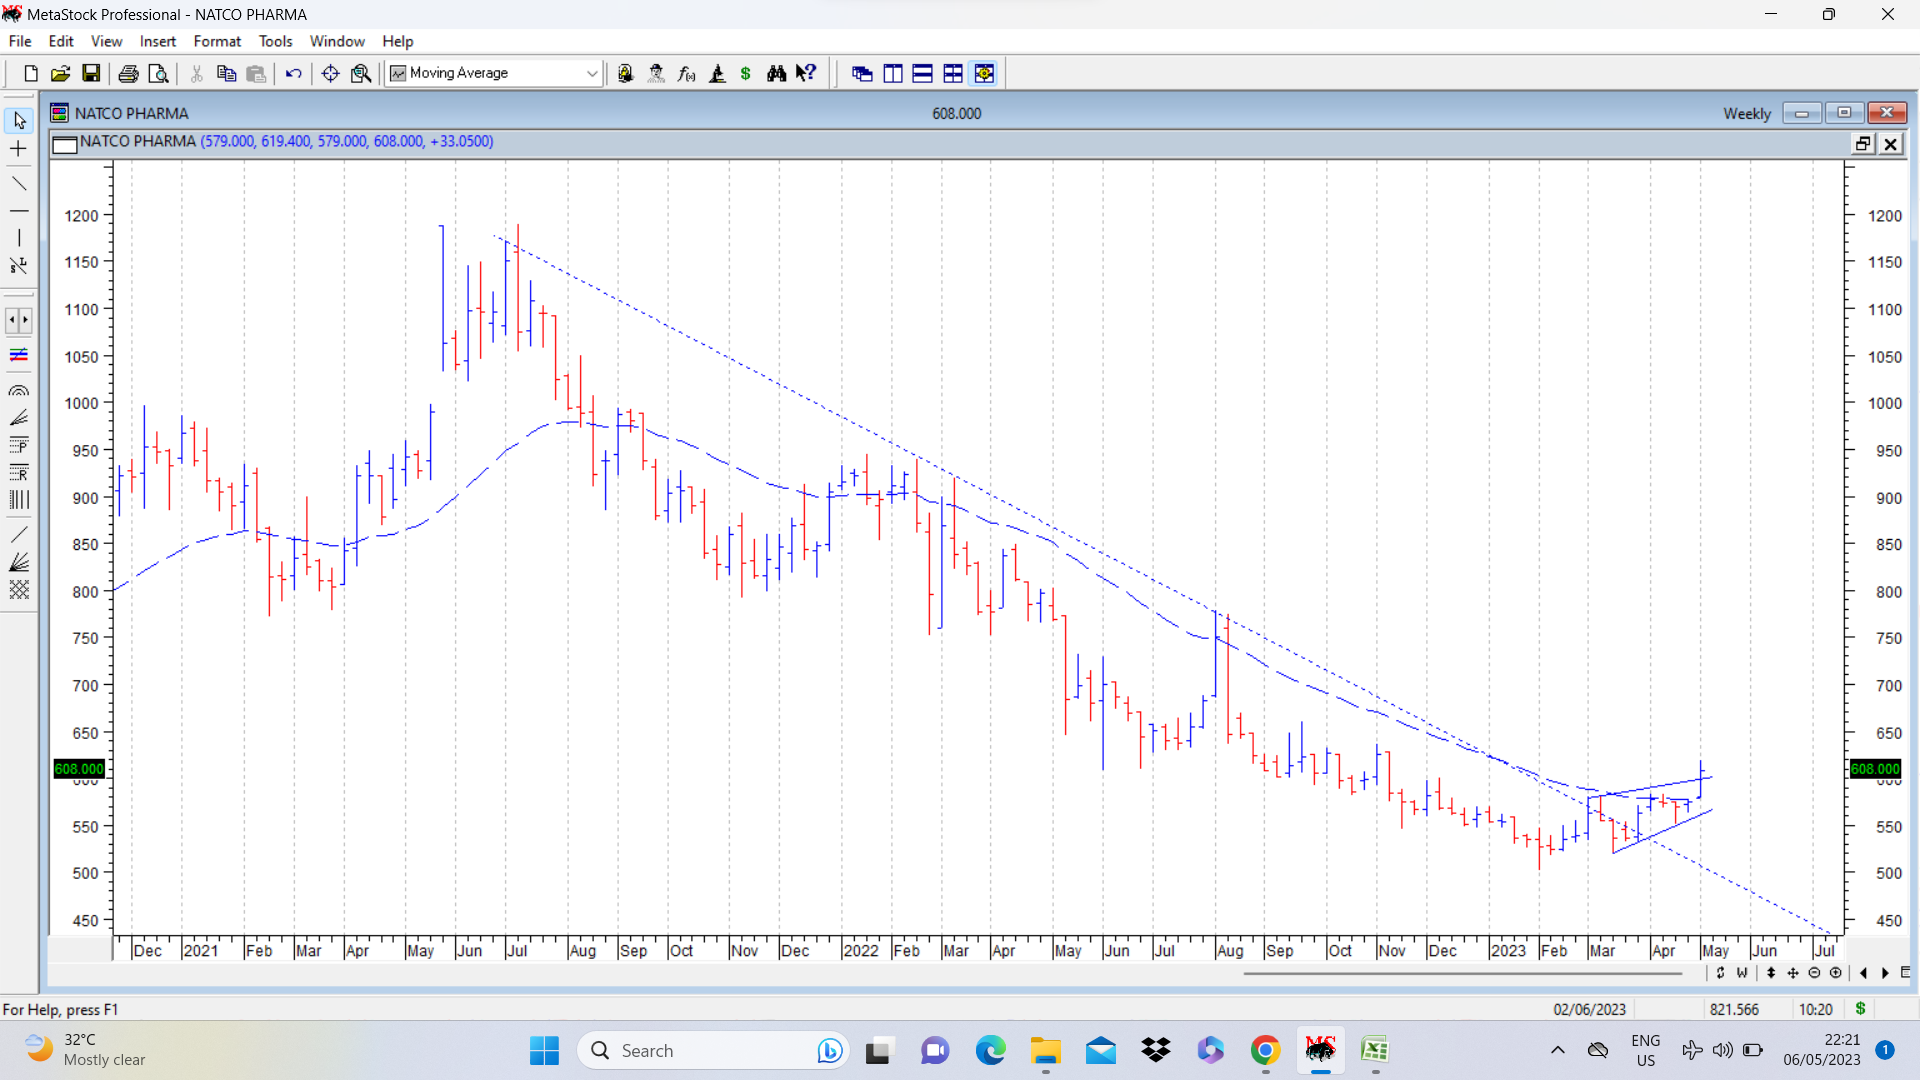
Natco pharma update. In continuation of GMMA chart posted above, here is a weekly bar chart of Natco pharma. Some very very early bullish indications are:
Price move above 30 WEMA and 200 DEMA.
Breakout from a falling weekly trendline and consolidation within a triangle. And last week there was a breakout from the triangle with a bullish candlestick, with higher volumes.
As of now it seems early days for the trend in stock price and hence there can be to and fro movements before a major move comes around. (disc: invested as disclosed before. )