There has always been a lot of debate and acrimony between the value investor guys (who try to find winners closer to all time lows, or 52 week lows or x percentage corrections from top etc) and the momentum guys who get into the ride once the bus is close to take off or has already taken off.
“To make money, you must find something that nobody else knows, or do something that others
won’t do because they have rigid mind-sets.” – Peter Lynch. There is a lot of hesitation from market participants on buying closer to 52 week highs or on crossing all time highs. Mainly because to get where they have reached, these stocks need to have had a good rally beforehand and people feel that these stocks have run up so much and hence have lost a lot of value.
Below paragraph from The Next Apple by Ivayly Ivanov appeals to me a lot.
Why the 52-week High List Is So Important
-
We don’t want to be first. We want to be in stocks that move, and being on the 52-week
high list attracts a lot of attention. -
It is an important benchmark, followed by many investors.
-
You cannot make a cent before the market agrees with you. The market’s way of
agreeing with you is sending your stock to the 52-week high list.
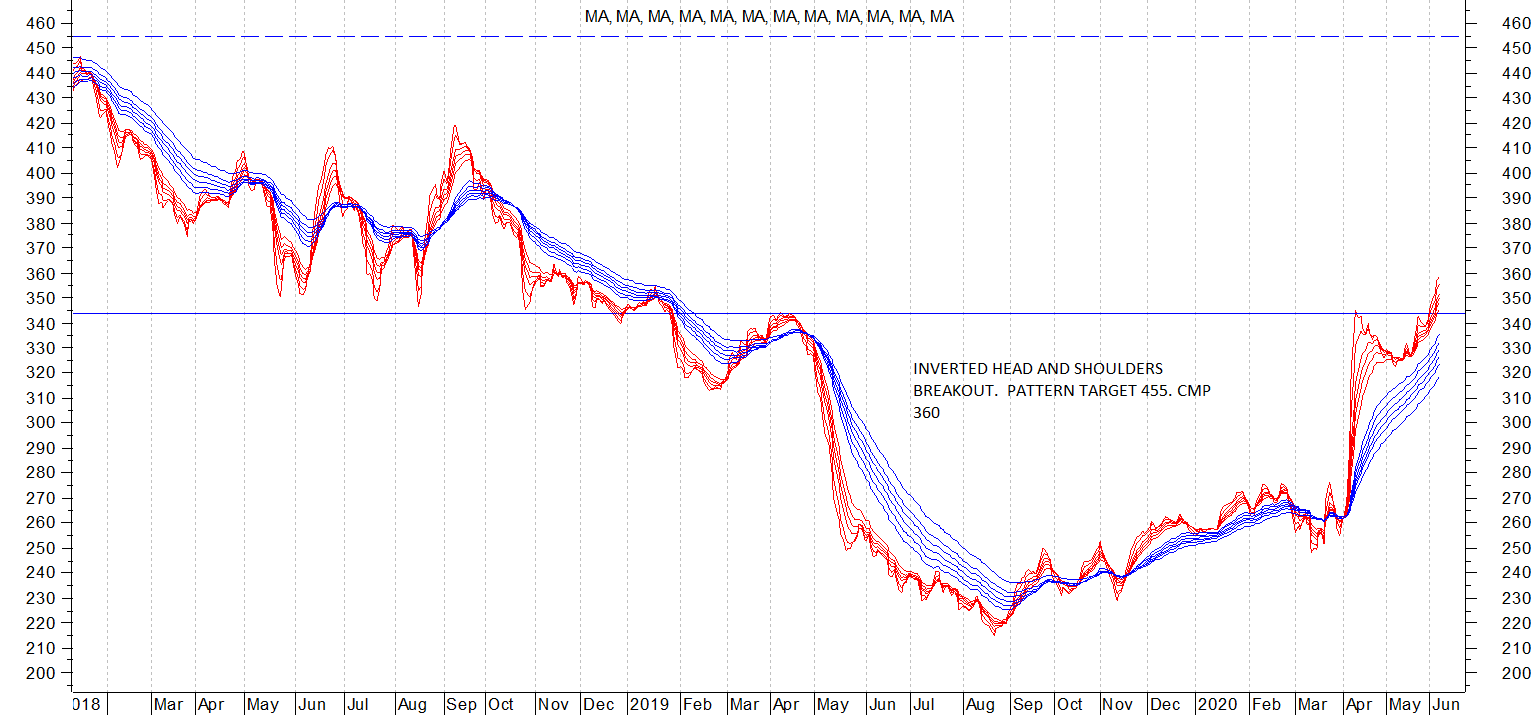
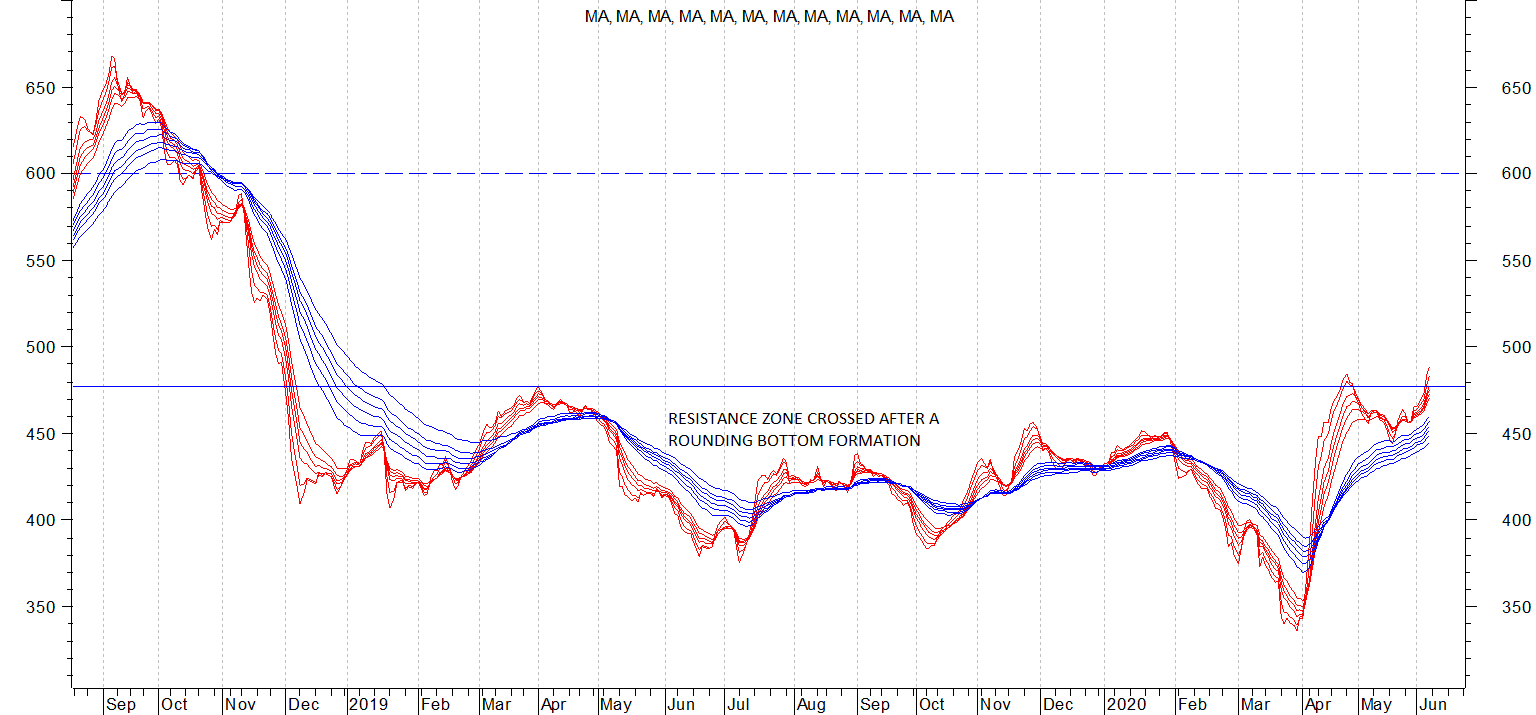
THE MAIN POINT MADE BY THE AUTHOR IN HIS BOOK IS TO LOOK AT STOCKS THAT CROSS 52 WEEK HIGHS (OR ALL TIME HIGHS ) AFTER PROPER BASE FORMATION. This proper base formation can take the form of flags, pennants, rounding bottoms, inverted head and shoulders, range bound movements and subsequent breakouts, double bottoms, triple bottoms, triangular or rectangular consolidations etc.
The last few words of the above statement are of a lot of signficance. We need to find out stocks that have made strong bases before crossing the crucial brekaout levels or close to them. Here an absolute number is not too sacrosanct. One should consider broad zones of base formation and then taking out of resistance zones in form of 52 week or all time highs.
My observation is that once a stock crosses all time highs or 52 week highs, it goes up a little and then retraces to go down below the breakout zone, then consolidate for some time before taking off. This small pullback is where we should be focussing on. It is where we get very good entry points.
Question is how to figure out that the pullback is not a reversal and only a slight pause in the upward journey of the stock? The simple logical answer is to look out for percentage retracement of the most recent rally preceding the breakout, or look out for important moving averages like the 50 or 200 day moving averages and see that these are not violated during the pullbacks.
ANOTHER IMPORTANT ASPECT OF PURSUING THIS STRATEGY IS TO LOOK OUT FOR SECTORS WHEREIN STOCKS ARE MAKING THESE KIND OF PATTERNS.
In the current scenario, the one sector where I see stocks making 52 week or all time highs is the pharma sector. Stocks like
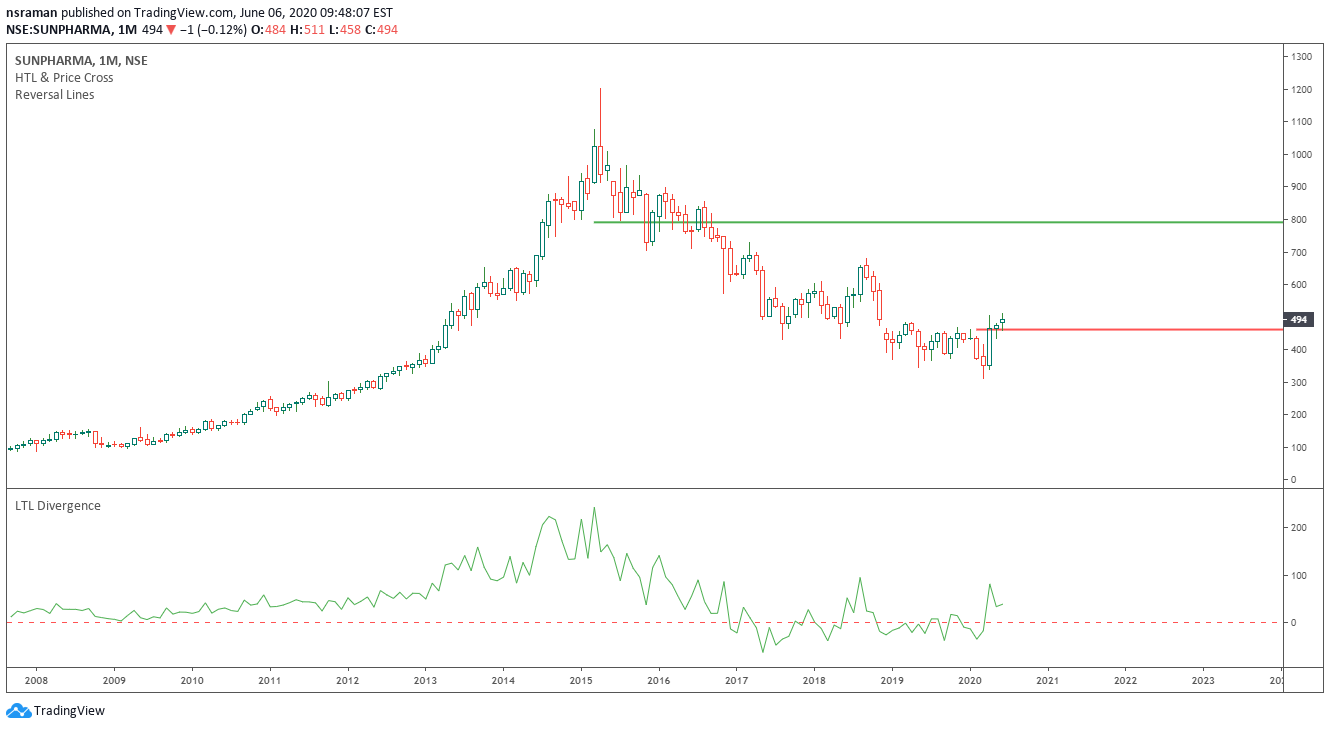
Sun pharma (crossing 18 month high of 485, cmp 495) , And having broken out from a pennant formation in last few days below the 52 week highs (base formation)
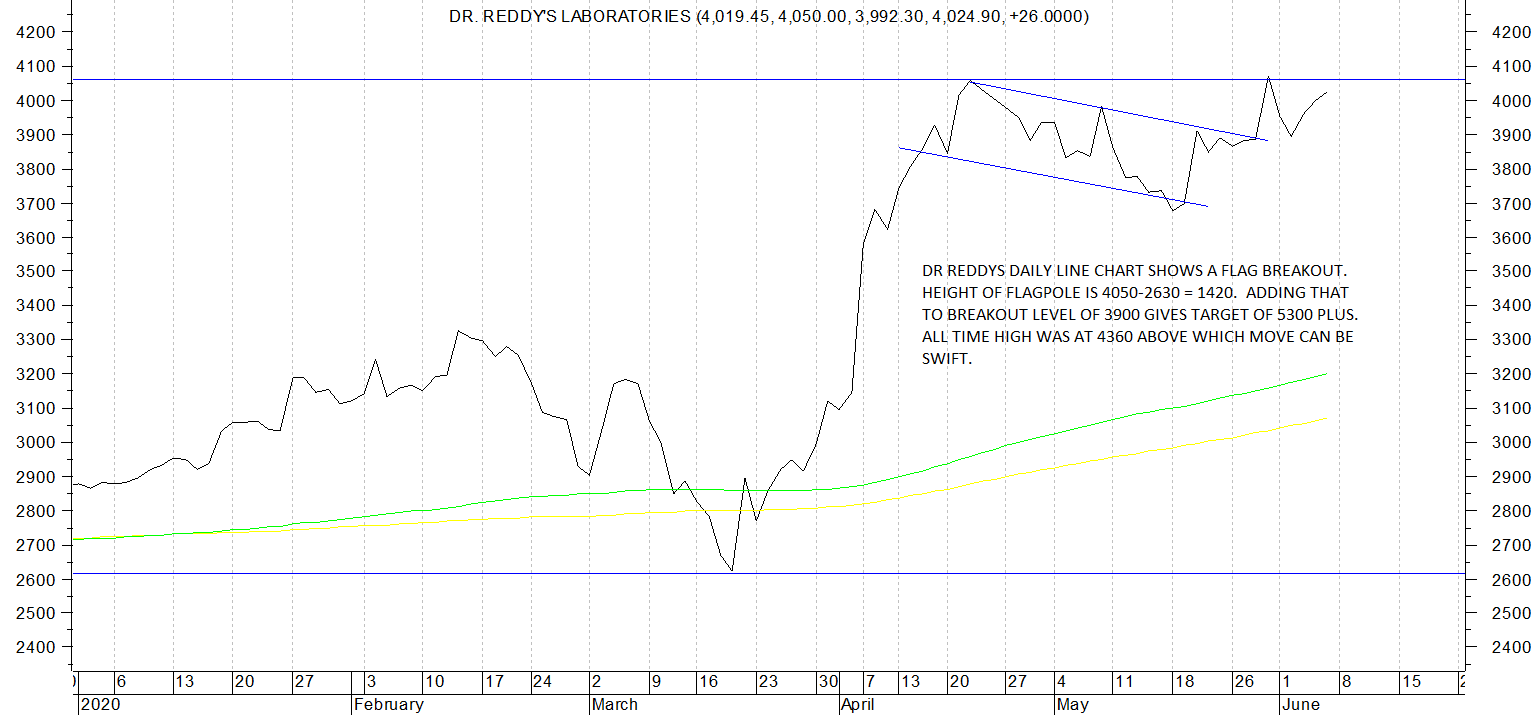
dr reddys (crossing 3 year highs of 3300-3400 zone and now 4000 plus, within touching distance of its all time high posted in 2016 which was 4386 and now forming a rounding bottom and most recent flag breakout) , cmp 4020
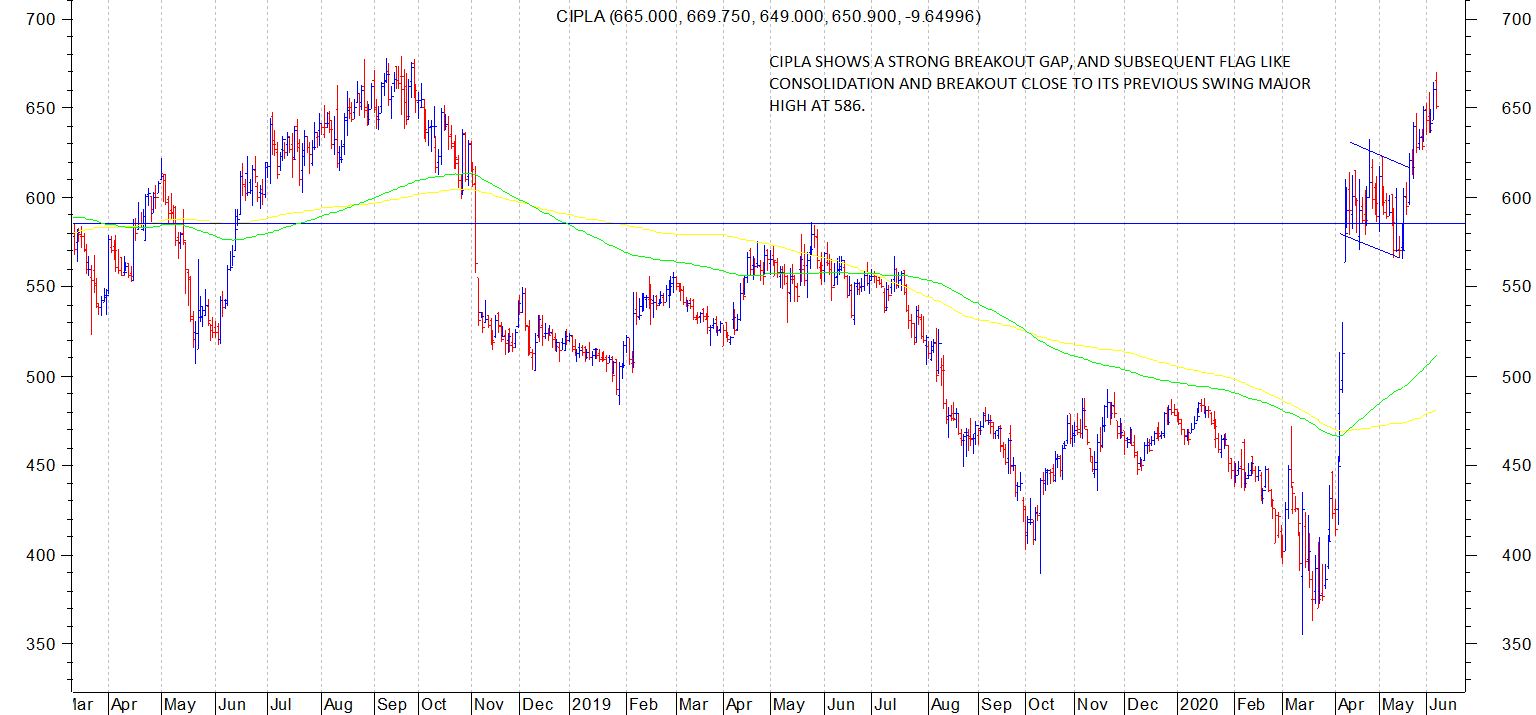
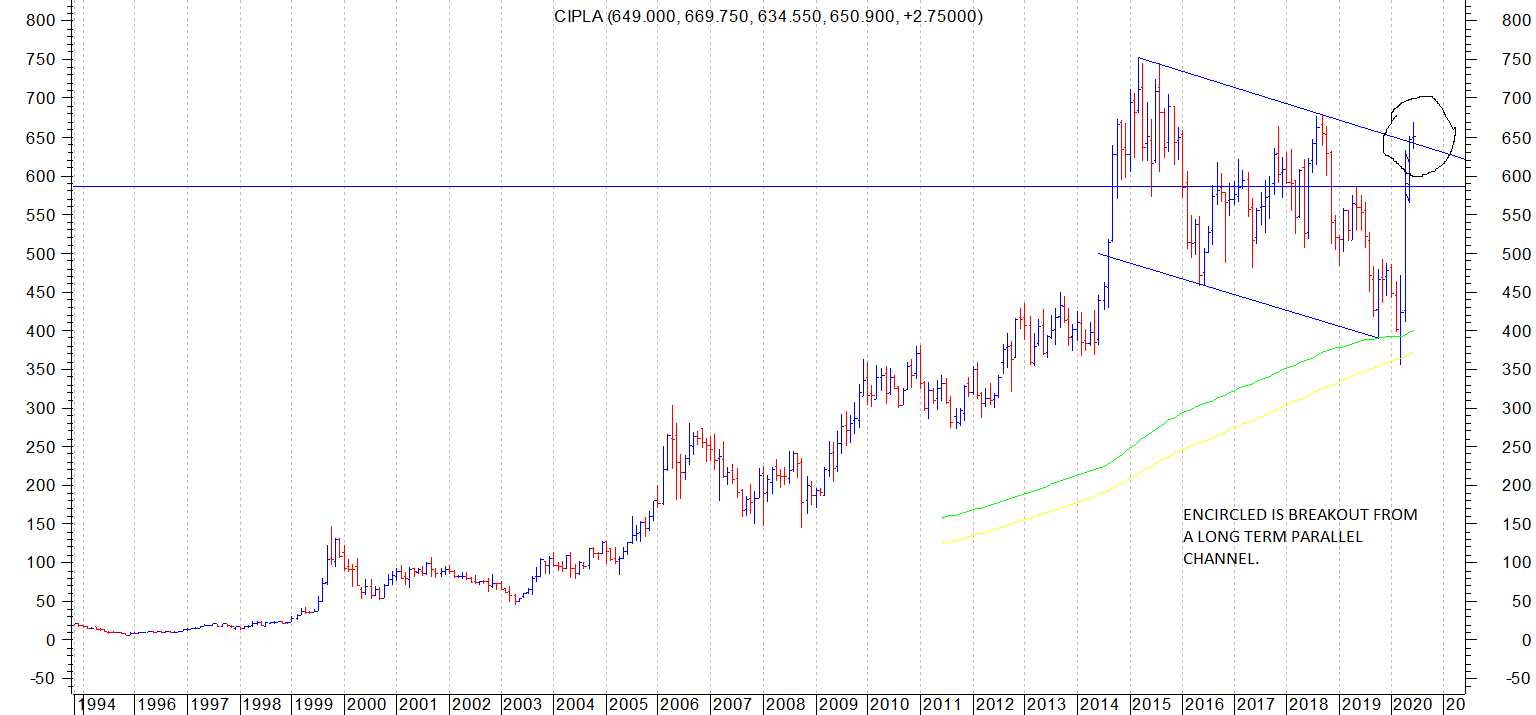
Cipla crossing 52 week high of 586 and recently again breaking out of a flag pattern on daily charts. And a long term trendline breakout from its previous all time highs. cmp 650
Biocon crossing previous all time high of 359 posted in Sep 2018, and breakout from a recent flag like consolidation. cmp 390
Cadila crossing its 52 week high of 352 posted in April 2019 and now forming a rounding bottom with a pattern top of 374 which needs to be taken out for further upmoves. cmp 360
Ajanta crossing 52 week high posted in Sep 2019 and subsequently taking out 1457 which was swing high in March 18. Next resistance could be 1595 posted in Jan 2018. cmp 1465.
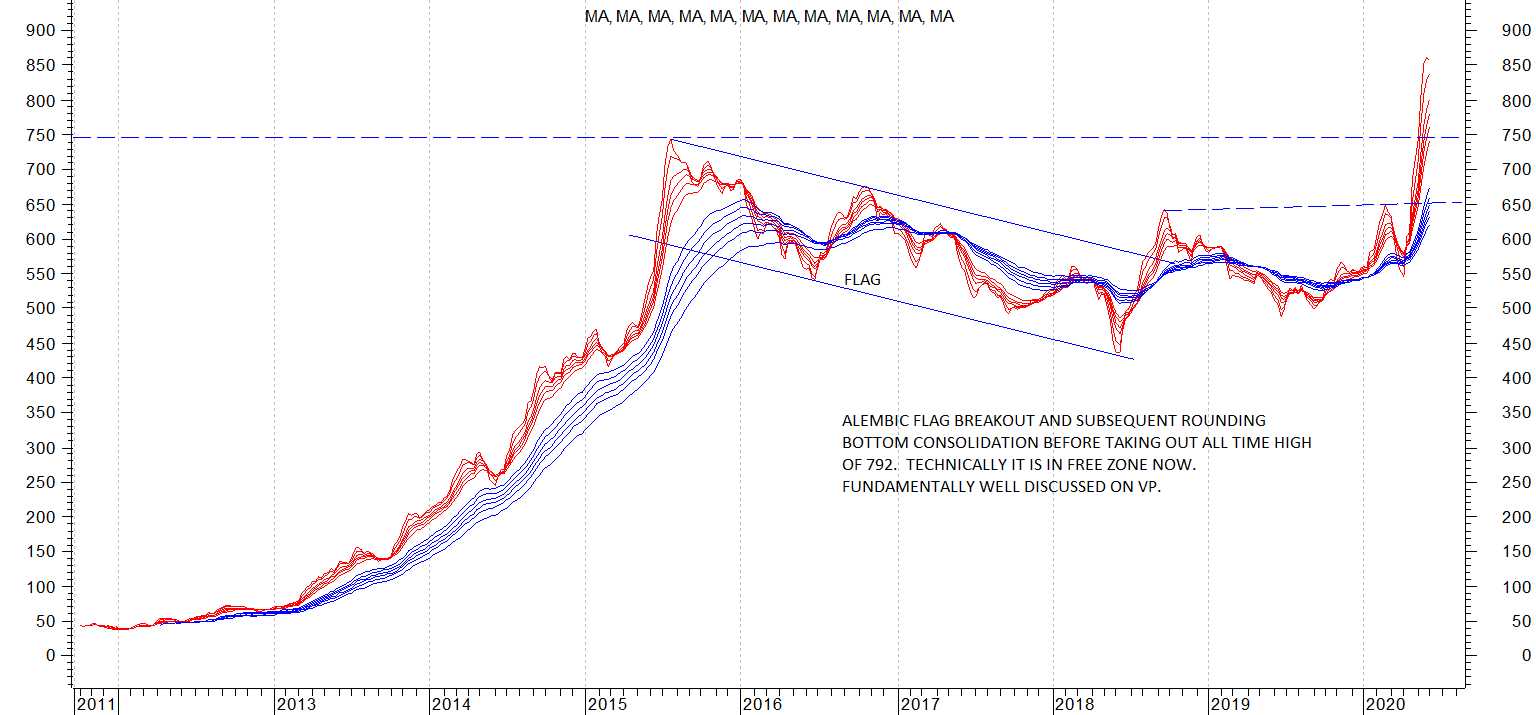
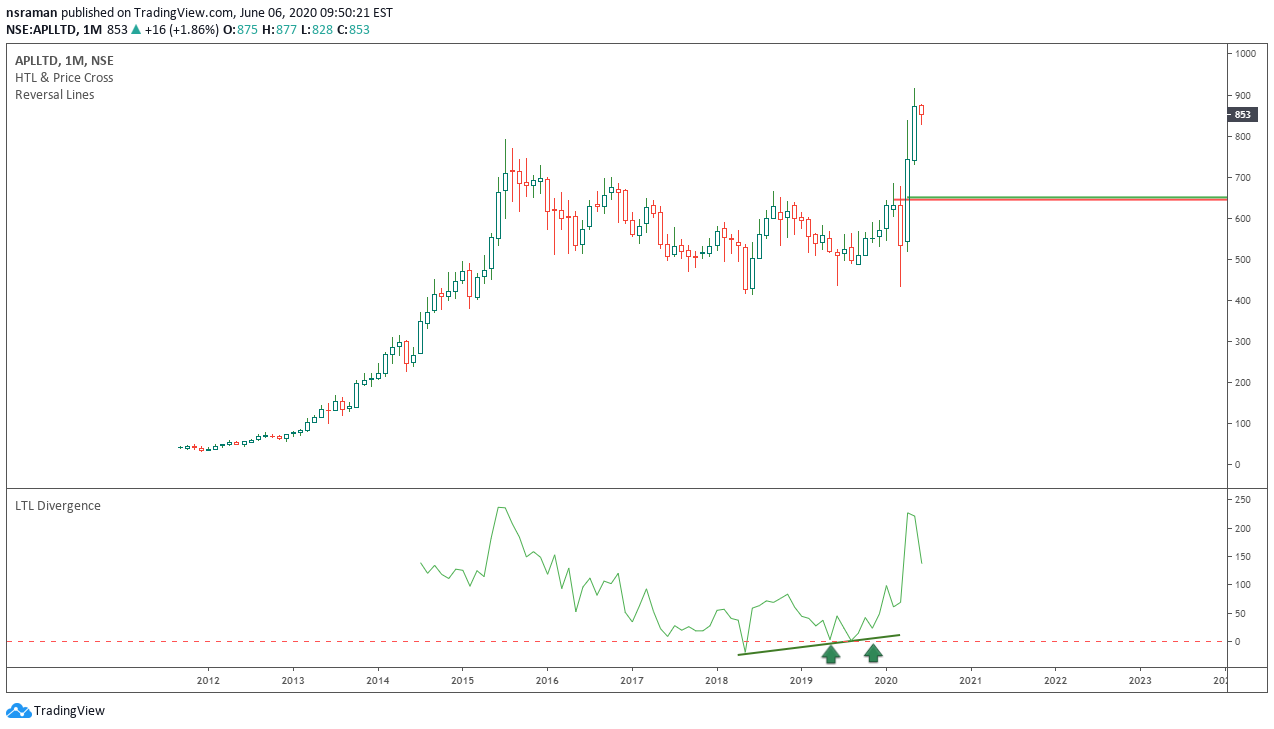
Alembic crossing its previous all time high of 792 posted in 2015. Before it did so, it consolidated in a long term flag like pattern.. cmp 855
Lupin crossing its 52 week high of 870 recently after having broken out of a daily flag like pattern.
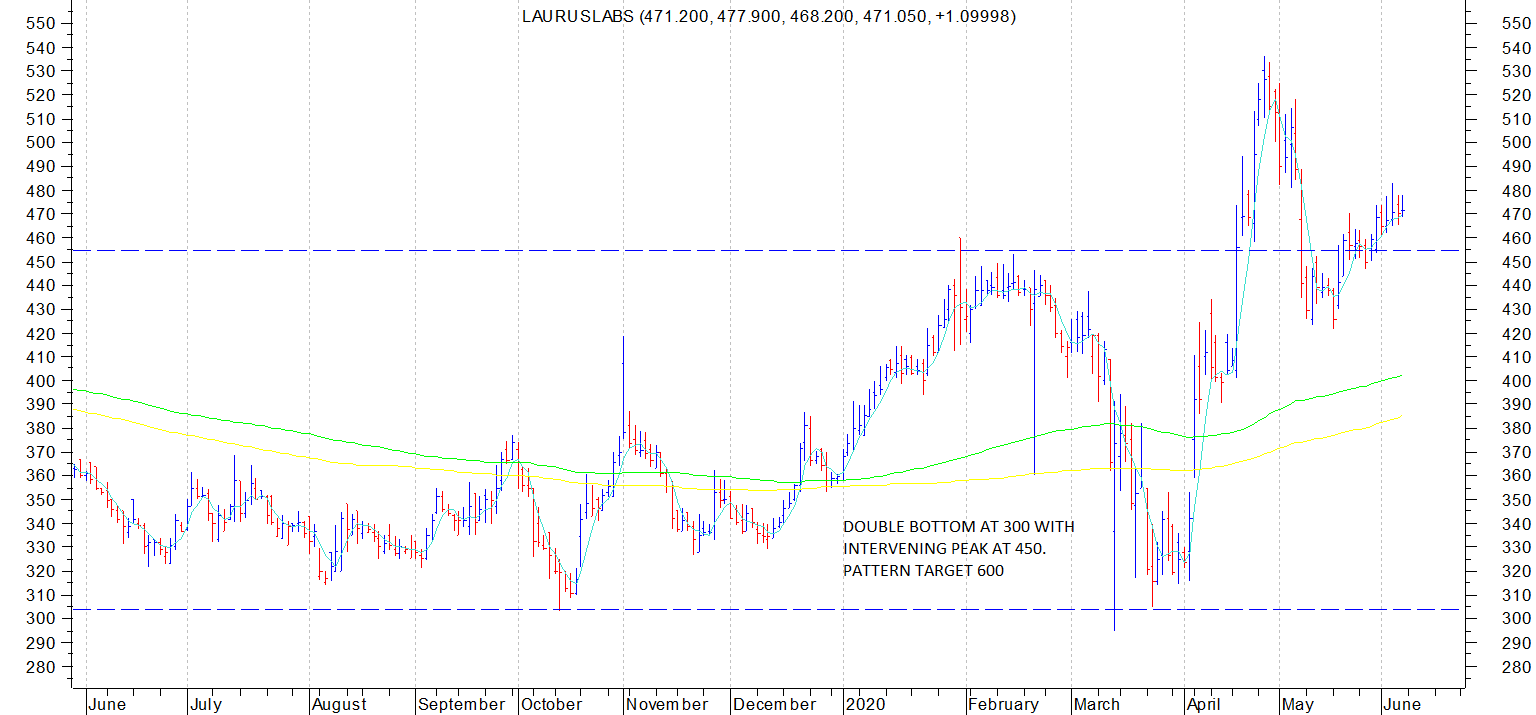
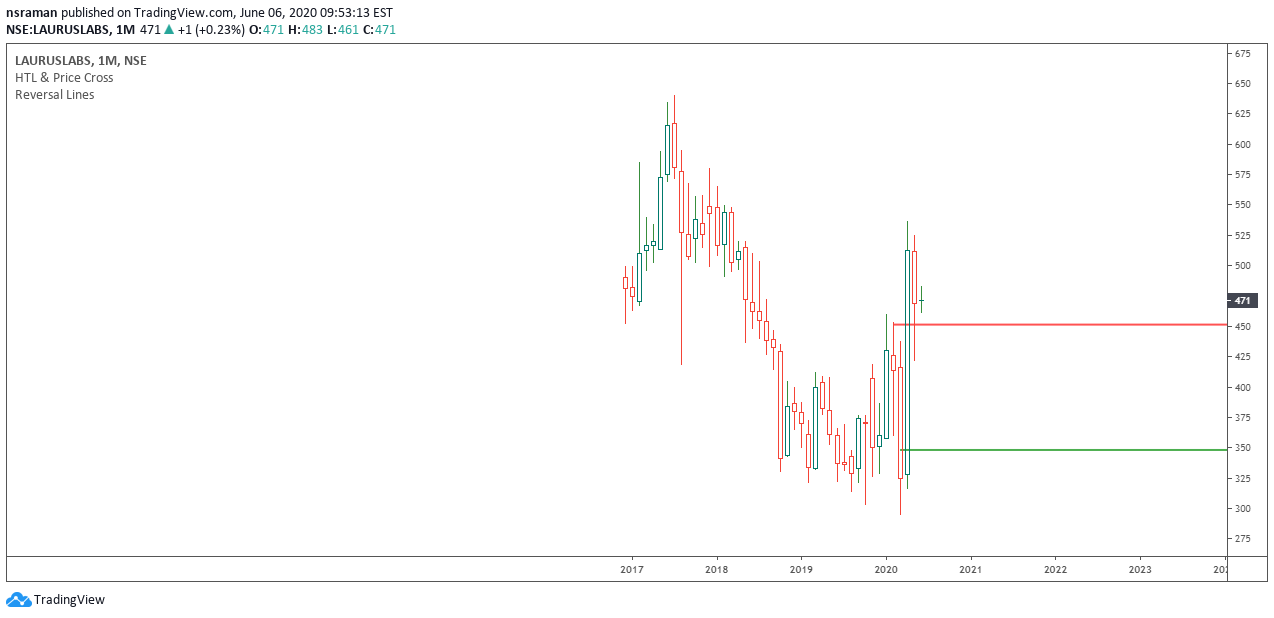
Laurus posting a 52 week high above 405 before the Corona crisis, and subsequently went down and tested all time low zone of 300 and quickly within a few weeks bounced back to post a swing high of 536 before correcting to 420-430 due to the stake sale by Warburg Pincus. And now seems to be showing some relative strength by moving above congestion zone of 450-460. Also a double bottom at 300 with intervening peak at 450, which has been retested during the recent correction down to levels of 420-430. cmp 470
PROMINENT HEAVYWEIGHTS AMONG THE CNX PHARMA INDEX ARE SUN PHARMA, DR REDDYS, DIVIS, BIOCON, CIPLA, TORRENT, ALKEM, CADILA, LUPIN, AUROBINDO.
Almost all these stocks are displaying robust strength all throughout the wild swings in the market in last few weeks and months. The index chart itself is showing strong breakout from multiyear correction.
Listening to the commentaries of these companies provides insights that the sector as a whole may be overcoming the problems it has had in the past 3-5 years due to various issues.
I will be posting individual charts where there is actionable potential.
IN CONTRAST TO THIS, THE ARGUMENT IN CURRENT MARKET MOOD IS THAT A LOT OF SMALL AND MIDCAPS ARE PROVIDING VERY QUICK MOVES GIVING NEARLY 50-100% RETURNS. Problem with this approach is that since no clear sectoral leadership visible, and betting big on isolated small and midcaps is difficult. In case of pharma, there is a wide variety of companies to choose from, and there is good liquidity in case one wants to take a meaningful position without impact costs.
SOME STRONG POINTS FOR THE SECTOR TO OUTPERFORM
The sector is coming out of a downturn of nearly 4-5 years because of which expectations from the sector have not been much.
The baseline numbers since past few years have been low due to sectoral problems.
In the broader markets, a lot of sectors and companies are going to be affected in q1 fy 21 for sure and to some extent even in q2 fy 21. Whereas in the pharma space, it seems these quarters would not be affected much.
Even ownership of the sectoral companies in portfolios and mutual funds and other big funds is low.
The index weightage of the sector in nifty is very low.
WE WILL TAKE THIS THREAD FORWARD WITH EXAMPLES OF COMPANIES OF OTHER SECTORS WHERE THE PATTERN IS PLAYING OUT. CURRENTLY PHARMA AS A SECTOR SEEMS TO BE CLEARLY SHOWING STRENGTH.
RISKS:
Once upmoves begin post taking out of these 52 week highs and all time highs, one is not too sure how long the rally is going to last. So one has to be on the lookout for trend reversal and time an exit.
If one allocates a high amount to the particular sector, there is risk of sectoral concentration. But since this is not a buy and forget kind of strategy, and there is high liquidity in companies in question, one can make timely exits if so warranted.
Missing out on action in other individual companies where because of valuation catch ups or other company specific reasons, upmoves can be swifter and gains can be more. But part of it is mitigated by the confidence to allocate high proportion to a sector that is showing relative strength and better business prospects.
disc: I own, sun, cipla, laurus, drl, alembic, biocon, cadila etc (nothing against other pharma names but I like to take concentrated bets and hence the above selections) in my personal portfolio and pharma occupies a heavy concentration in my portfolio.