
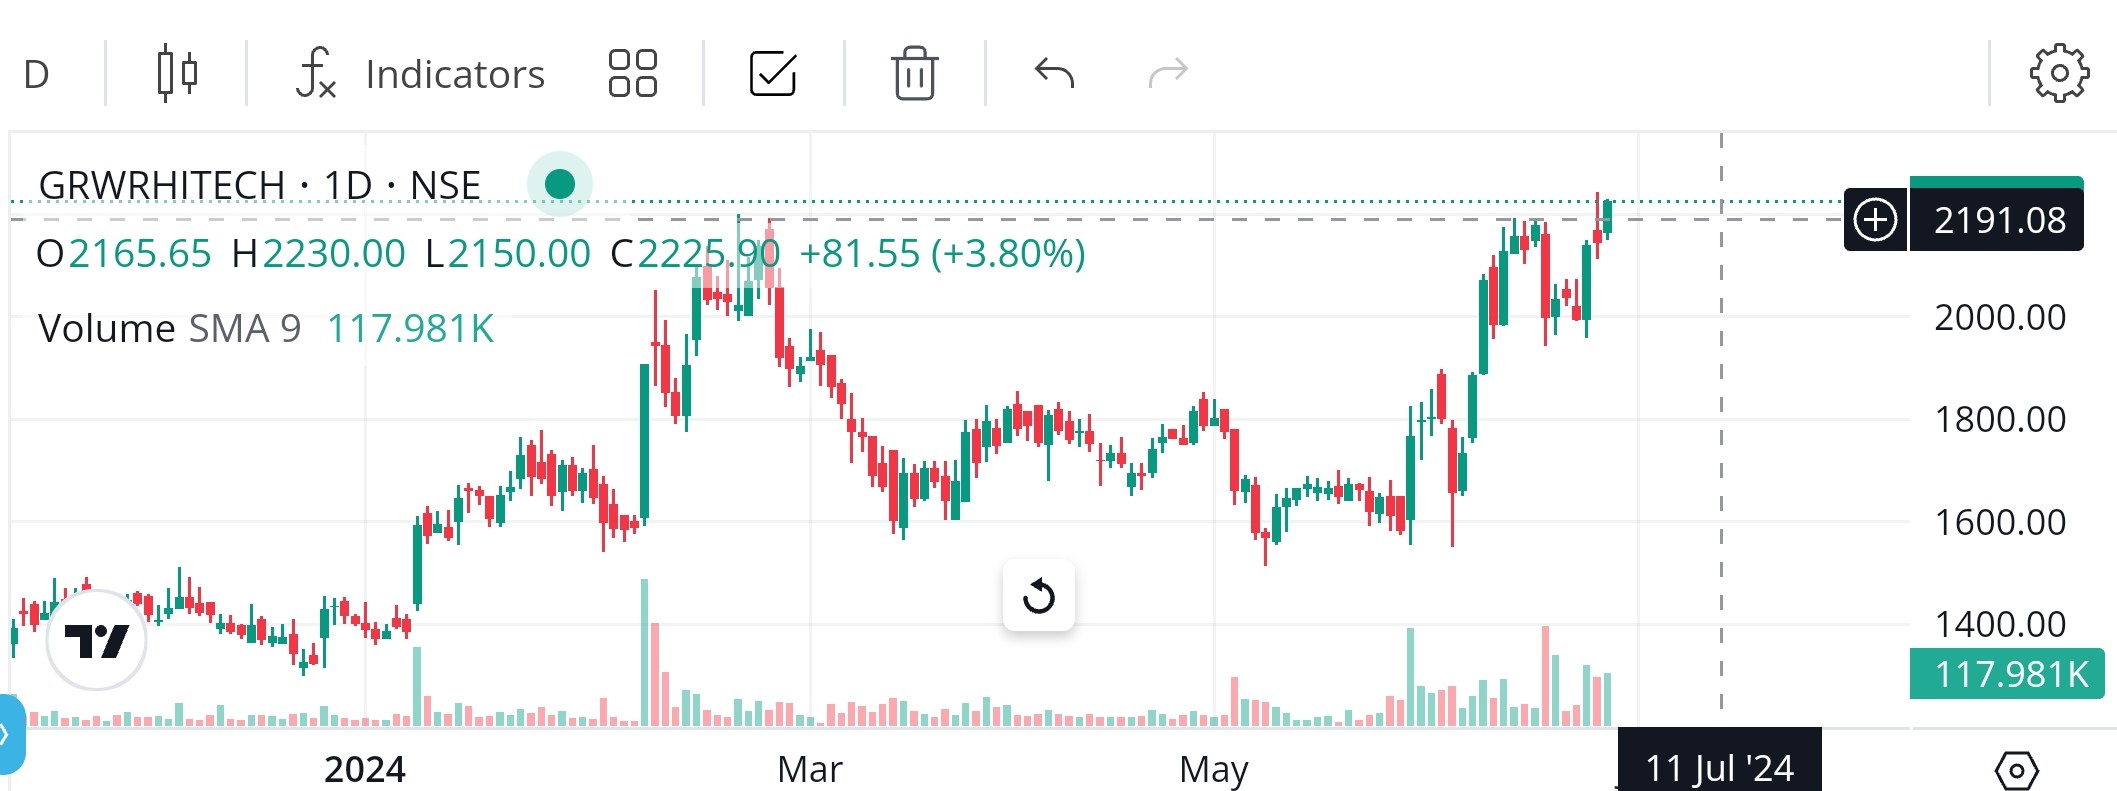
Cup and Handle breakout on the daily chart for Garware Hi-Tech.
Fundamentally, company has guided revenues of ₹2600 crores by FY27. Margins are stable at ~20%. FY27 PAT could be around 320 crores and EPS could be around ₹135.
Cup and Handle breakout target comes to ₹2850-2876.
Volumes are also picking up.
8 Likes
MAFATLAL INDS cmp 198 daily chart only BSE
Life High Breakout after a Consolidation
Mcap 1300 Cr Prom hold 70 %
Mafatlal Holds 2.52 Cr shares in NOCIL ie. 15.16 % equity

6 Likes
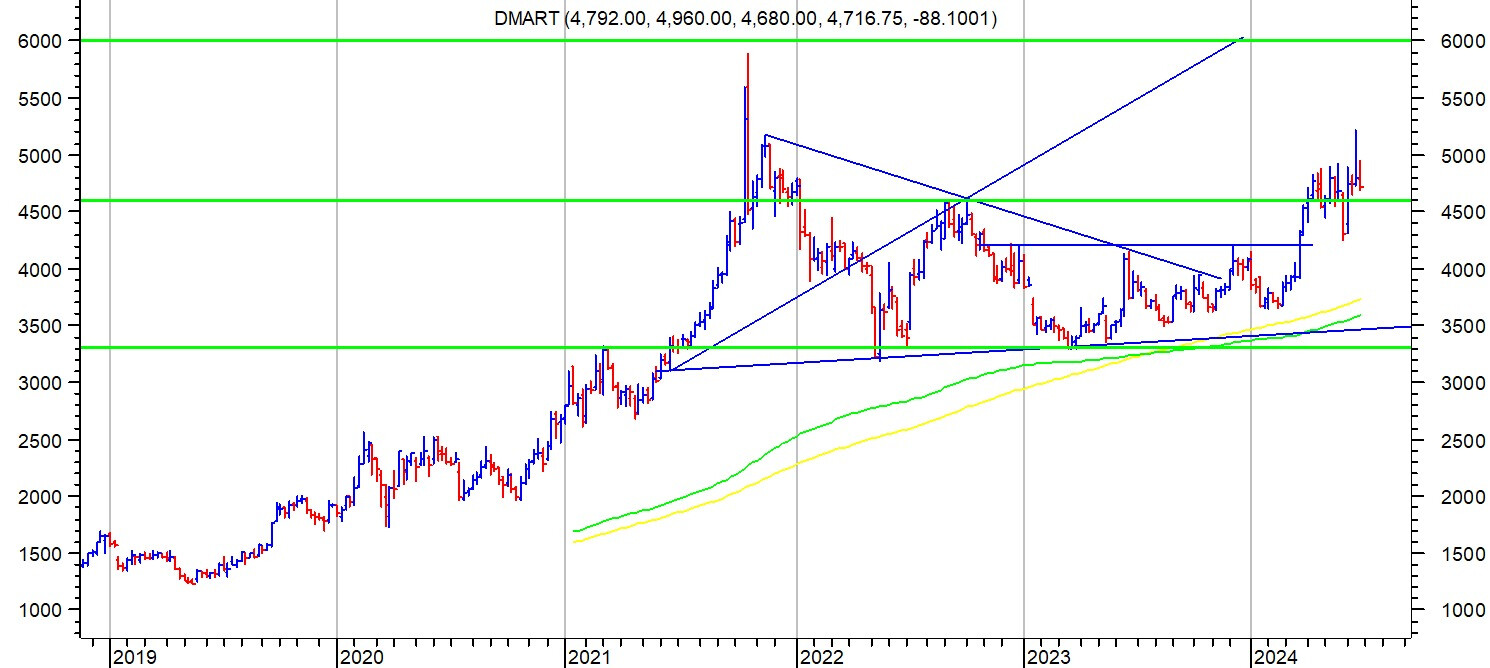
Dmart weekly chart. cmp 4716. Multiple technical formations. (disc: no positions, under watchlist)
A symmetrical ( Wolfe Wave with target line drawn which shows a potential target at 6000 plus. ) triangle breakout coinciding with a breakout above 2 year high at 4600.
Post breakout there is 12 weeks consolidation in close vicinity of 2 year highs.
Double bottom at 3200 in May 22 and April 23 (shown in green) with breakout above 4600 providing technical target of 6000. Also marked minor resistance at 4200.
Not a recommendation. Posted because of multiple technical patterns in same weekly chart.
20 Likes
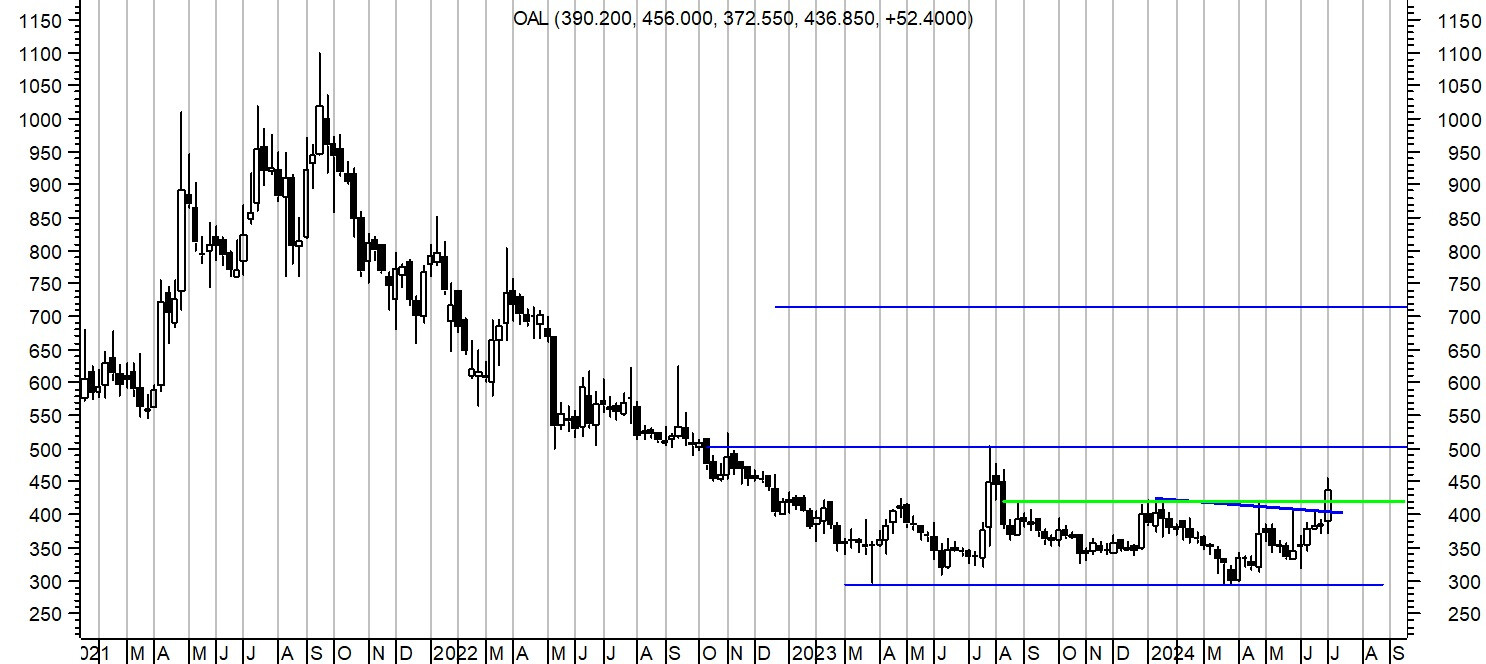
Oriental aromatics weekly chart. cmp 432. Attached weekly chart shows a big weekly candle developing at crucial breakout region at a falling channel level and horizontal channel level. If stock price crosses above 504, it will be a double bottom breakout providing targets of 700 plus. disc: invested more as a technical bet. It could be an early stage rounding bottom candidate.
(not a recommendation. Posted for academic interest because of presence of multiple technical patterns easy to understand by just looking at the chart. )
39 Likes
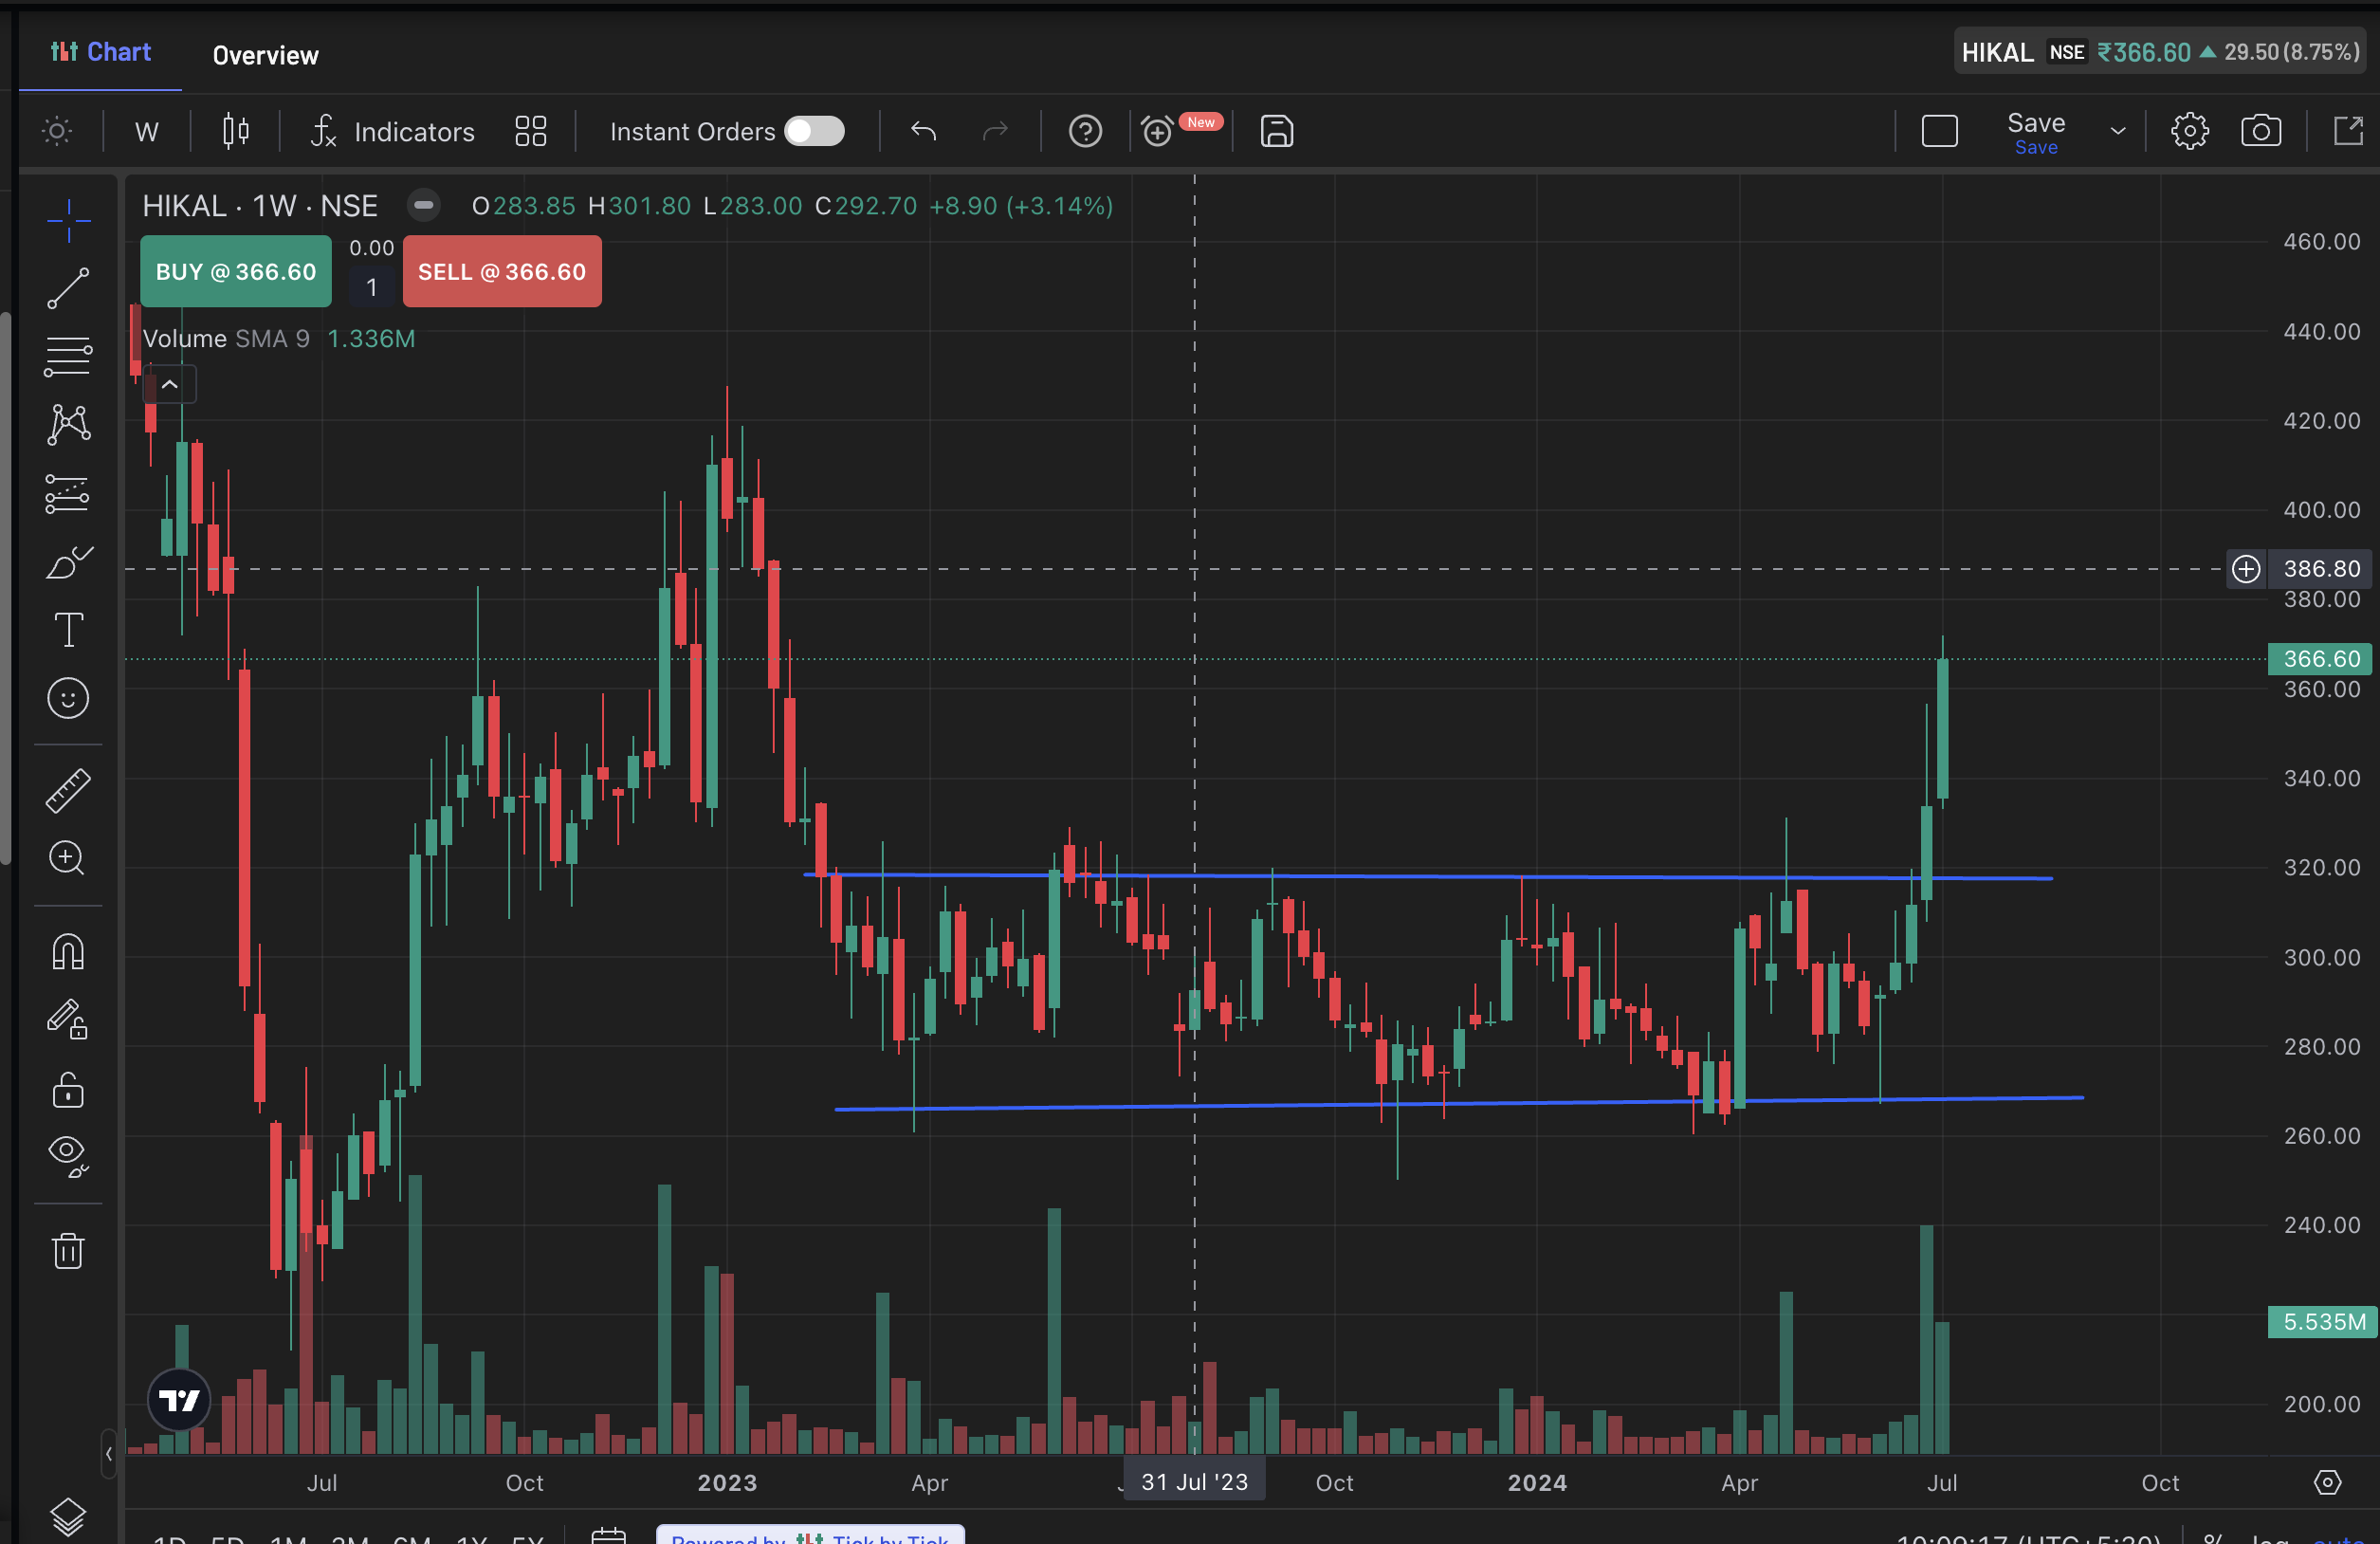
“NSE: HIKAL stock has consolidated within the 270 to 318 range for the past 68 weeks. In the recent 3 weeks, it broke out of this range with significant volume, advancing to 366, nearing its 52-week peak of 372. (Disclaimer: Invested average price is 341. This represents approximately 2.32% of my portfolio.)”
4 Likes
Hello @hitesh2710 sir, request your guidance to understand false break out.
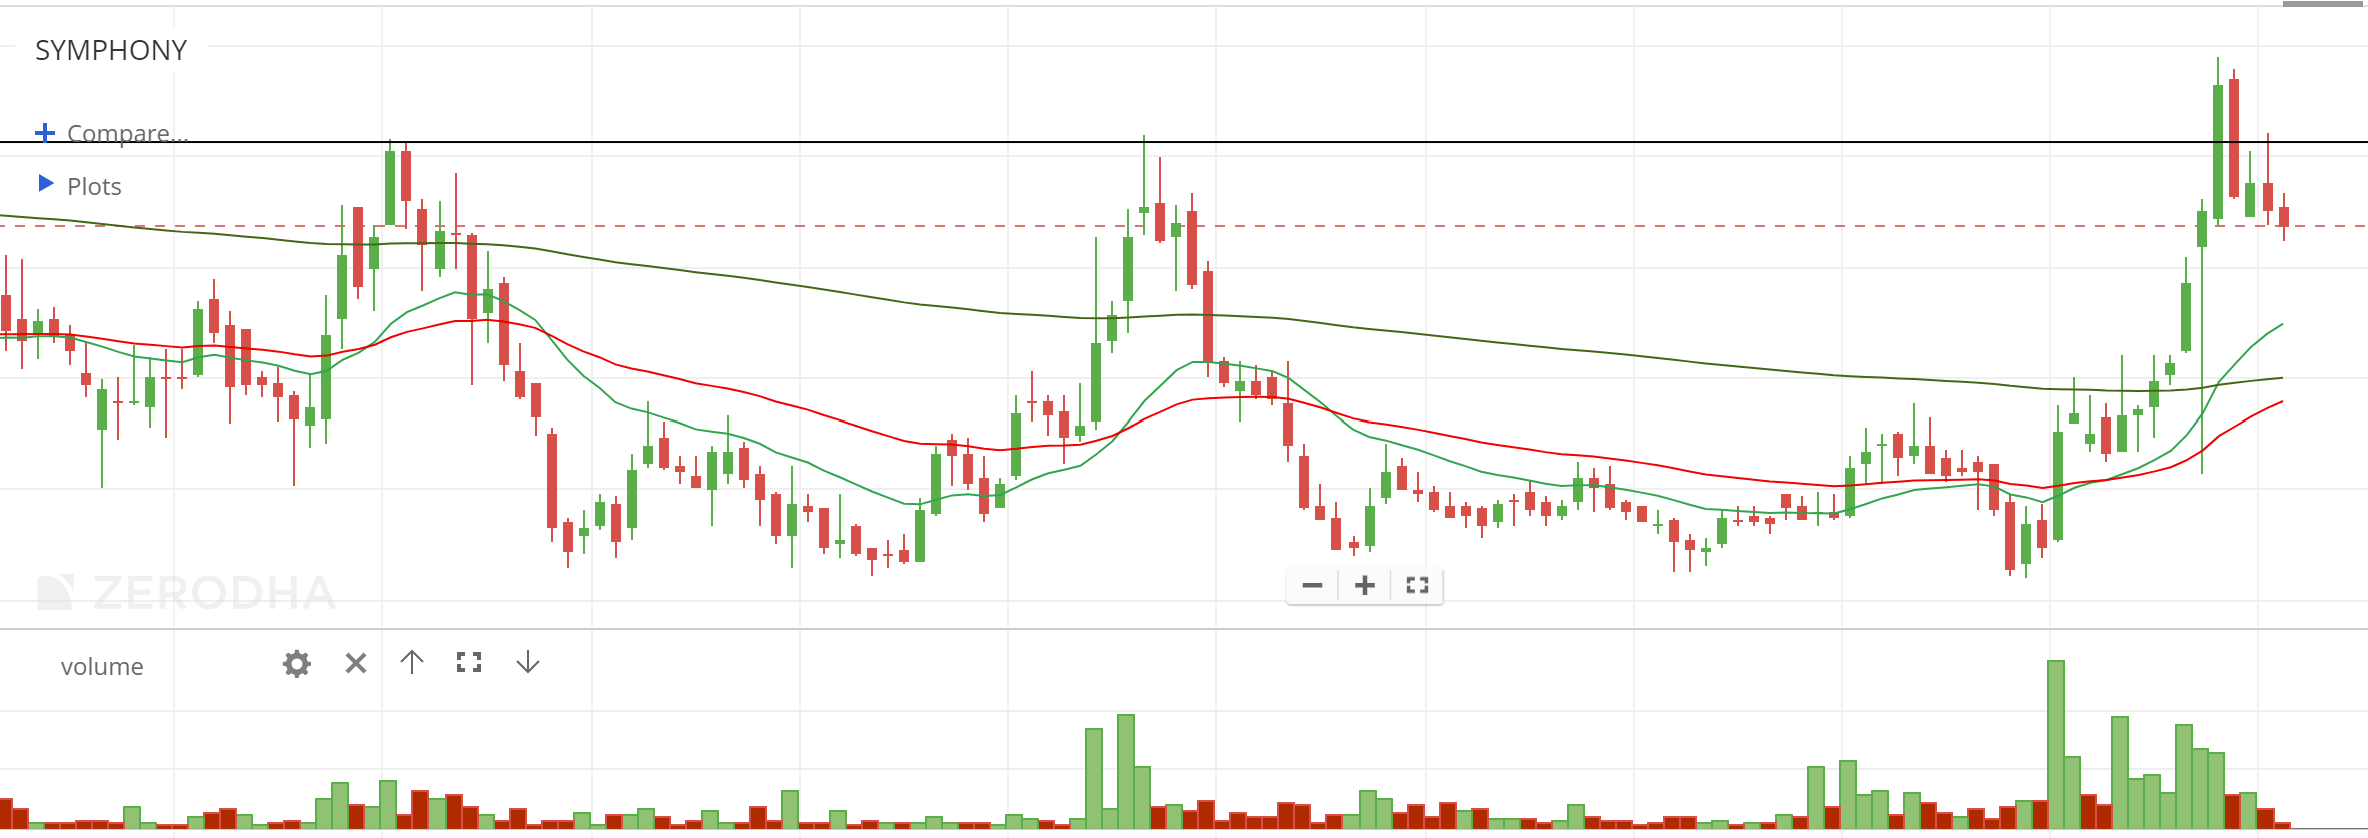
Attaching price movement of Symphony after your post. On weekly basis, chart broke the resistance around 1215 with very good volume it was above 1215 for a week. However, next week it closed below the resistance. Following 2 weeks it tried to cross the resistance but failed to cross it, however, volumes are getting dried-up.
Is it investor who would have trapped in last two top migth be trying to exit? or this is case of possible false breaout? or is there something else we should look for before concluding false break-out?
2 Likes
@hitesh2710 sir, did you get a chance to read Mudit’s question? I too have same question, if a stock price goes below 30 weekly ema, should we consider exiting the position?
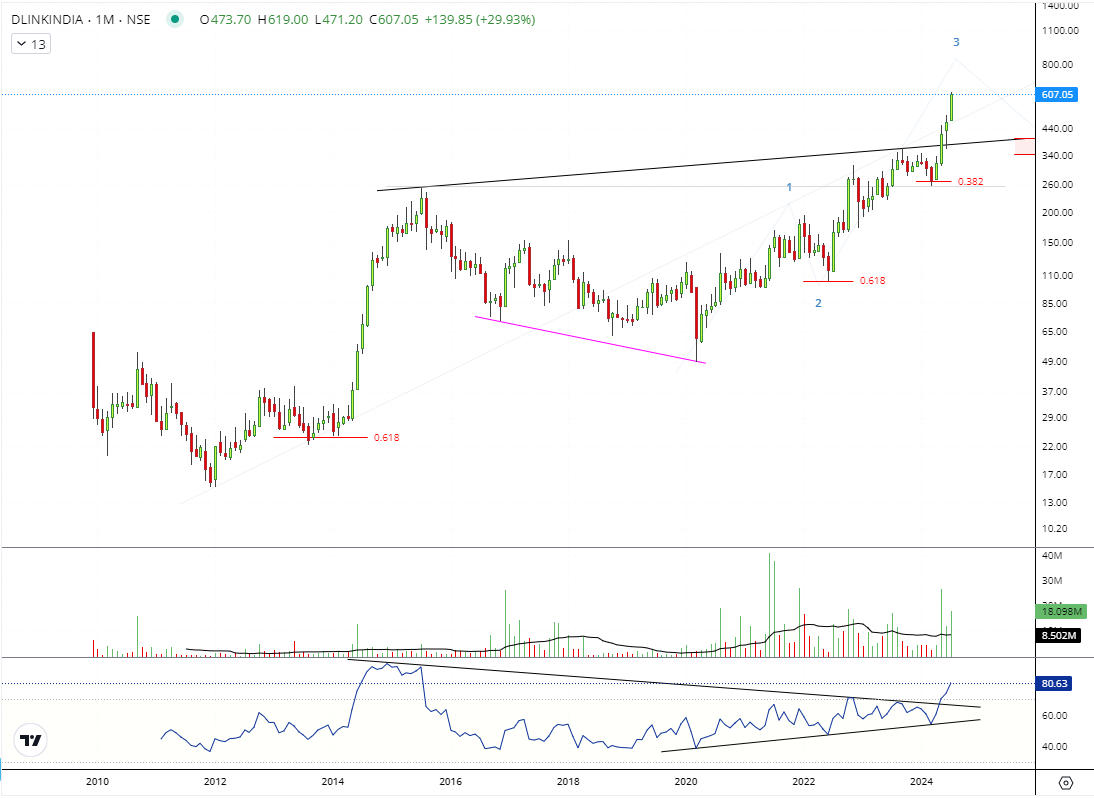
Update on DLINKINDIA- 265-340-617 CMP:
- As discussed earlier, the pennant has broken out.
- A multi year slant breakout seem done on Monthly chart, with rising volumes.
- RSI is on the verge of breaking out.
Safe to assume bullish bias ahead.
1 Like
The 10 WEMA and 30 WEMA are not averages etched in stone. These can just be a couple of parameters to objectively view momentum in a chart. Usually charts in strong near term uptrend take support at region of 10 WEMA and those in medium term momentum take support in region of 30 WEMA.
Different people use it differently. Some trend following traders use a 10 WEMA to keep adding to their positions on the way up, and sell the spikes seen in strong momentum stocks. Others use it as a mental stop loss wherein if a stock conclusively breaches 10 WEMA then they plan exits.
There are no fixed rules for using these moving averages. Personally I tend to go down one time frame lower on daily charts and see if there are any signs of near term weakness in strongly trending stocks.
Idea should be to start having atleast a system to follow and then see if it works and try to get better at it. At the end of all the exercise after a few months/quarters/years, idea should be to land up with a system that works for us and is easy to implement. It need not be based on moving avgs also. Can be just price patterns with volumes, broad formations like rounding bottoms, cup and handles, flags etc. It’s a constant march towards something close to a holy grail.
24 Likes
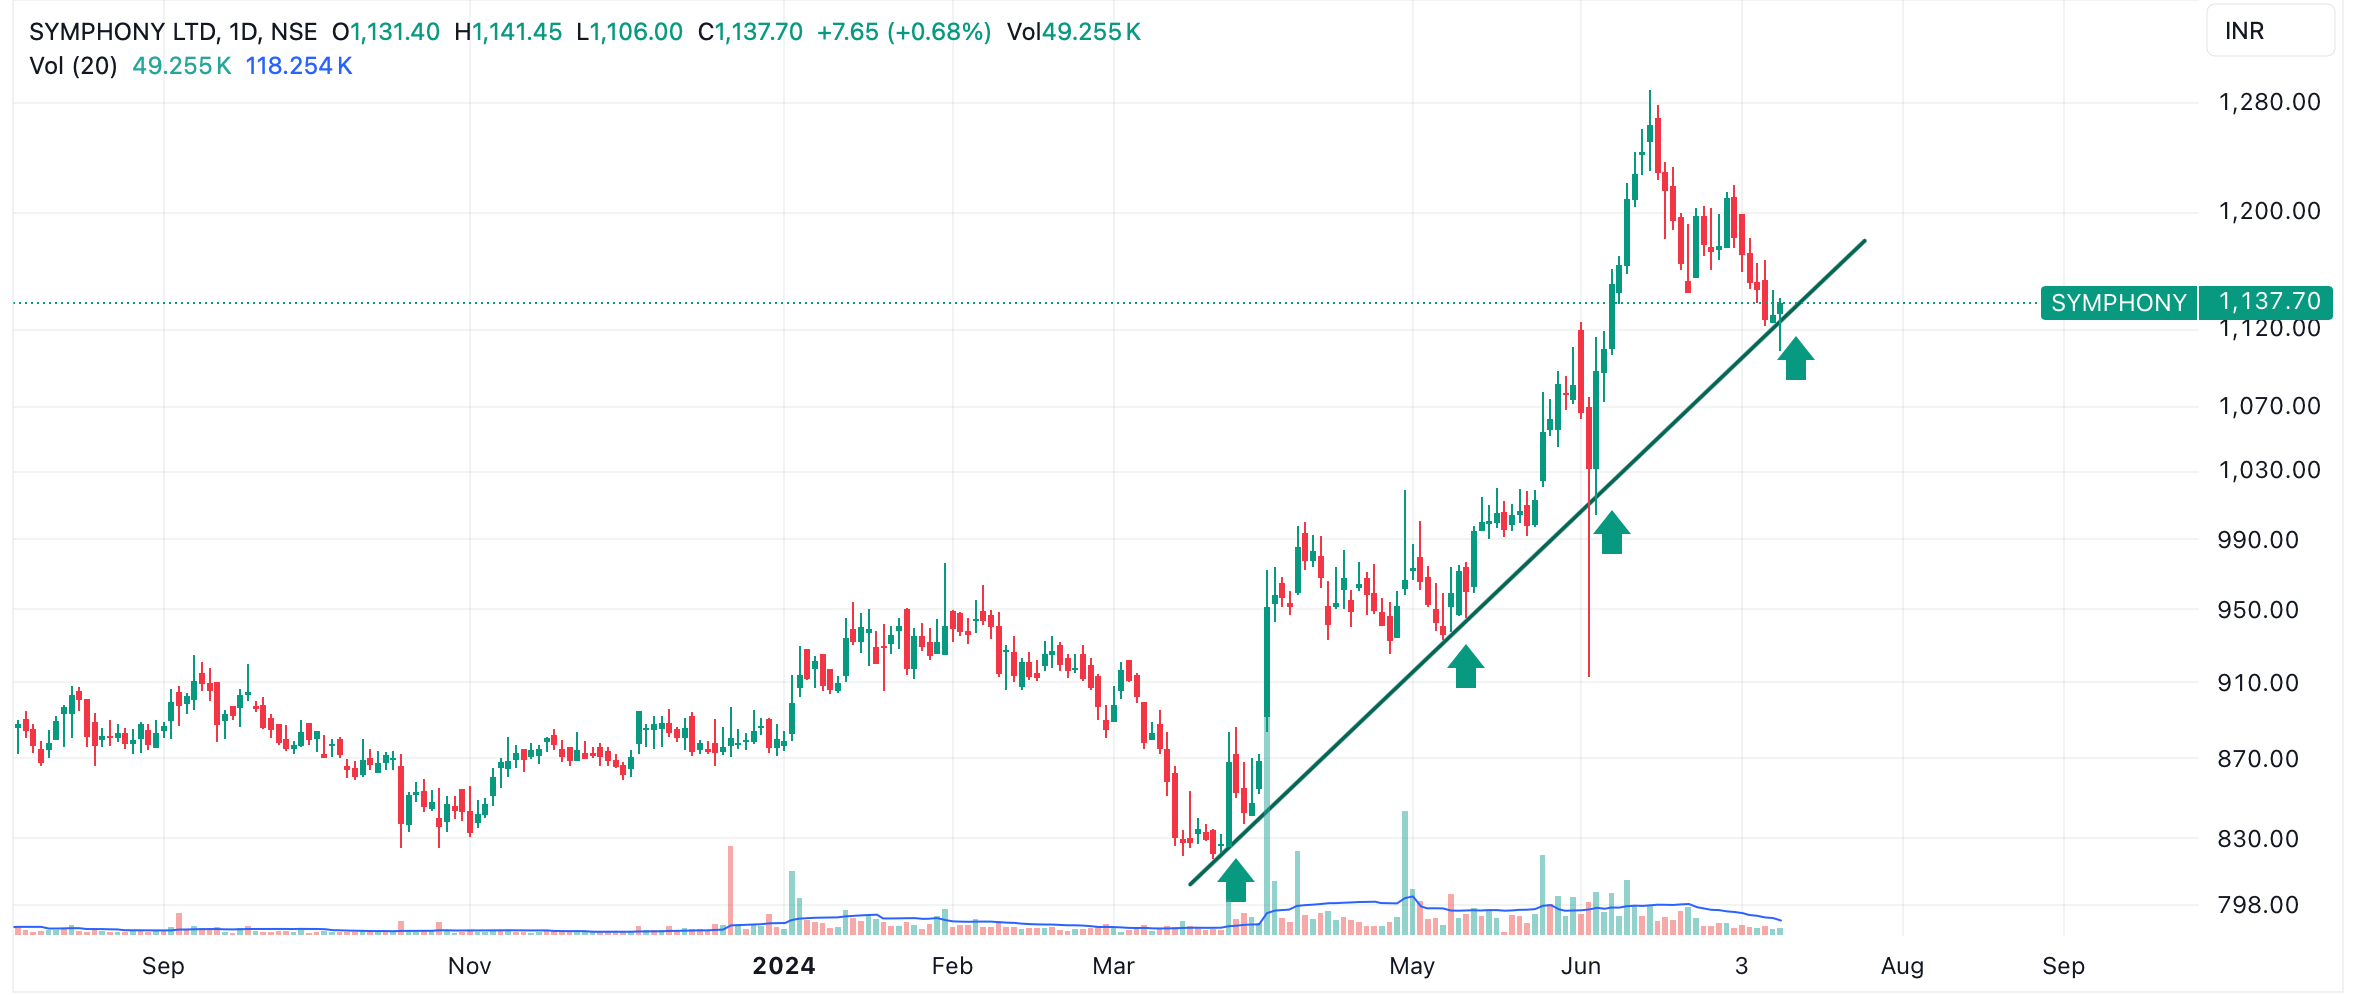
The level of 1215 is a 3 year high for Symphony and it was taken out in the latest upmove which began from 820 in March 24 to a high of 1290 in June 2024 which is a move of 50% magnitude.
While the 1215 level should be an important milestone, we also have to consider some amount of retracement to the above mentioned rally as a normal event. Putting in retracement levels to the upmove from 820 to 1290, the low yesterday of 1106 co incides with a 38.2% retracement to the entire upmove. Yesterday amidst a weak market the stock price managed to post a bullish hammer candle. However these daily signals can often be erroneous. But in any major multiyear breakout, post the breakout a retest of the previous resistance is often seen and stock prices go even below that breakout level and then reverse. Something similar seems to be happening with Symphony in my view. I would keep an eye on daily charts to spot any signs of strong reversal from the short term downtrend on daily charts. If stock price keeps falling, we have to keep an appropriate stop loss and take action.
9 Likes
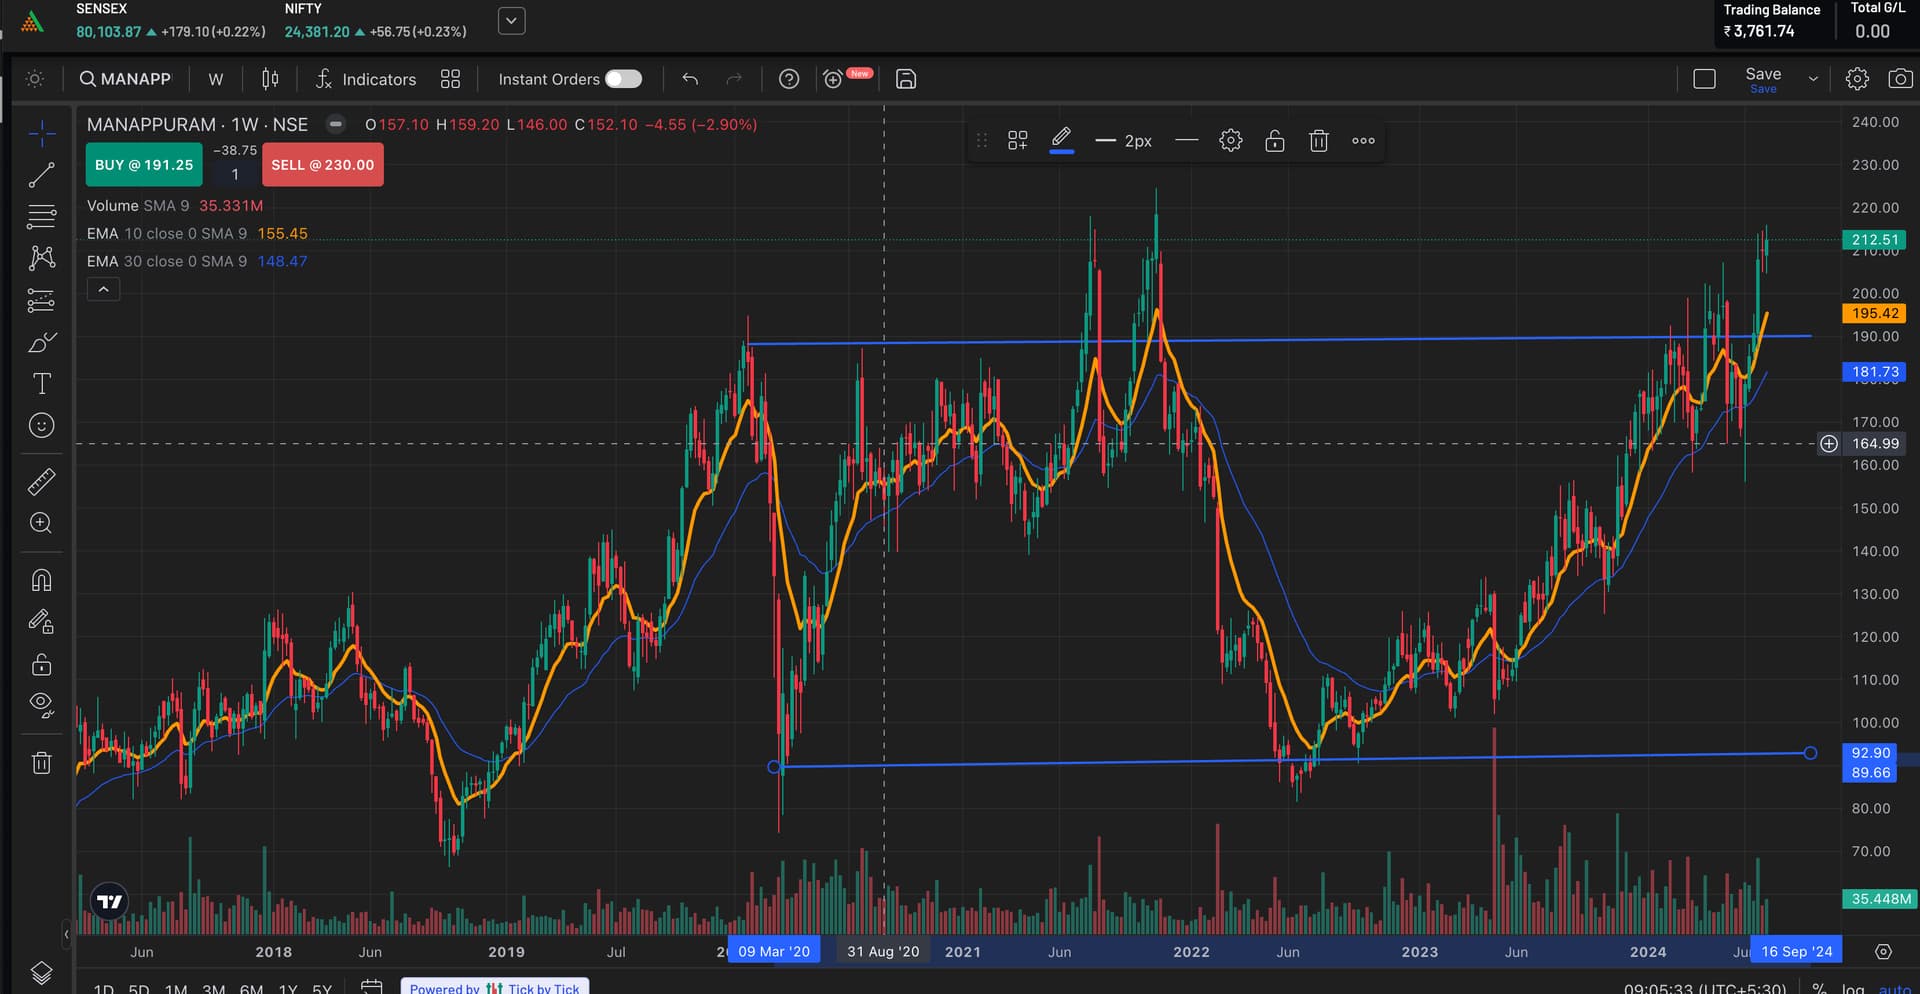
Manappuram is breaking out to its 4-year high. In the last year, the stock has given a 62% return. The current market capitalization (mcap) is ₹17,988 crore, and the total profit in the last 3 quarters is ₹1634 crore.
disclaimer 2.35% of my portfolio avg price is 200.
2 Likes
Sir wt is the best practice .or best way to reduce the Risk .retailer participants like us might be trapped in these kind of breakout setup for some time (it might be time correction or price correction or both no one knows ).
1-what are the main thing we need to consider to while entering to multi year breakout or
2-or All time High break out
personally am not holding symphony the one who enter @ 1200 level .the one who brought at Breakout only seen the high green candle with large volume is a buy .(he don’t have any clue who is exchanging, buyer is strong or not ).kindly give some insight about the same
1-which is working perfectly in some other stocks (may be 10 % ) to avoid such Trapp (not Trapp some kind of retracement but we don’t know how long it will last ) what should we do
2 Likes
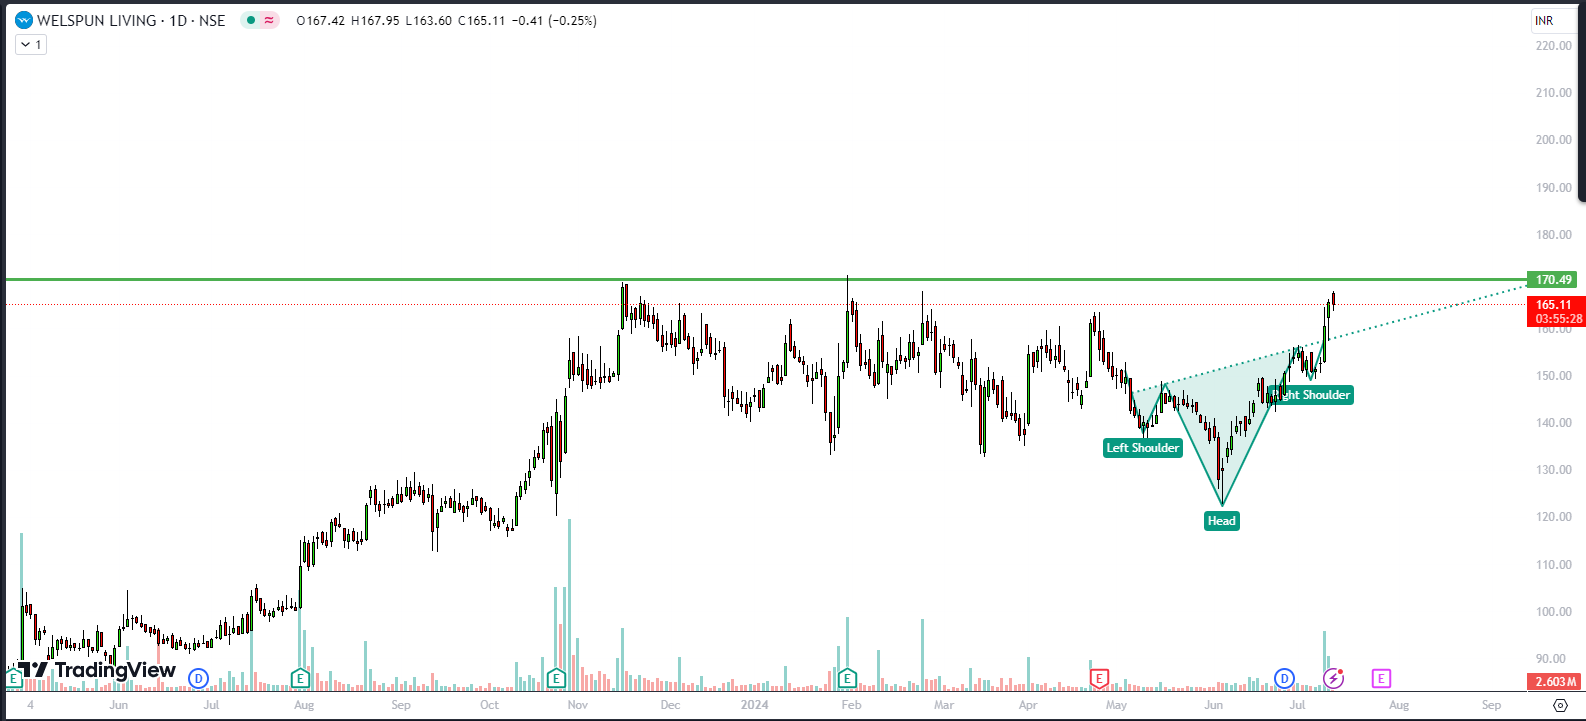
This is my first post on value picker, i came across this stock WELSPUN LIVING
The stock is near to 52 week high and also recently it broke short term inverted head and shoulder pattern .
in terms of returns stock has given 7.93 % on weekly 8.08 (3 months) 7.52 (6 months) which is indication that stock is trying to breakout from this level lot of time .
Also company planning to reach net debt zero till 2027 , as of now debt to equity is 0.58 .
apart from this stock is trading much lower than average industry PE
9 Likes
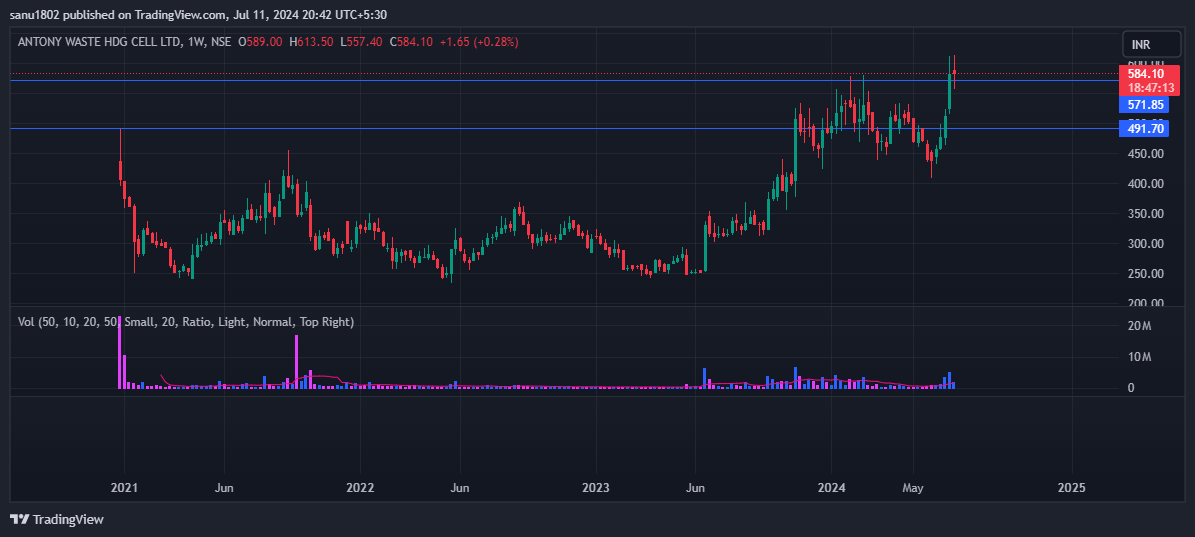
Antony Waste : Its ipo came in Dec-2020. Listed at 440 against IPO price of 315, made a high of 490 on listing day and then it was trading in the range of 250-420 for 3 years. Crossed IPO price in Nov-2023 but again go rangebound in the range of 440-560. Now, after almost 4 years of consolidation, it is trading above IPO listing day high and near high of last range. Some volume activity seen in last some days.
fundamental side, company has guided for 20% revenue cagr for next 2 years.
8 Likes
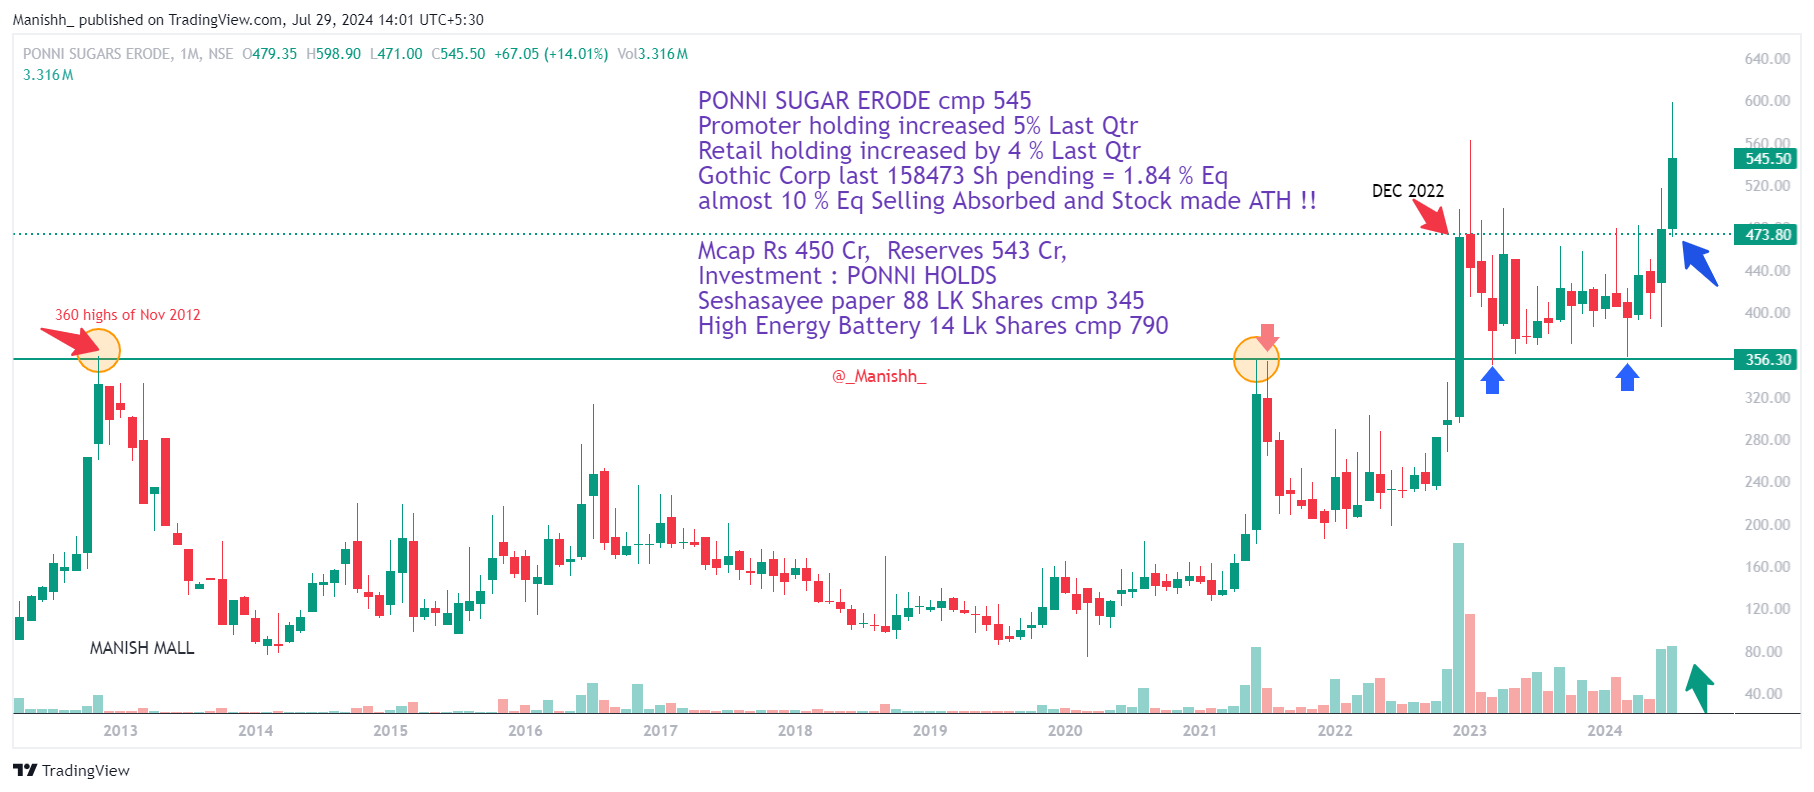
PONNI SUGAR ERODE cmp 545, perfect Breakout Retest and now Bouncing
Promoter holding Up 5% Last Qtr
Retail holding Up by 4 % Last Qtr ( HNI likely )
Gothic Corp last 158473 Sh pending = 1.84 % Eq
almost 10 % Eq Selling Absorbed and Stock made All Time Highs !!
Mcap Rs 450 Cr, Reserves 543 Cr, DEBT FREE Sugar Company
Investment : PONNI HOLDS
Seshasayee paper 88 LK Shares cmp 345
High Energy Battery 14 Lk Shares cmp 790
i had heard Sugar Sector has a history in new Breakout Cycle
NEW Stock gives biggest returns
this time likely PONNI , first sugar stock which touched Life Highs
Small Mcap + Small Equity + Low Float perfect Sweet Recipe
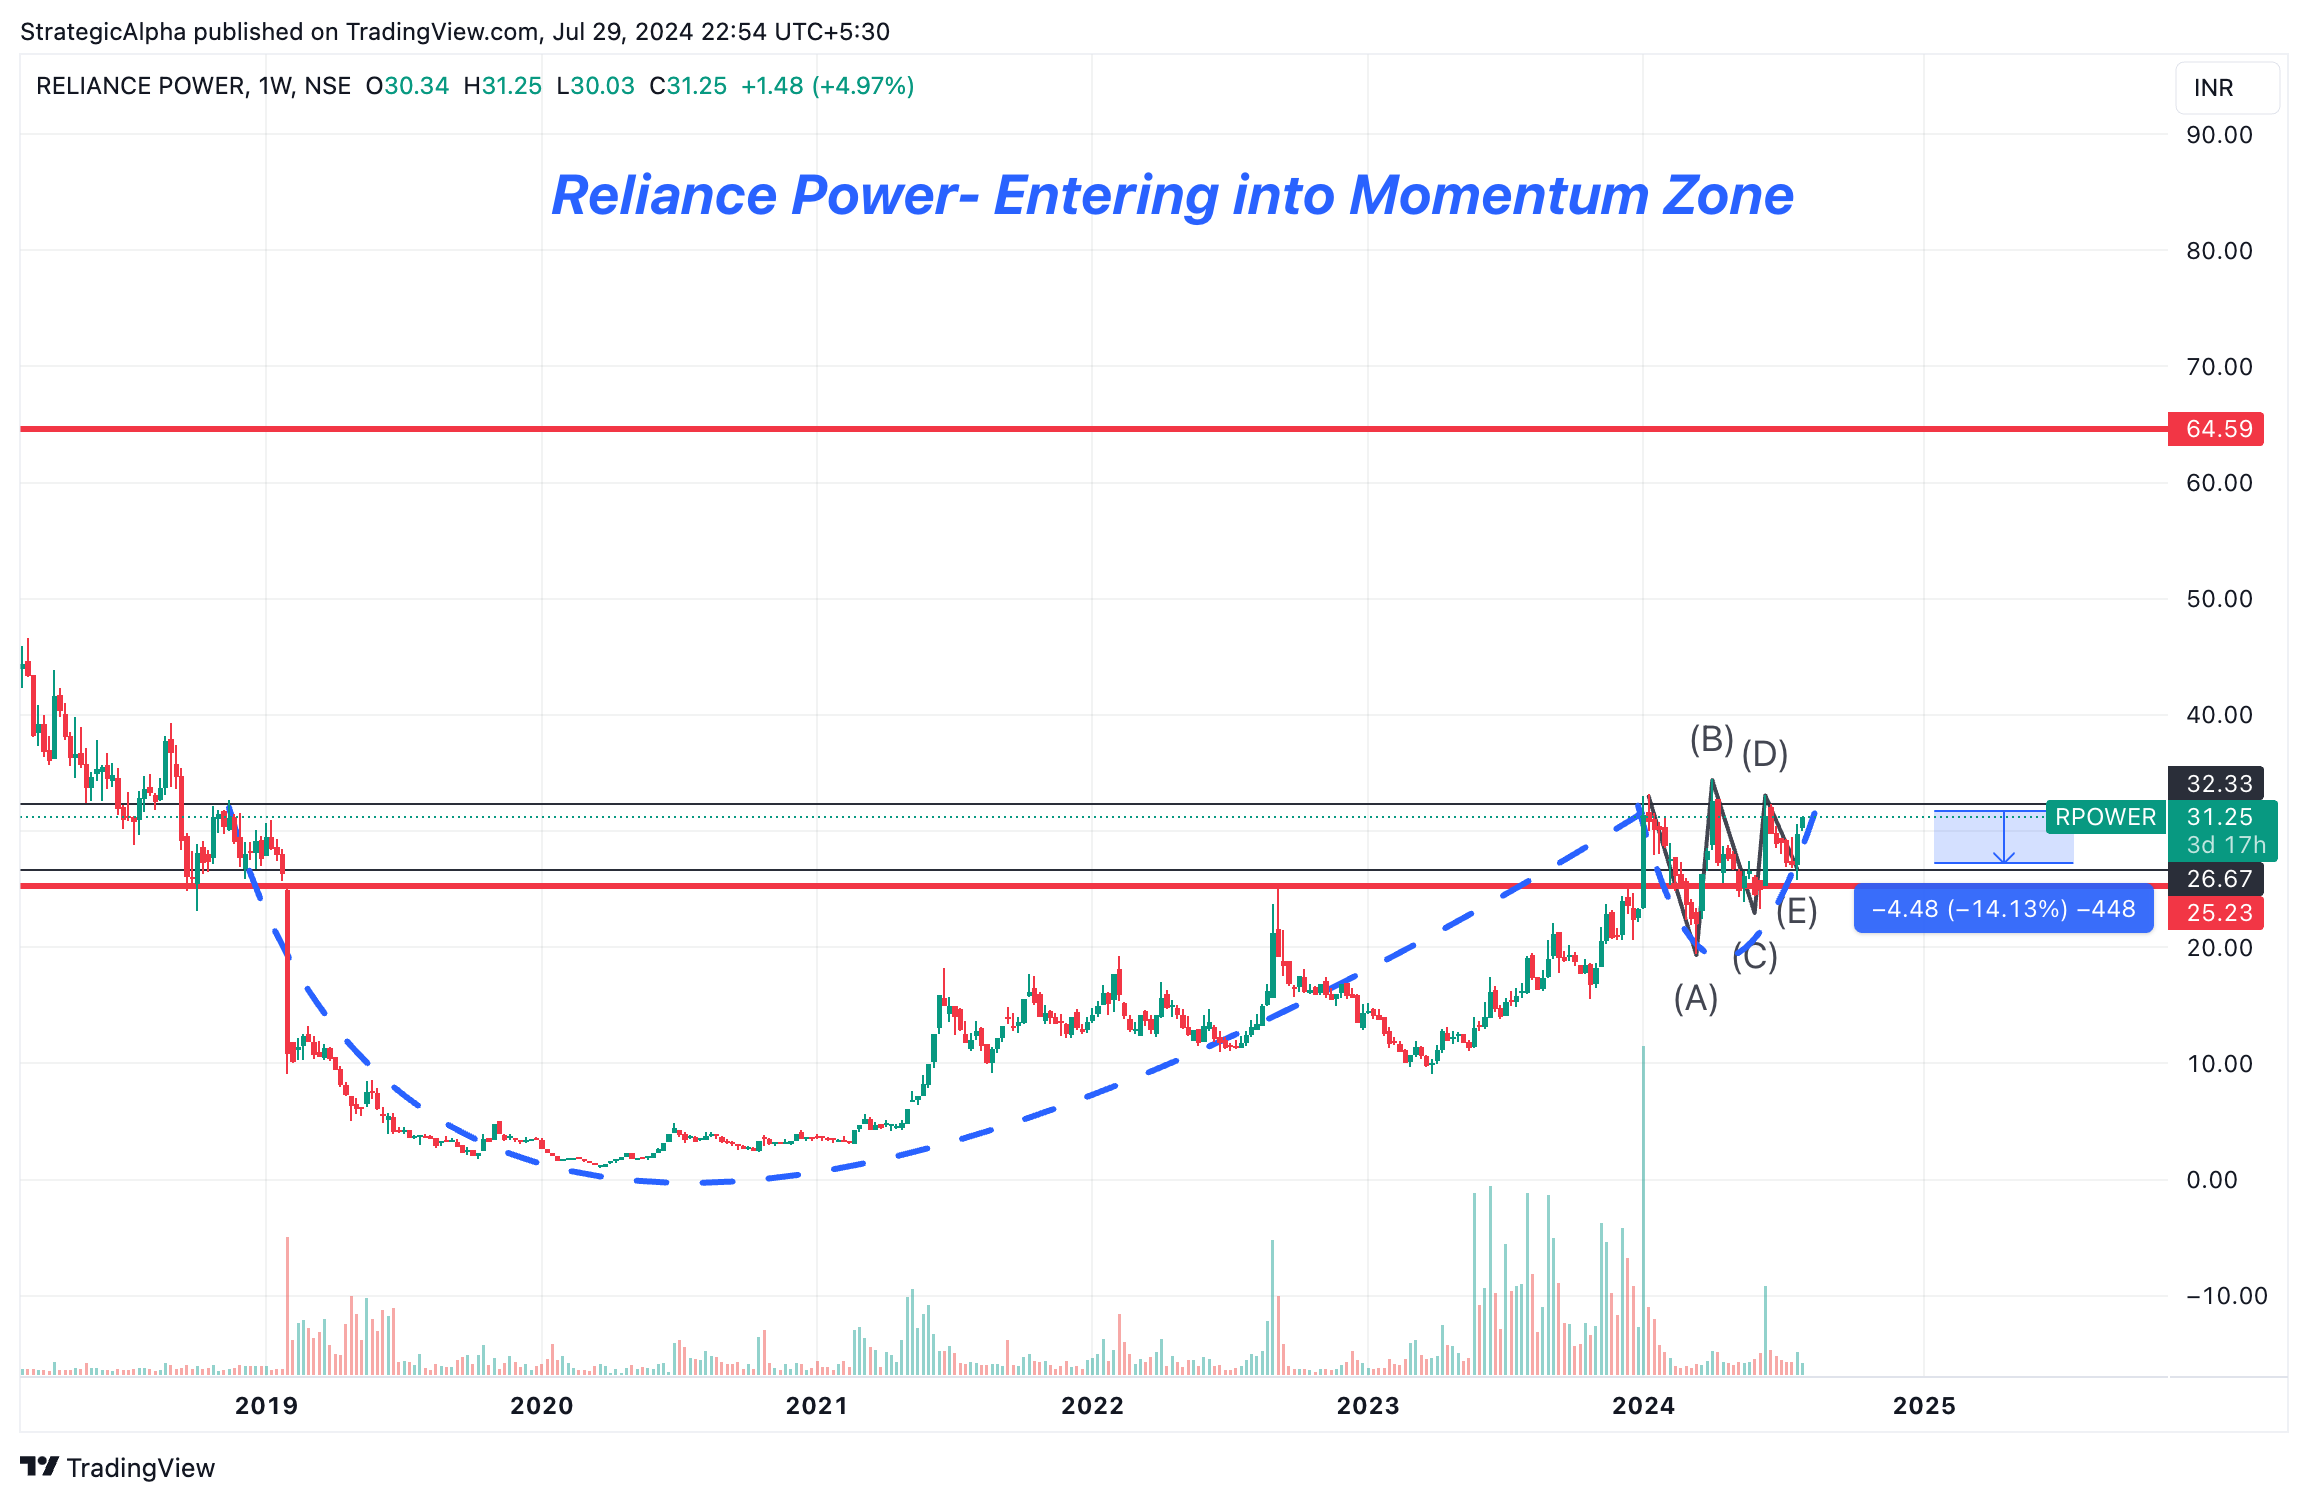
Reliance Power is Trading Near Fresh 52 Week High.
It Will Enter Into Momentum Zone Once it Crosses 32.5 on Weekly Close Basis.
32.5 Is a Breakout Point for a 6 Year Cup and Handle Breakout.
Over the Past 6 Months Stock is Consolidating in Range 20-30 Creating a Volatility Compression Pattern.
Power Sector Tailwinds.
Promotor Increasing Stake.
5 Likes
Wockhardt also looks interesting on both weekly and monthly charts. It is coming out of a 9-year-long downtrend. Monthly and weekly charts show a breakout of the double bottom 6 years in the making. Volume is also high!
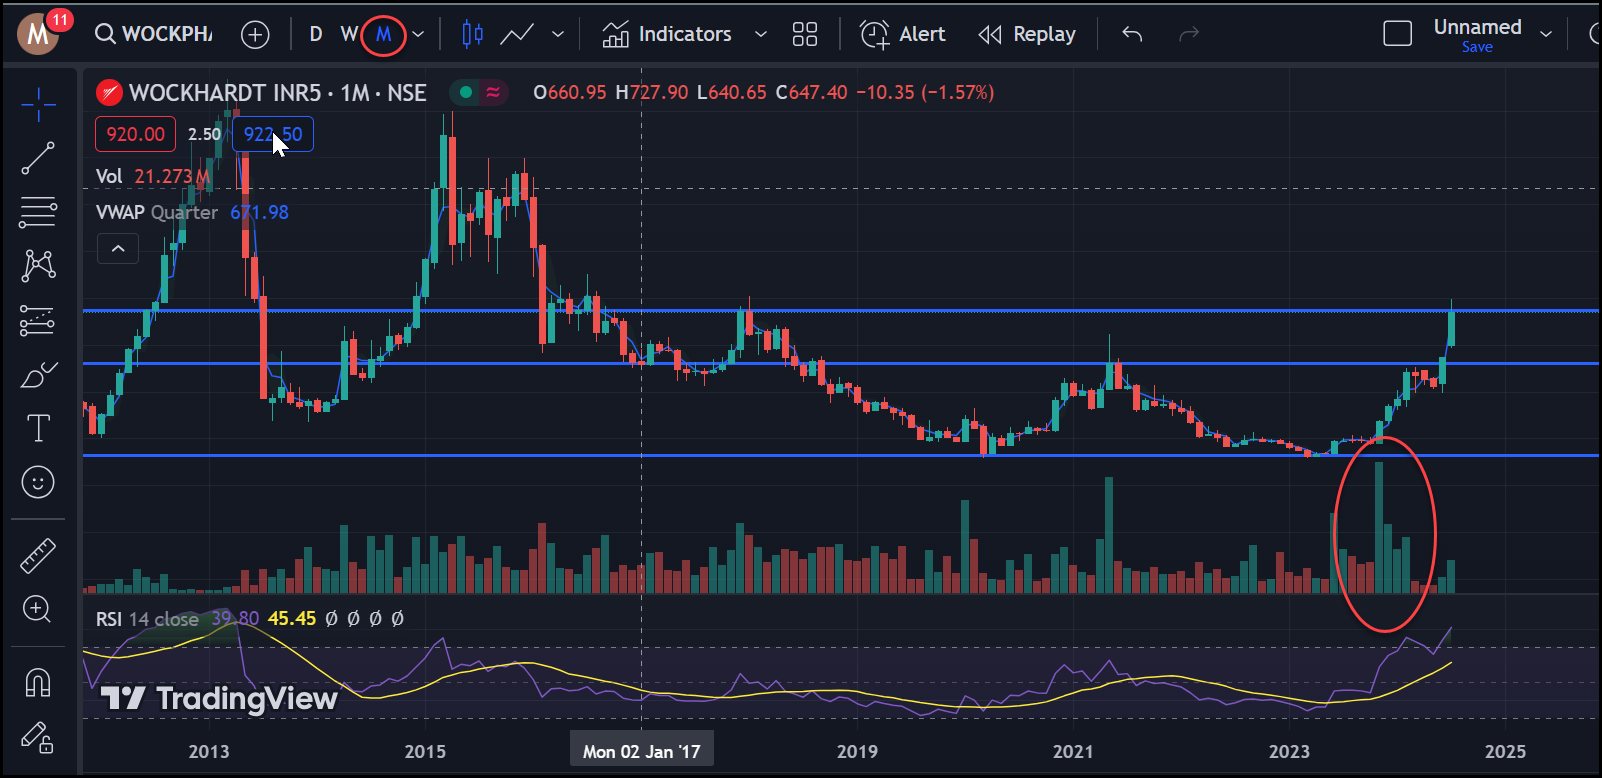
Fundamentally, the company is on the verge of successfully completing a stage 3 trial drug, WCK 5222. And not just any drug— a wonder drug!
Disc: Invested - small tracking position
17 Likes
Prakash Inds cmp 199 is showing interesting chart pattern. In the attached weekly line chart pattern,
-
On right side of chart, we have a flag/symmetrical triangle like consolidation marked in blue since Oct 2023.
-
Within above triangle, there is a smaller triangle shown in red color from which a breakout has happened.
-
At much lower levels there is another prolonged triangular consolidation marked in fluoroscent bold green color. It goes to show the importance to keep away while consolidation is going on because this kind of consolidation can keep going on for a long time (it went on from March 2021 to June 2023) , chewing up time and capital as well as mental peace.
-
Key resistance overhead marked is at 244 which happens to be a 6 year high weekly closing price. (note that on bar chart resistance levels will be slightly different from above level).
-
Overall structure is that of a rounding structure.
FUNDAMENTALLY, company has been posting steady numbers with quarterly EPS at or around Rs 5 per share since past 5 quarters. There has been marginal reduction in interest costs in line with reduction in debt on balance sheet.
Promoter holding has gone up from around 41% in Sep 21 to more than 44% as of now. Dolly Khanna and Mukul Agarwal feature in the public shareholders list since past four quarters. (though this should not be construed as an important investment argument)
Company has got approval for Bhaskarpara coal mines and as per their announcement, they will be able to sell coal in open market too in next quarter or two. That can add revenues and profitability besides providing some backward integration.
Company’s capex related to the mines and other capex is in commissioning phase.
NEGATIVES:
Promoter integrity has been questioned in the past. Pledging of shares by promoters.
Cyclical industry vulnerable to economic downturns and global events. Though past 5 quarter results provide some comfort on that aspect.
Disc: Invested based on technical picture and recent fundamental triggers, and cheap valuations. (this is not an investment advice, and anyone contemplating investment should do their own diligence. )

30 Likes
HBL Power broke out from a triangle/pennant consolidation in July 2024, at levels of around 530. Flag pole marked in solid blue line extends from 593 to 277, which is a distance of 316 rs. Adding that to breakout levels of 530 provides pattern target of 846, if pattern plays out.
The recent announcements of Kavach orders has increased visibility for HBL for next few quarters. Recent quarter results have been good inspite of there being not much contribution from Kavach. Battery segment continues to outperform.
disc: invested.

49 Likes
