EIL as you mentioned has played out exceedingly well. Stock price today reached around 149 levels. I was expecting some sort of resistance and hence consolidation between and around 120-130 levels, but buying force seems to be strong.
Personally I booked out profits, since the run up has been too sharp and weekly RSI is approaching overbought readings nearer to 90. ( however with these kind of animal spirits in price moves, things can go much beyond our expected levels) For me, this was a trade where price over reached targets for me and I was able to ride majority of my positions till the final selling)
Ideal thing to do would be to trail stop loss and keep riding, but I myself am not too good at the selling part of equation, and hence keep trying out various options in selling my positions.
Whatever is written in technical analysis books regarding selling ( or many other things for that matter) are based on observations over long periods of time. But the most important rule in markets is that it follows no rules. Hence we have to devise our own strategy.
Although this question was originally directed to @hitesh2710, I’ve been grappling with it for some time, and here’s what I’ve discovered that has proven to be highly effective for me:
It’s crucial to assess and consider every position within the portfolio comprehensively. As you pointed out, trailing the above position to its 200-day moving average would require waiting for the stock to drop below 100 levels, resulting in a 50 percent decline from its current level. While a 50 percent loss on a 2 to 5 percent position may not be significant, it can have serious consequences if applied to a larger position, say 10 percent or more, and could significantly impact the overall portfolio.
To make informed decisions, it’s essential to have a clear understanding of your average win rates and the biggest gains achieved in recent history. For instance, if your average gain per position has been around 25 percent, the law of averages may start working against you. In such cases, it’s essential to look for exit signals, as consistently improving the average gain percentage is crucial for long-term success.
What makes this particular trade a little confusing is my position was not only technical in nature but it was also backed by improving fundamentals (increased order inflow, revenue mix towards consulting revenue)
Hi @abhimanyu_gupta … double clicking on your statement related to improving average gain percentage.
I dont think i got the point clearly : Are you proposing that based on average percentage gain, i should start looking for reasons to sell? If that is the case, how would my average percentage gain improve since i would be on continuous lookout for sell after it has breached my threshold.
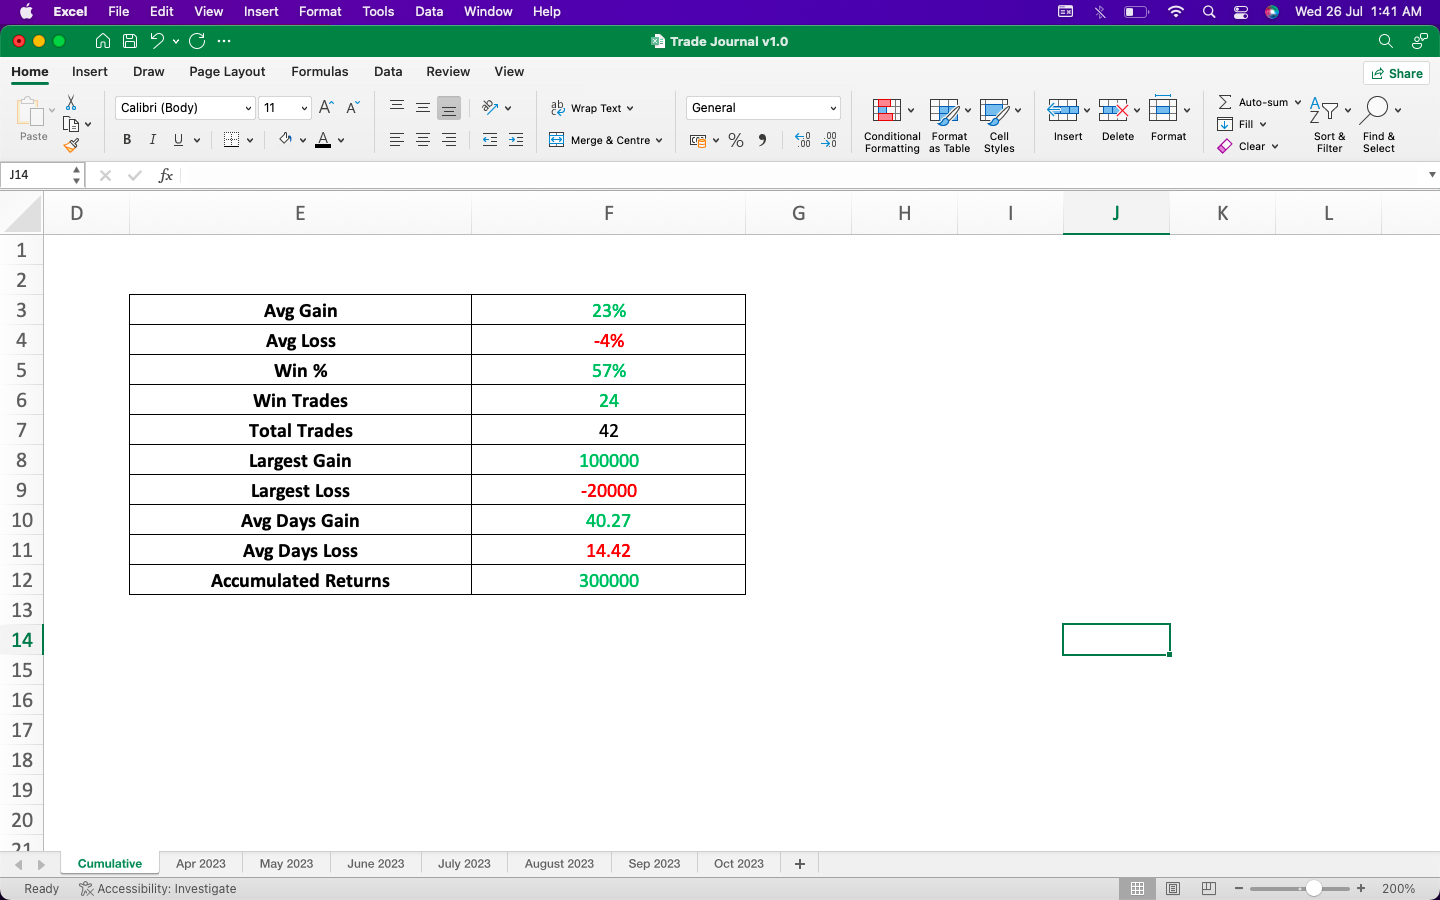
I apologize for any confusion. Let me provide a more detailed explanation. To achieve profitability in the stock market over time, it is essential to leverage mathematics in your favor. In the excel sheet above, various sections are highlighted:
Average gain: This represents the average percentage gain of all your winning trades.
Average loss: This indicates the average percentage loss of all your losing trades.
Win trades: The number of profitable trades you have executed.
Largest gain: The highest percentage gain achieved in a single trade.
Largest loss: The largest percentage loss experienced in a single trade.
Consistent profits in the stock market can be attained by ensuring that your average gain, win trades, and largest gain are consistently improving, while your average loss and largest loss should be decreasing.
This analysis is akin to a report card, measuring your performance metrics. Before selling a position, regardless of whether it is a gain or loss, it is crucial to consider how it will impact your performance report. Will it enhance or diminish your overall performance?
However, mathematics is just one of the factors to consider. Analyzing charts for selling signals is also important. These signals may include the price declining on relatively higher volumes, downward trends in moving averages (e.g., 20, 50, 200), and stocks closing below important moving averages. Every trader may have their own set of metrics for selling decisions, but the key is to look for one or more indicators that provide sell signals.
By combining the use of these indicators with the insights from your Excel sheet, you can make more informed decisions when it comes to selling. This approach is commonly used in swing trading, but there’s no reason why it cannot be applied to long-term investing based on fundamentals as well.
Sir - our personal experience in the cases of agressive and extended moves is to trail the price on 9 DMA .
In case of extended moves, where RSI looks overheated on all time-frames , trailing the price on lower DMA helps a lot.
Generally after a fast upmove ,the price starts moving in a range to cool down RSI , to come close to 20 DMA as well as to have a narrow the BB .
This can happen not only by the downward price movement but it can also happen by sideways movement in the price for sometime , this brings 20 DMA closer to the price as well as BB narrows down.
Yes one can always book profits as per his/her own comfort levels but we follow a practice of booking partial profits as like you said, price can go to any levels in a bull market and we don’t want miss a good ride. Currenly we’re trying to follow the same practice in Mazgaon where prices have gone beyond any reasonable levels.
Aarti drugs caused a brief flutter after the last quarterly nos surprised the markets. Stock price went up for a couple of days, after having gapped up and now seems to be cooling off.
Attached chart shows breakout above 52 week high line shown in red, and a gap up area on weekly charts shown in dotted blue lines and fibonacci retracement levels (in dotted green) of fall from top in Oct 2020 at 1026, to bottom of 315 made in March 2023.
One can make their own inferences from the chart. I have no positions, but have been keeping an eye on the chart out of academic interest. Will keep updating if there is anything interesting happening.
This is a moderated thread and we do not want to make it a commoditised thread by allowing questions like " how does the chart of XYZ stock look?" or something similar.
This is for those who find any charts interesting and actionable and can post their charts and observations to the benefit of those following the thread.
Questions related to specific stock discussed will be allowed but one has to make sure which company is being talked about, ( by clearly mentioning the name of the company in question) and also making sure that the post is relevant.
The whole purpose of this thread is to educate investors in the simple method of following the method described in the title of the thread. Ideally those reading this thread and wanting to follow it should preferably read any of the books like William O Neil’s " How to make money in stocks", “The Next Apple”, Mark Minervini’s books or prererably all of them. If these books are read and understood, its very easy to follow these charts and act on them and benefit from these kind of picks.
REC Weekly chart attached - this stock has also given a multi year breakout and had consolidated around breakout levels.
The consolidation was however short lived and 2 small symmetrical triangles were observed on weekly charts. Buying volumes have also been good.
On fundamentals side, P/B of REC is on the lower end of its historical average and some level of balancing was bound to happen. I was initially intrigued by its dividends, but later the chart also looked interesting.
There can be two possible trades in my POV for Aarti drugs. One I think when the stock closes above its multiyear resistance of 630. Another might be if the stock comes back to the gap up as support after few weeks. Volume supports the trend as well as RSI.
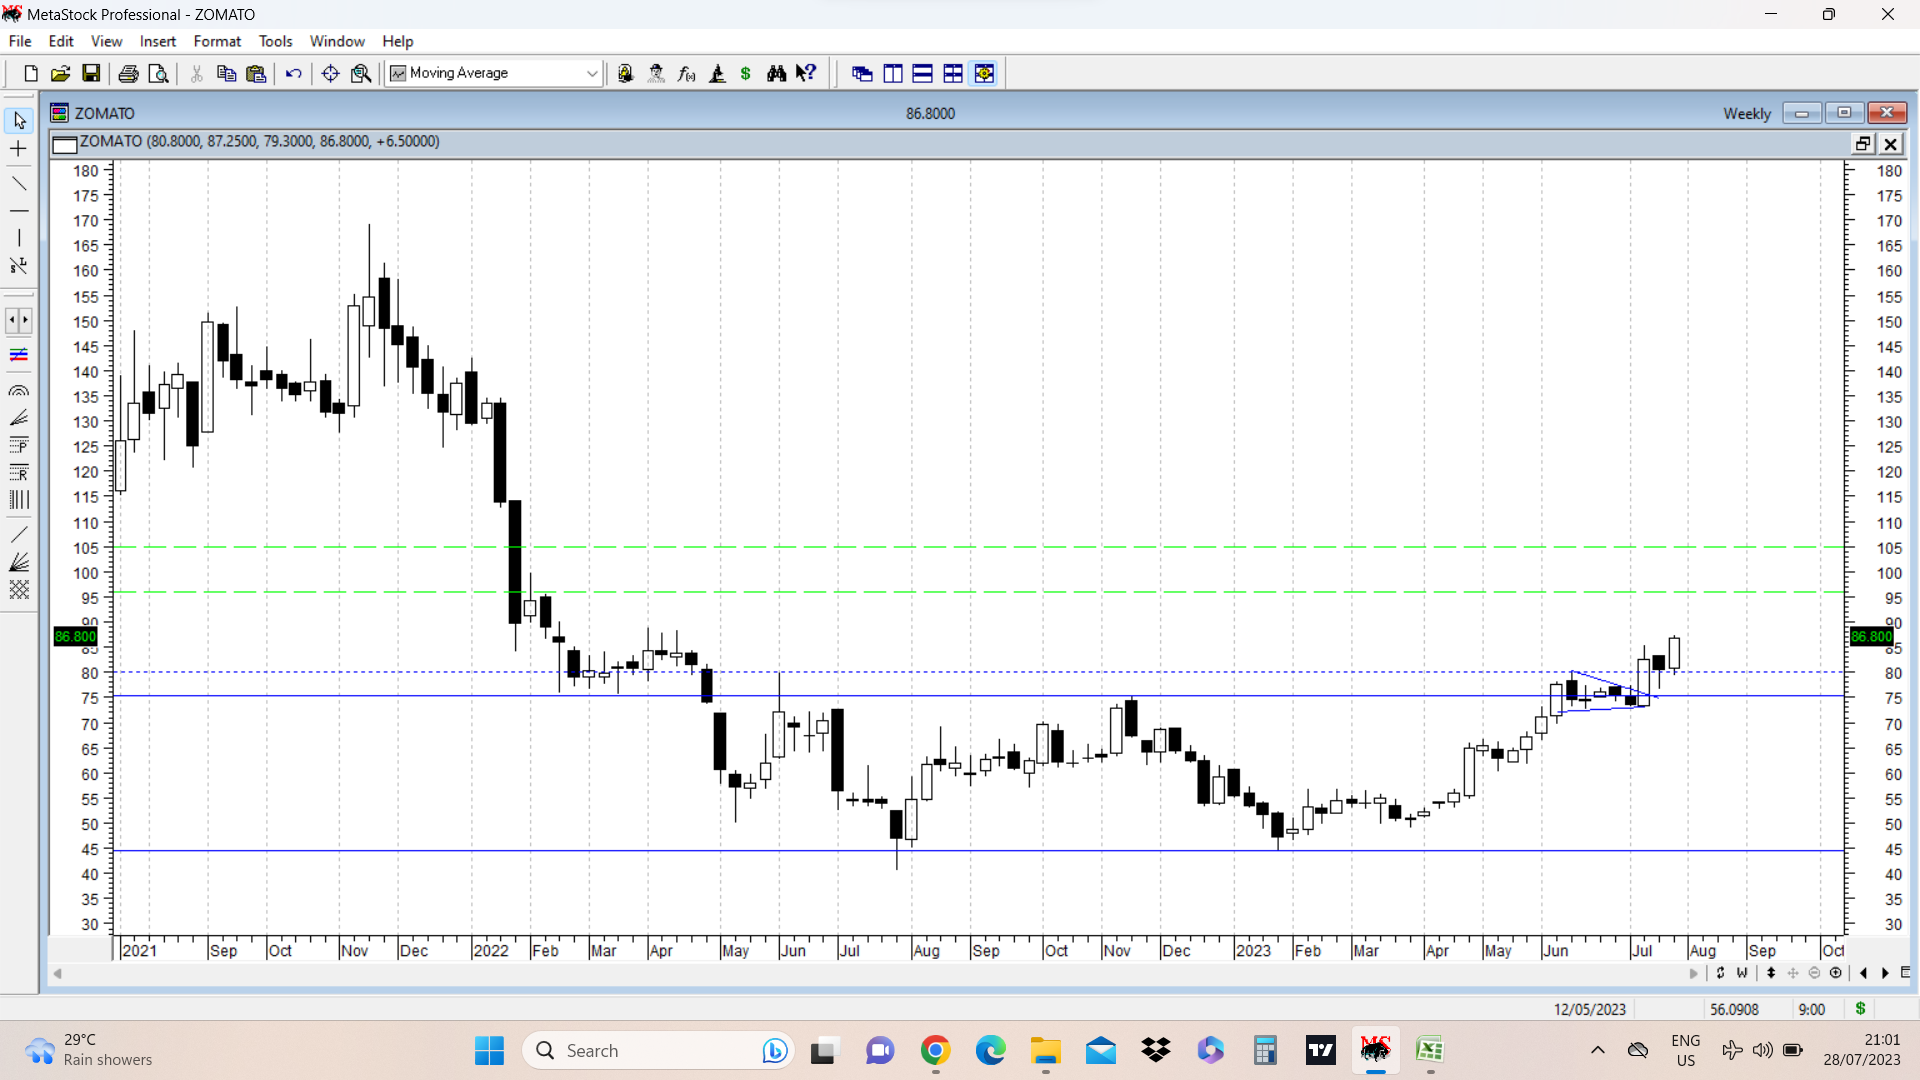
Zomato update. After its double bottom breakout, mentioned in above post, stock price went into a triangular consolidation lasting nearly 5 weeks (marked on chart) and then broke out with a big bull candle. Then another week of sideways movement was there and this week again it closed at a level above previous swing high. Potential target based on patterns marked in dotted green lines. disc: invested as disclosed before.
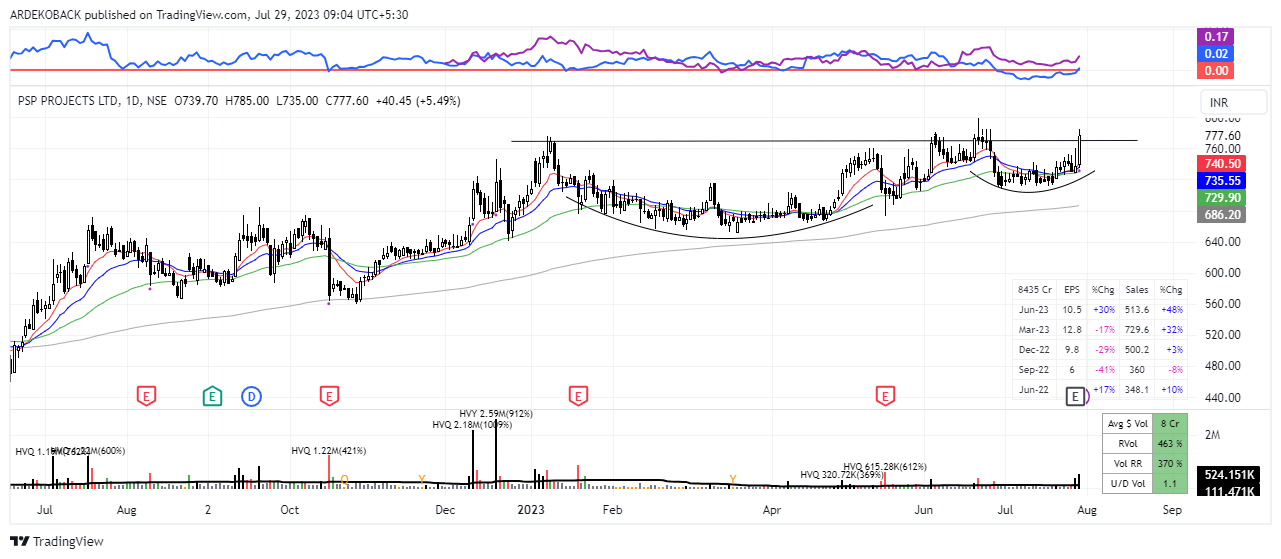
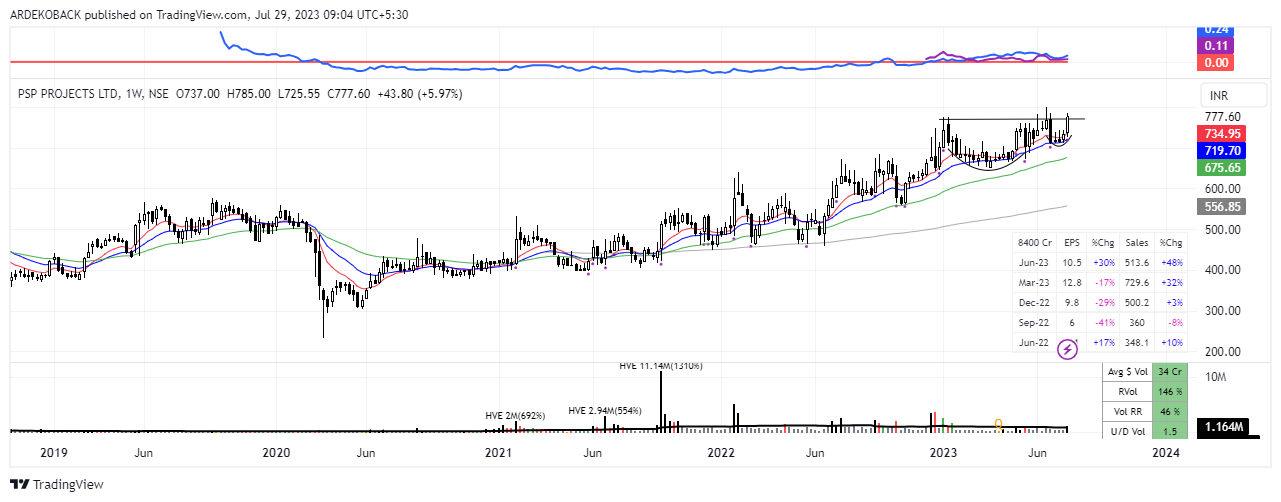
PSP projects had a strong closing on decent volumes, it also marked its highest weekly closing on the back of making higher lows.
The quarterly results were also decent especially the margin improvement finally coming in to which the management was guiding since few quarters on reasonable topline growth.
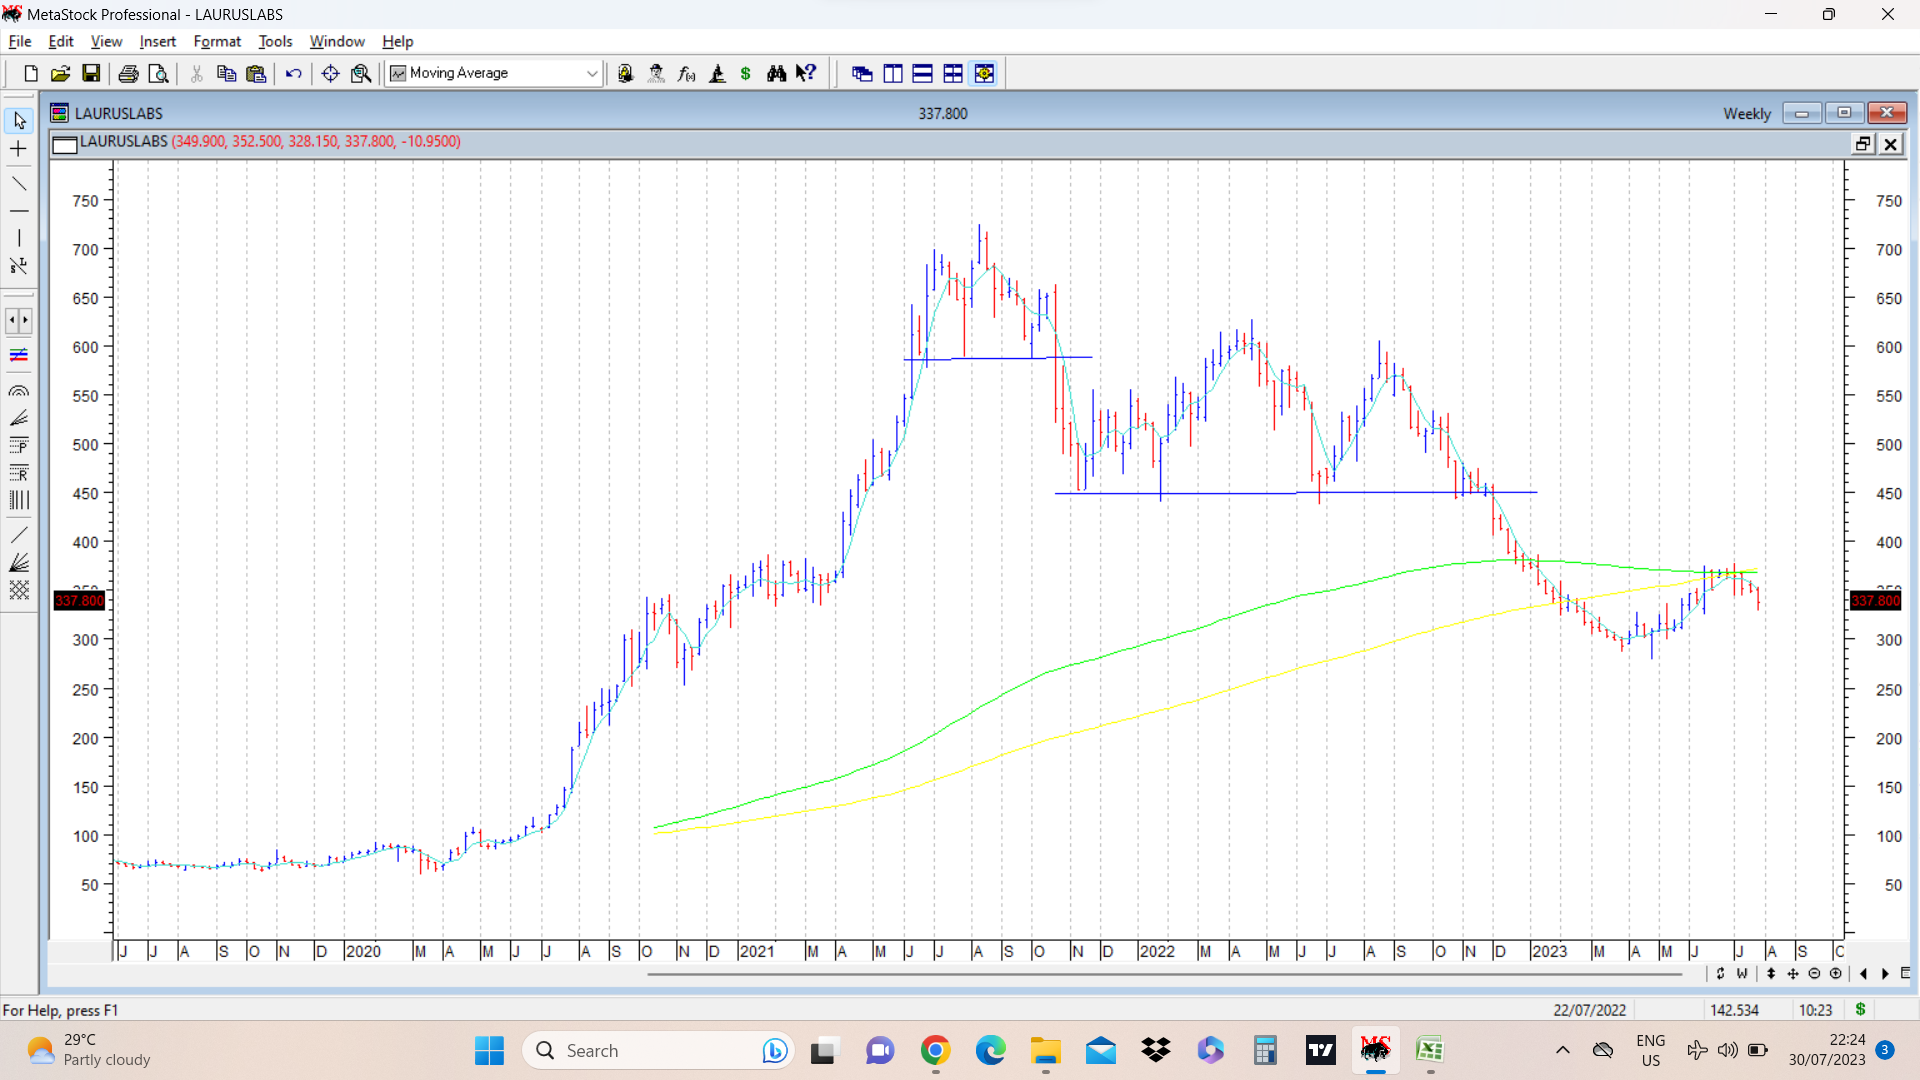
Revisiting an old post made back in October 2021, related to a bearish head and shoulders breakdown in Laurus Labs.
Actual breakdown is marked as in the post quoted. Another opportunity to exit (again marked on chart ) was clearly visible when stock price broke a crucial support of 435-440. ( another head and shoulders type of breakdown, though not as classical as the first one)
Prior to this bearish pattern, Laurus had gone up nearly 10 times ( in around 16 months) from levels of 70 in April 2020 to high of 723 in August 2021. With this kind of a run up, its easy to imagine that Laurus was the talk of the town, and everyone wanted to own it and many owned it too.
Typically what happens after such a sharp run up, the stock is over owned and a lot of positive news are baked into the price. There is very little possibility built in for bad news and practically none for sustained bad news. And when the real bad news start kicking in, the stock price suffers.
From levels of 589 at the first time a breakdown was hinted, back in October 2021, current price of around 338 is much lower though not alarmingly lower ( when we see stocks give up nearly 90% when bad news start flowing in). More important is the kind of opportunity costs involved. While Laurus has corrected for nearly 2 years now, a lot of other stocks have easily gone up nearly 2-3 times.
This kind of an example highlights the importance of opportunity costs.
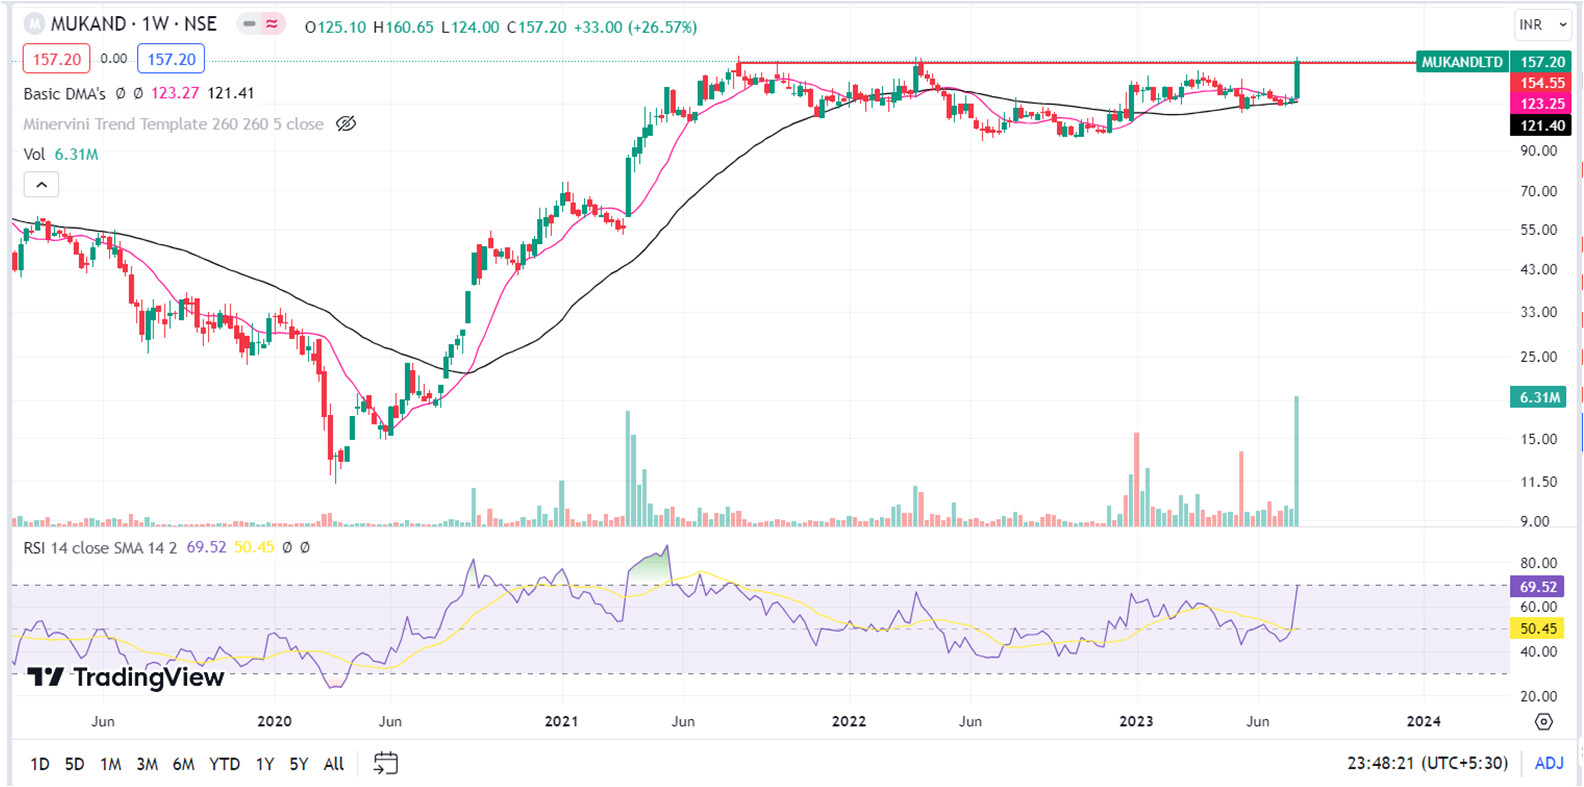
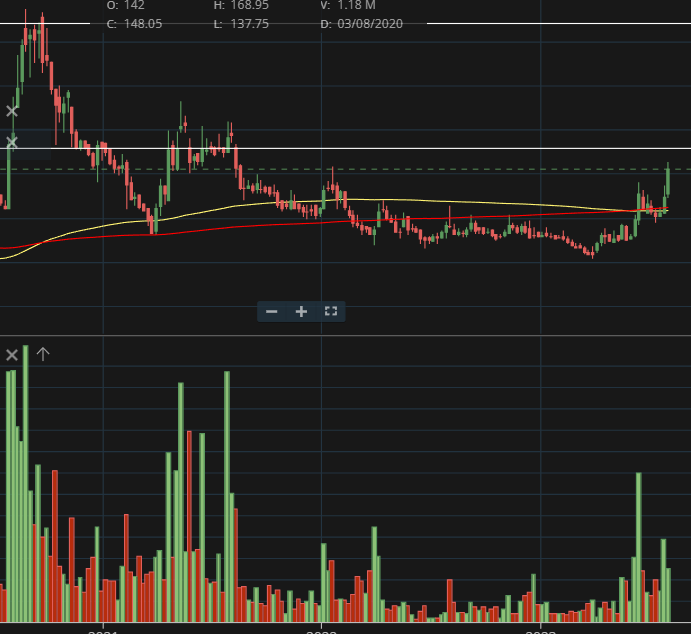
Mukand has broken above its long term resistance with high volume. Last time (Mar-22) it tested 160 level and went in correction. Overall, the steel sector is doing well, even though Mukand, like its peers, is highly cyclical.
Putting up weekly chart of Anuh Pharma - another 52 week high candidate stock
It broke its downward trend convincingly and has now broken out of cup and handle pattern with good volumes. First target of 140 seems on the cards.
Disc : invested
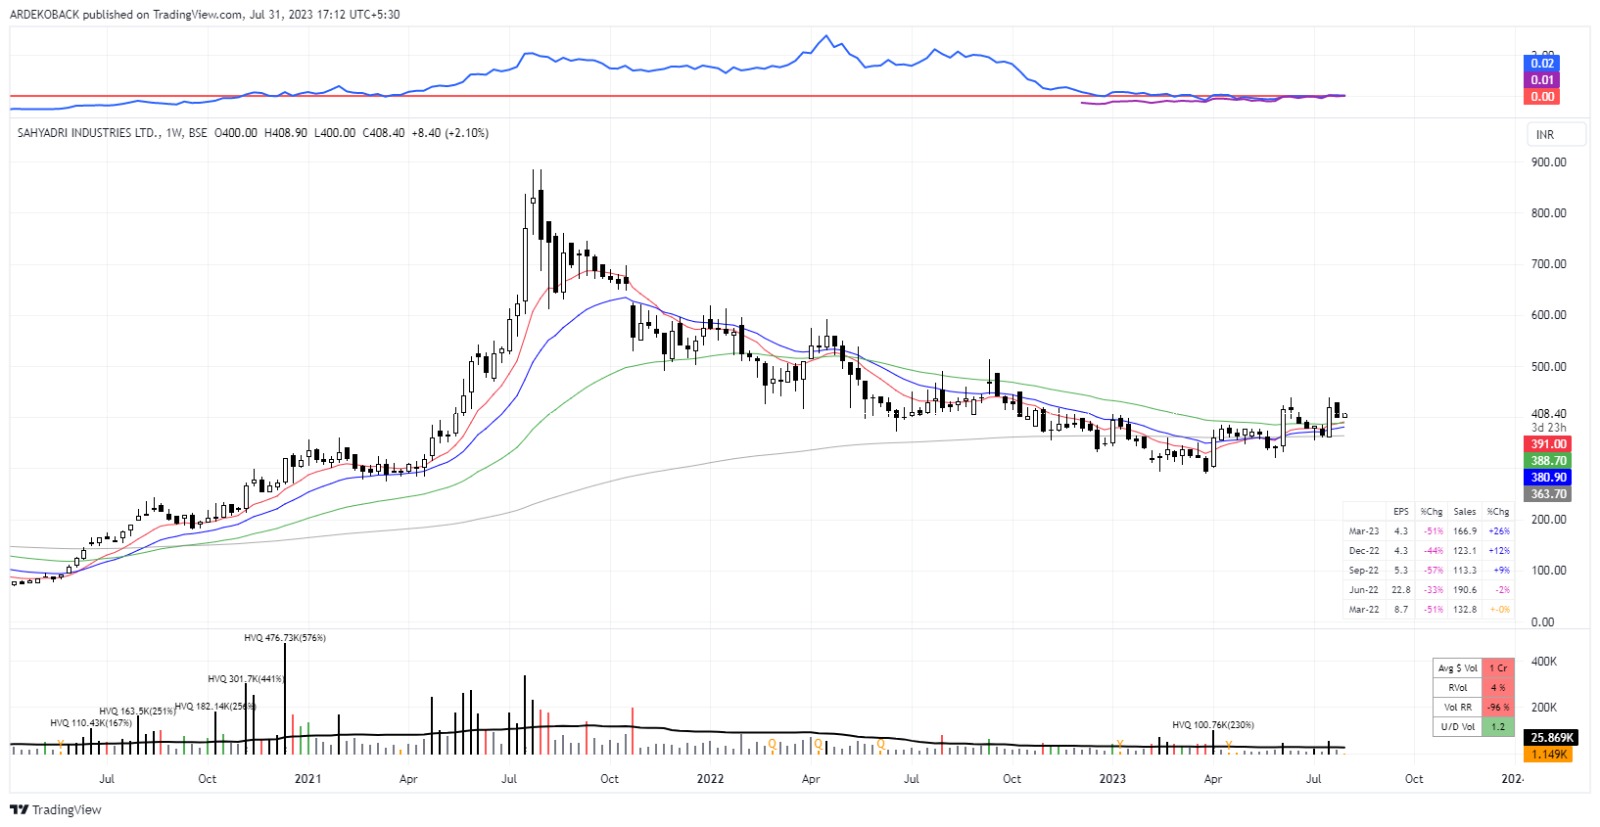
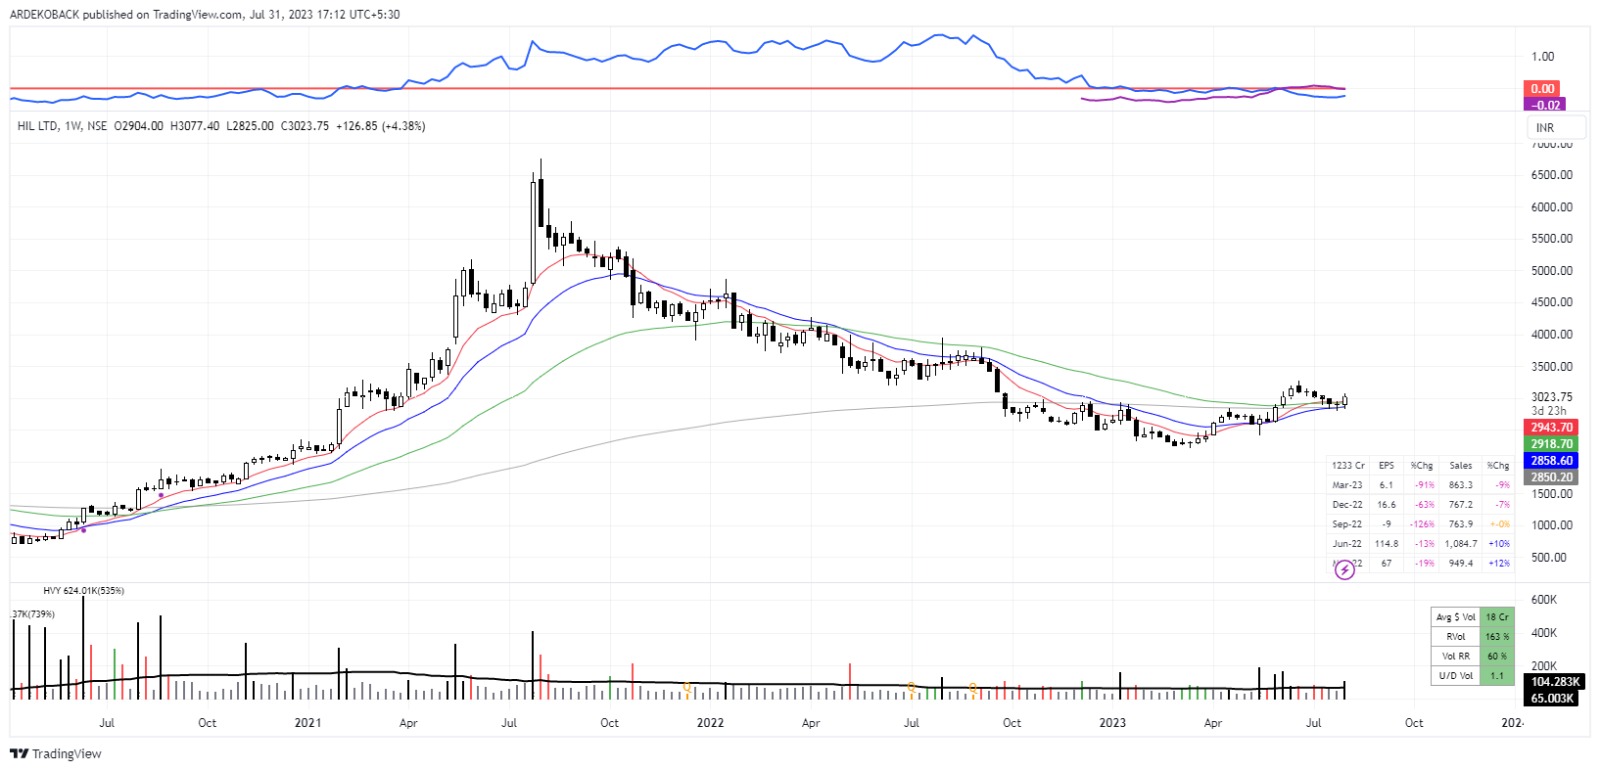
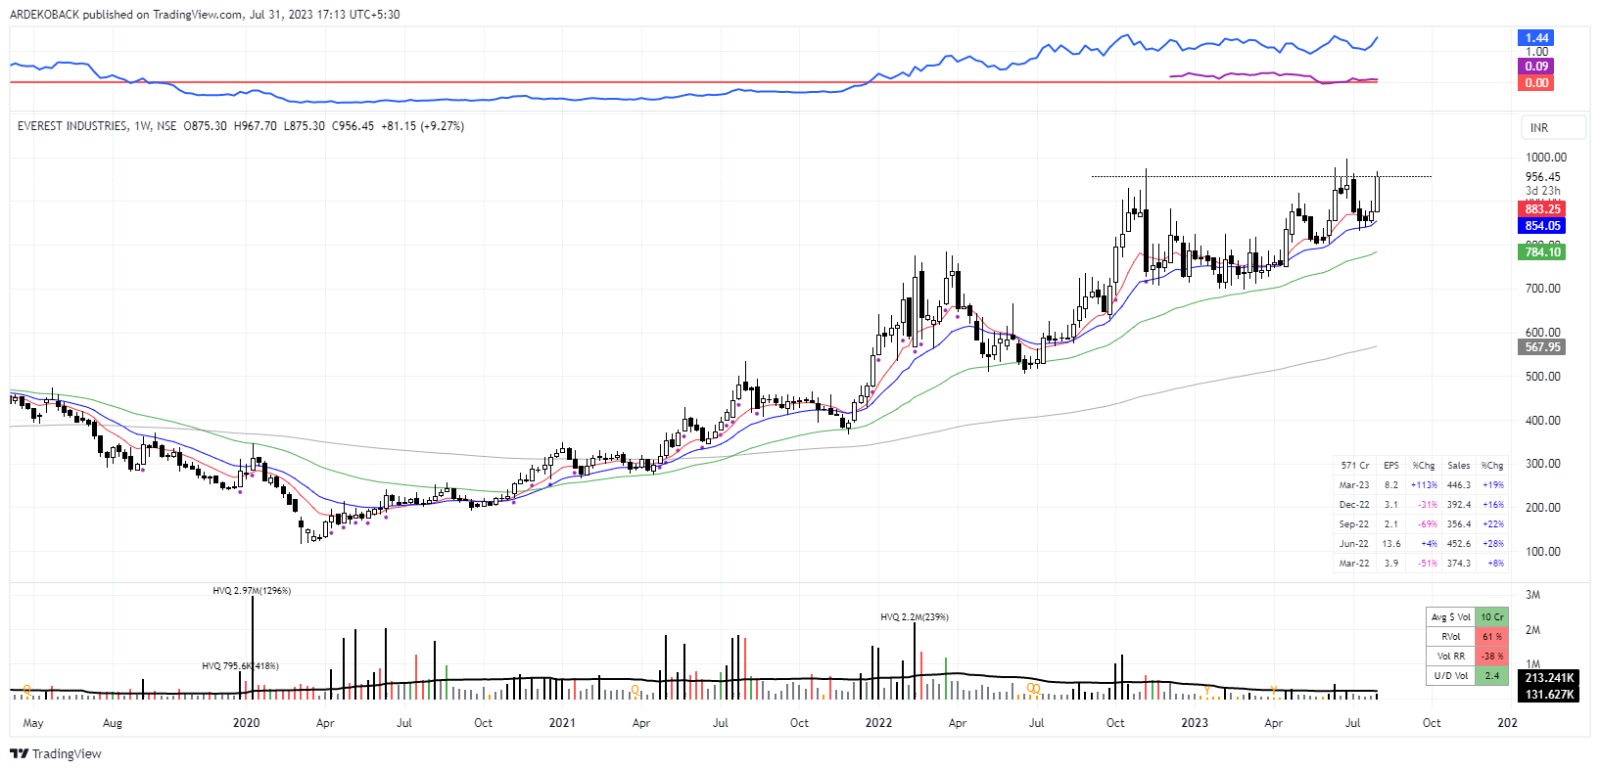
Asbestos sheet manufacturers under focus. Attaching weekly charts for Everest, HIL, Sahyadri & Visaka.
HIL results indicated the pressure on asbestos segment has started to reduce resulting into margins improvement.
Stock to Focus - Everest Industries, since the time the pressure on raw material prices of asbestos have begun other 3 players have halved from their tops whereas as Everest has doubled indicating leadership characteristic and immense relative strength.
In the meantime there has been management change + more capacity expansion focused on pre - engineered building segment. Also pre-engineered segment recorded best realization for FY23. With pressure easing on asbestos side operating leverage will kick-in.
MIT (Kenneth) has also acquired almost around 10% in company.
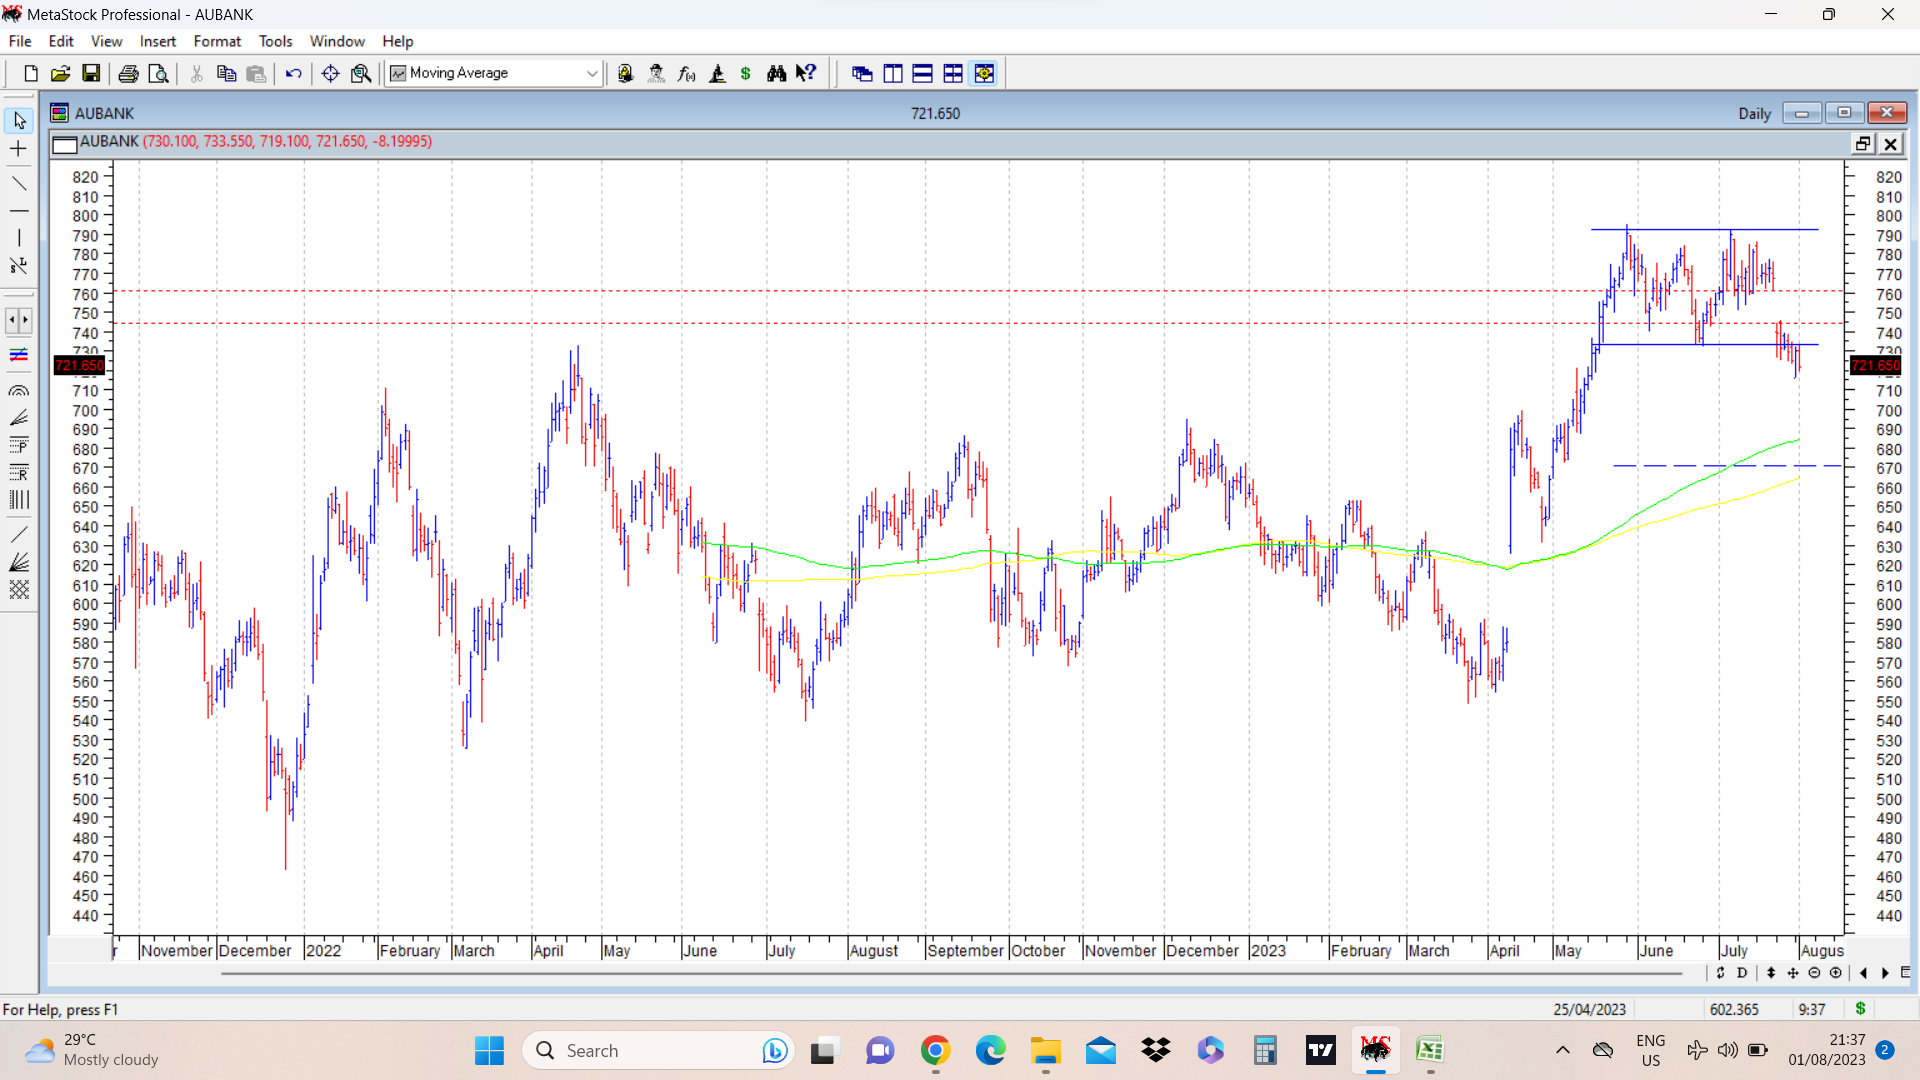
In this roaring bull market, its rare to see any bearish pattern. Came across a short term double top pattern breakdown in AU Small Finance bank. Pattern marked on charts by two blue solid lines. Also note a falling gap between 761 and 744 marked in dotted red lines. Pattern target marked at 670. I am not too sure whether this pattern will play out and targets will be achieved or pattern failure will be seen. Charts put up for academic interest. disc; No positions.
NBCC chart was posted back in April 2024 as a potential medium term breakout as shown in above post. The stock price since then has been facing stiff resistance between 43-45 range (marked in solid red lines) and in last couple of days managed to break out above this range after nearly 6 months . Today it retested the breakout zone. The pattern also resembles an ascending triangle breakout.
Need to see how the retest phenomenon goes and whether the rally resumes after a brief pause. This has been one of the tiring stocks, which has taken a long long time to provide a breakout. Management commentary in q4 fy 23 concall remained bullish. Plus the PSU companies sectoral rally is on in full swing.
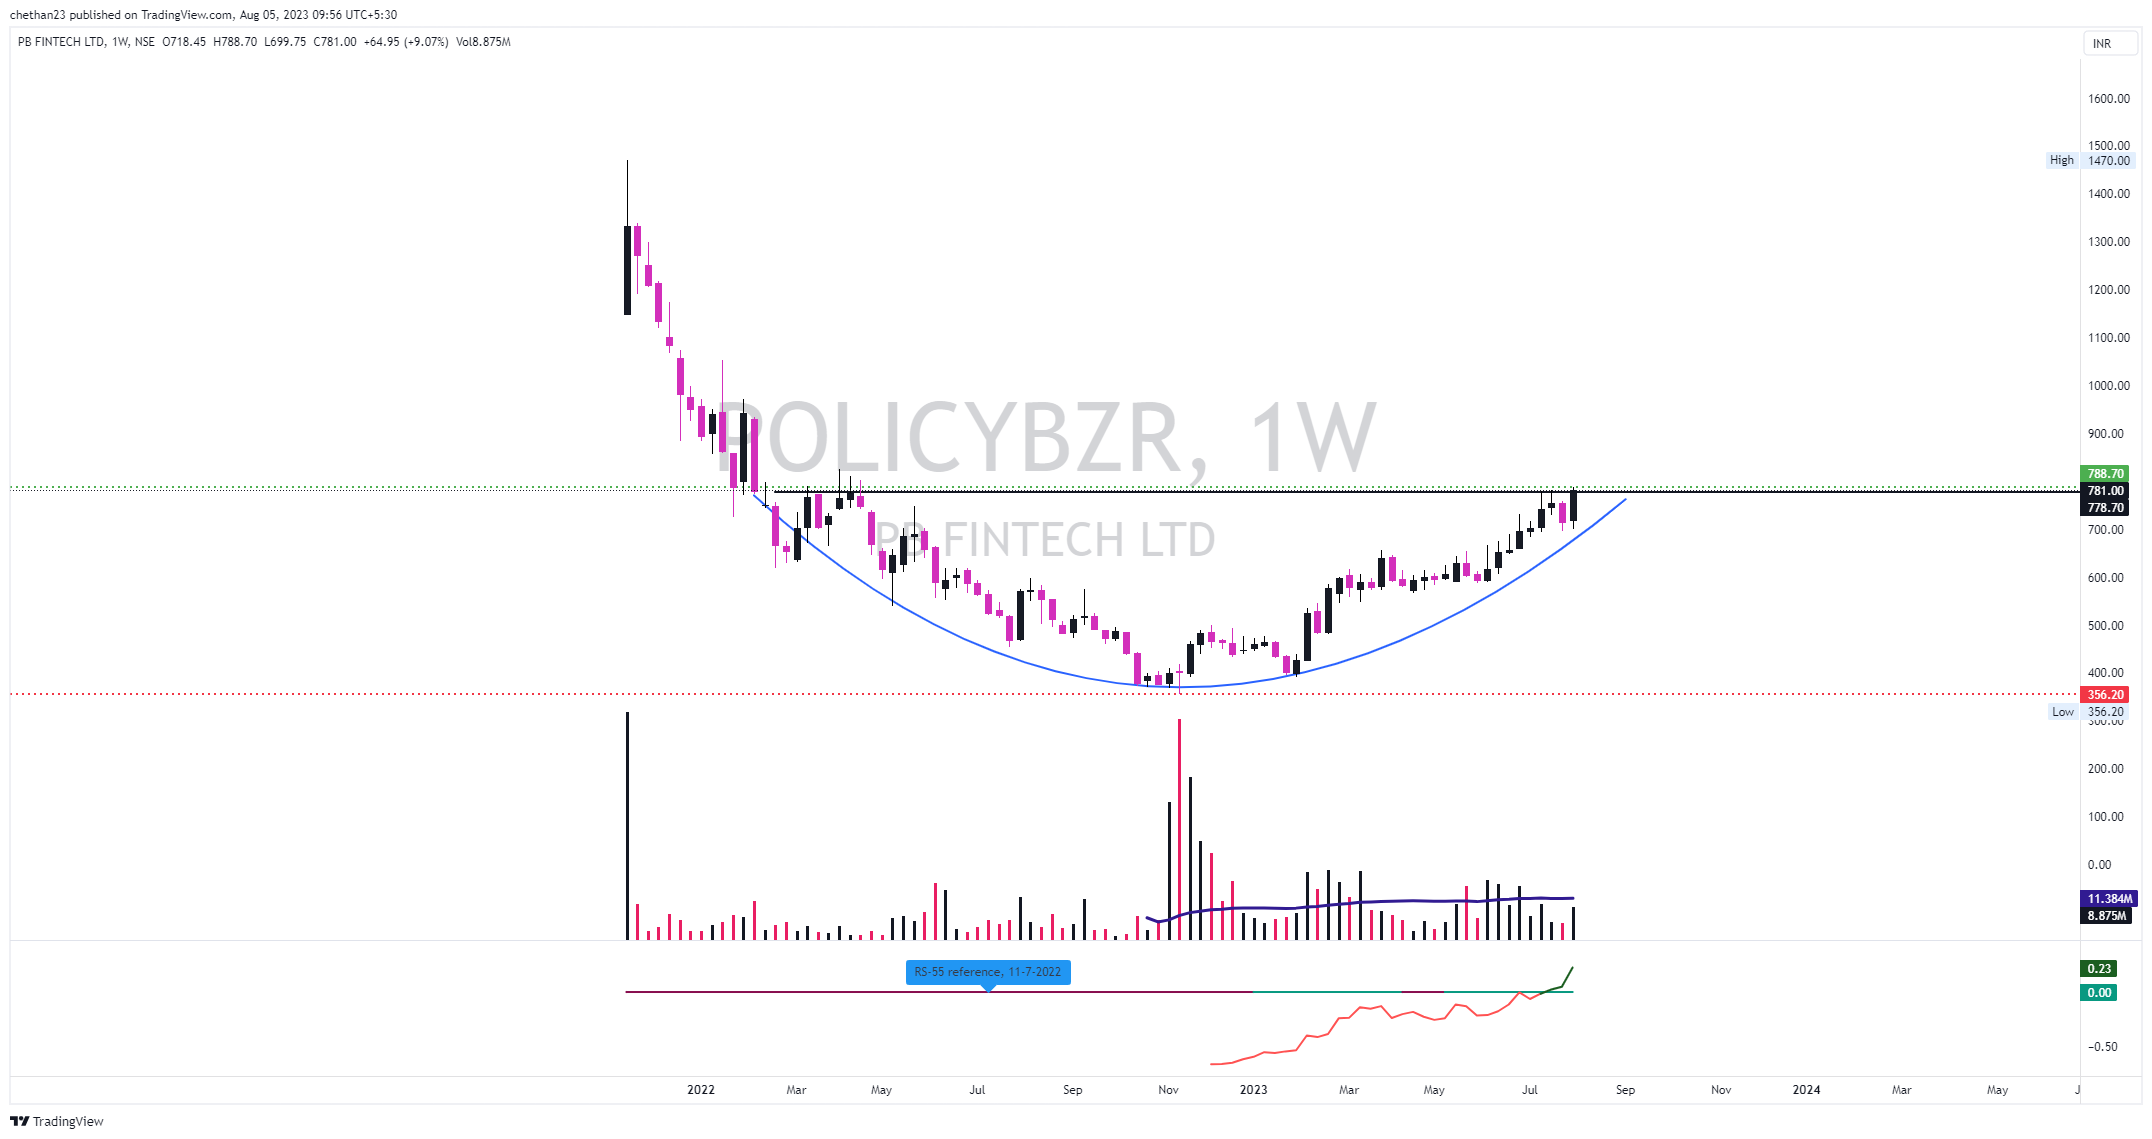
PB Fintech (Policy Bazaar), weekly chart, after a fall now price seem to be consolidating and forming rounding bottom, price near 52 Wk high, within the consolidation buy candles can be seen with supporting volumes, I remember @hitesh2710 ji mentioning about the rounding bottom, dear sir does this qualify the same