
Policybazar chart is an example of early stage rounding bottom. 30 WEMA also has turned up. Weekly chart looks good. Monthly charts, we do not have any data to conclude.
10 Likes
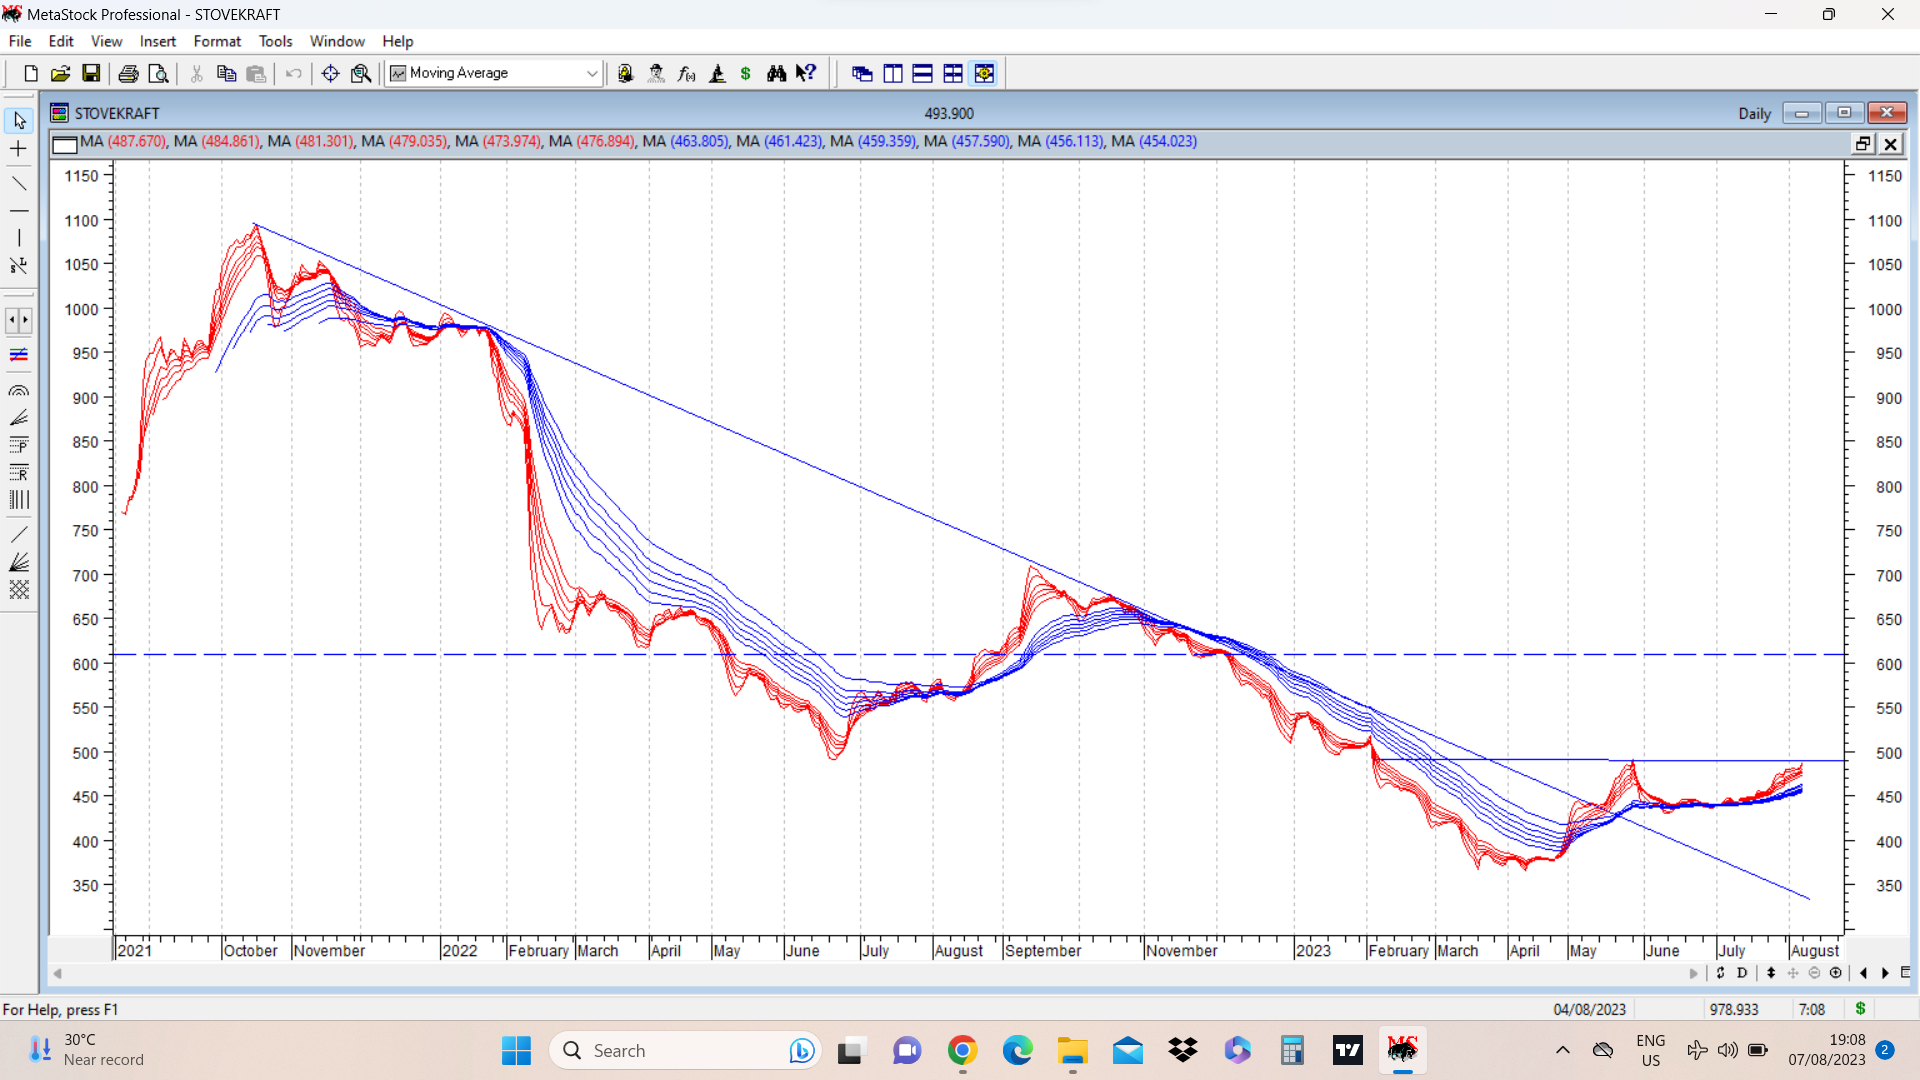
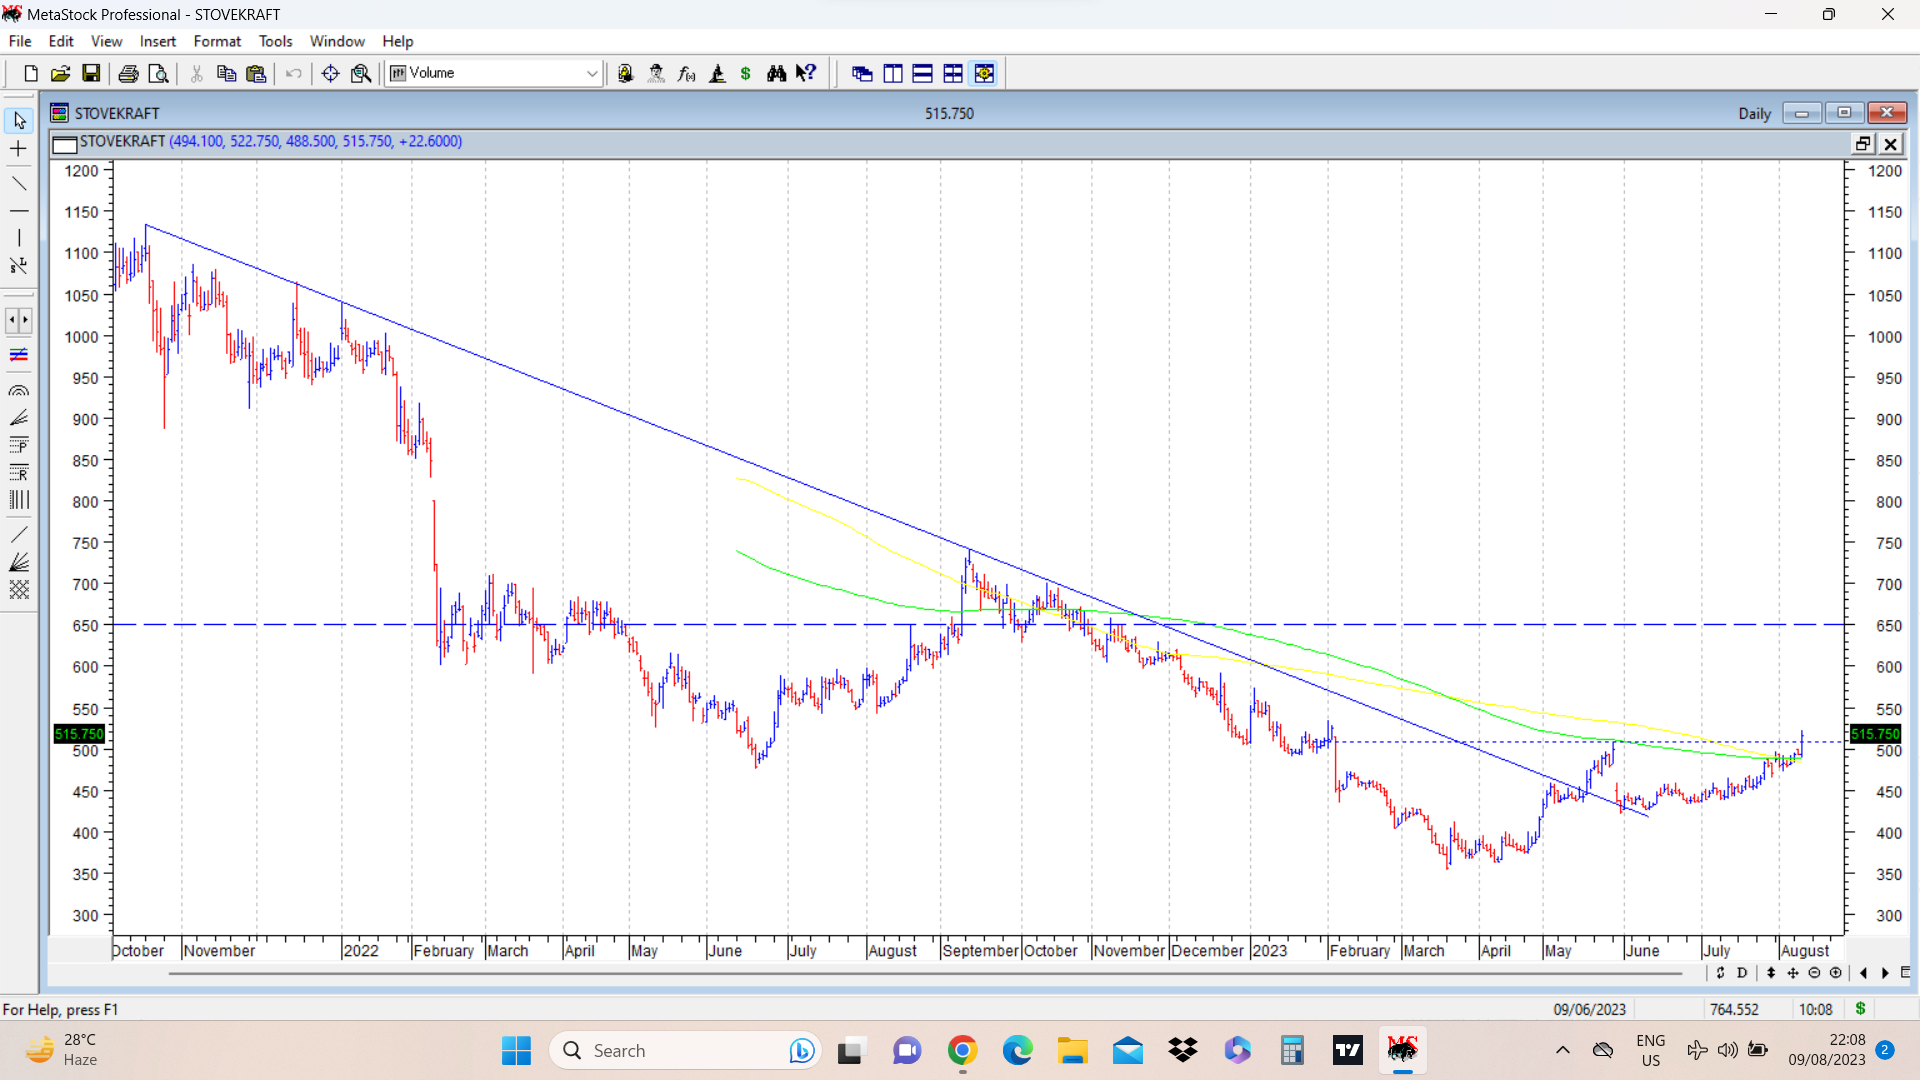
Stove Kraft ( cmp 493) listed in August 2021 at around 780-800, went up to 1100 levels in October 2021 and since then has been in a consistent downtrend, and posted a low of 353 in March 2023 and since then seems to be attempting to come out of the woods. Recently it posted a swing high of 507 in May 2023 and then gapped down, and consolidated between 425 to 460 for a few weeks. After many trading days it has today managed to close slightly above 200 dema at 488. 30 WEMA is at 467.
On the GMMA charts it has formed a cup and handle pattern and seems to be breaking out of it. A simple trendline drawn from the top and joining subsequent lower tops shows stock price has broken out above falling trendline and now breaking out of a cup and handle . Potential targets, trendlines, necklines etc all marked on charts.
Fundamentals wise, company has given out presentations and does regular concalls ( material for doing research is available aplenty. Plus a look at its brand products on flikpart or other e commerce sites gives an idea about its products) . Basic premise is its a predominantly kitchen appliances company, also venturing into LED products, and modular kitchens etc. Enterprise value is around 1800 crores ( 1630 crores market cap plus nearly 170 crores net debt) Sales in FY 23 was at nearly 1300 crores. Its a company available at an EV to sales value of around 1.3. The thesis here could be reversion to mean in terms of margin improvement. Company has done backward integration into foundry in an attempt to have control on costs. If margins improve along with improvement in sales ( management has given an aspirational target of 2000 crores sales in next few years) , this is a company that can provide good returns.
Since this is a turnaround kind of a scenario, I have taken a starter position, based on the charts formation and will evaluate my positions going forward. Since the position is a small position, it gives me flexibility to add or reduce my positions as the situation unfolds. (This is not a recommendation and anyone contemplating investment should do their own diligence.)
45 Likes
4 Likes
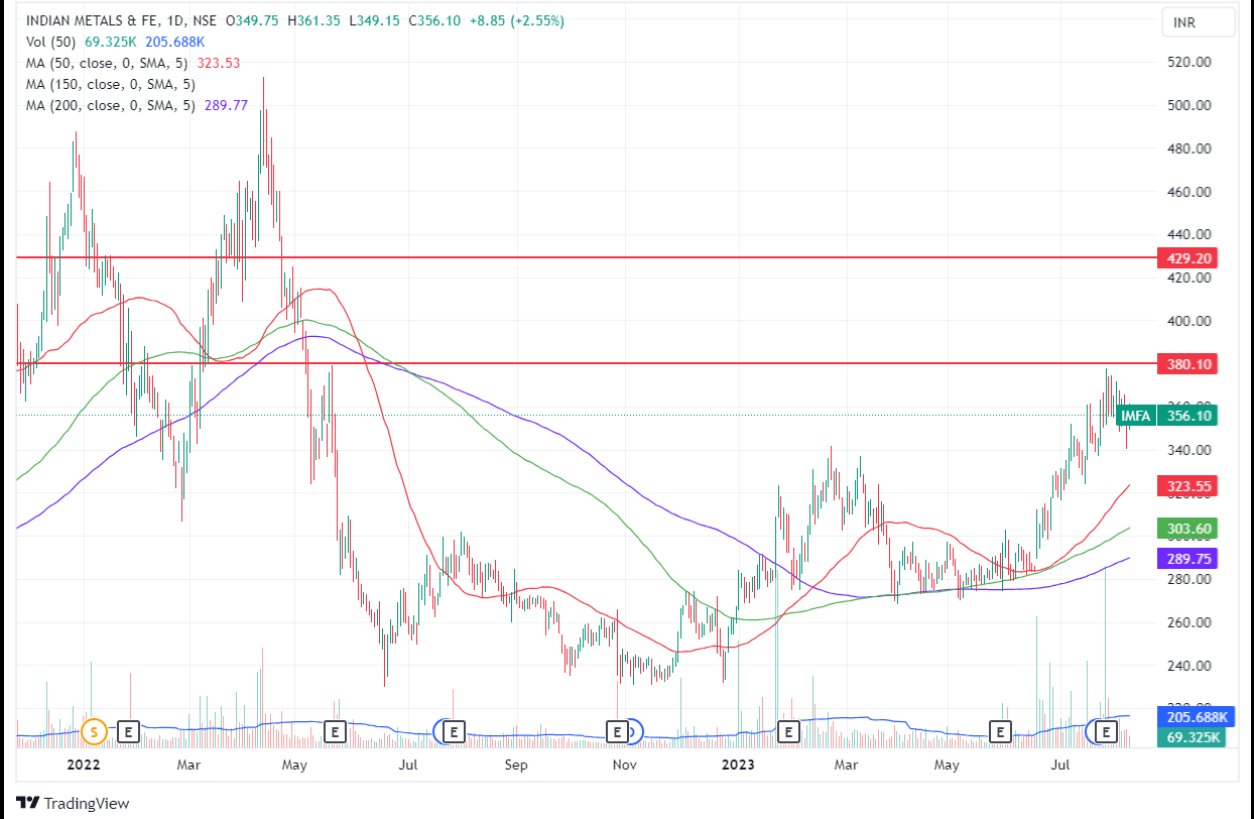
IMFA is a backward integrated suppliers of Ferrochrome in India. It supplies Ferrochrome to Stainless steel producers like POSCO, JSL etc, with 90% of its production exported with 65% as long term contract and 35% sold in spot market.
Since Q2 last year, prices of Ferrochrome have been dropping on recessionary fears and higher interest rate environment. The stock started to recover towards end of 2023 on China recovery, which has not materialized in a big way so far. However, a good Q1 has given some push to the stock along with the expectation the input cost on coke is expected to go down over next couple of quarters because of old high price stick being consumed and new low price stock coming into paly. Any stimulus from China may result in higher Ferrochrome prices which are still above the pre pandemic low. Mgt commentary is FY24 is expected to be similar to FY23.
Overall like any commodity play this one is difficult to time, however with input cost expected to go down, any uptick in Ferrochrome prices should give the stock the impetus to move up.
Technically, 10WMA>30WMA>40WMA and 10WMA has started to rise. Huge vol can be seen in last 1.5 months and especially on Jul 26. Potential resistance and targets have been marked by red line.
Disclaimer: No position, posted only for academic purpose and a way to understand dynamics of Commodity plays. May take a position based on news out of China and how Ferrochrome prices pan out globally and in East Asia.
2 Likes
Bharat Forge is one of the biggest Forging companies in the country. It has done a great job in the last few years to diversify its business and its entry into the defense space for Artillery Systems, E mobility etc. has allowed it to diversify its revenue streams going forward. Recently it was awarded license by GOI to participate in potential defense programs.
The stock has just touched ATH at 938.3 on Aug 1st after which it has comeback to 905.75. Its Aluminium business is expected to perform well going forward which was a drag in last few quarters.
Technically 30WMA has started to turn upwards and crossed 30WMA and 40WMA. With results out this week, Good Mgt commentary especially around Defense business should push the stock further up.
Disclaimer: Invested from 800 levels. View might be biased.

7 Likes
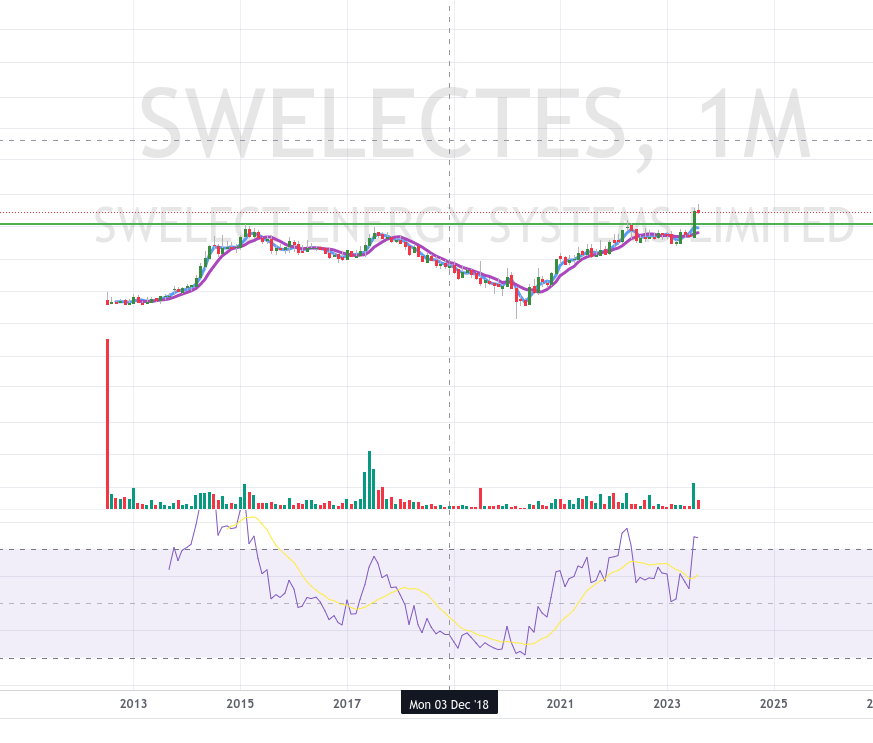
multi year breakout on solar EPC company has shuttered old tech plant and started new solar module plant to make mono panels… chinese solar cells prices has collapsed… margin can go up along with rev…cheaply valued at 1 times book when other green energy companys are trading at high price to book…
“The construction of fully Automated State-of-the-Art with new 500 MW production capacity of Solar PV Module Manufacturing plant
has been completed successfully. The trial production started during February 2023 and the Automation process is progressing
well for continuous operation. This plant will be catering to major utility scale developers, the Commercial & Industrial segment,
as well as the Export markets.”
1 Like
Finally after a bit of dillydallying around 200 dema, Stove Kraft stock price today broke out above previous (intraday) swing high of around 507, and managed to close above 510. Good volumes on breakout. Now need to observe how things pan out. If the cup and handle in this bar chart plays out, target can be around 650.
15 Likes
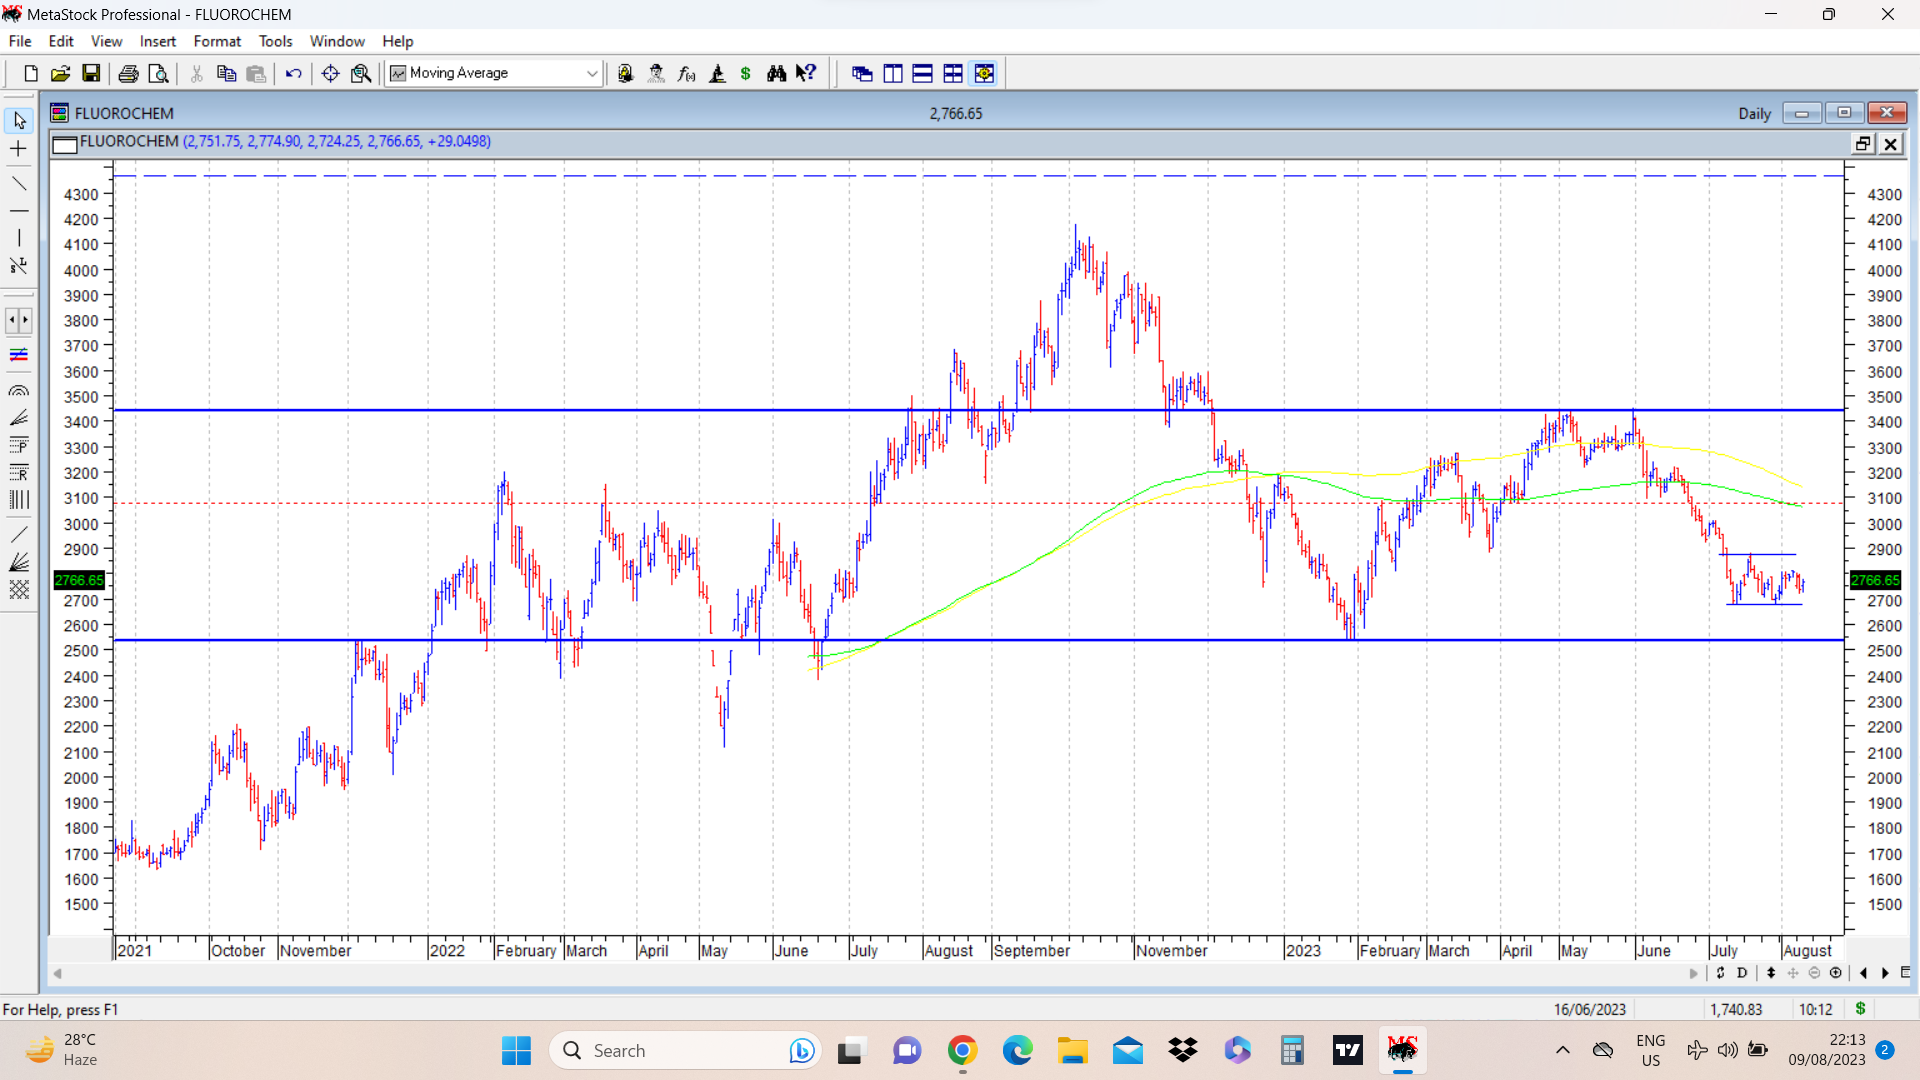
Fluorochem results are out and expectedly were weak. That is one newsflow out of the way. Stock price remains interestingly poised.
In the chart posted below, in the extreme short term daily chart a double bottom of 2678 was posted recently. Confirmation of this pattern will happen once stock price crosses 2880. If that happens, there can be a pop up of another 200 rs which can take the stock price ( to around 3080 marked in dotted red lines) above its falling 200 dema ( in green)
Yet another interesting level going ahead is the level of 3450. If and when stock price crosses 3450, it will confirm a W or a double bottom pattern with one bottom at around 2530 and another at 2678. Above that momentum can be strong. Till that time it could largely be sideways and respond to newsflows and annoucements and move sideways. As of now two important levels in the medium term are 2530 and 3450. This could be the range to watch out for and marked in solid blue bold lines.
disc: invested.
33 Likes
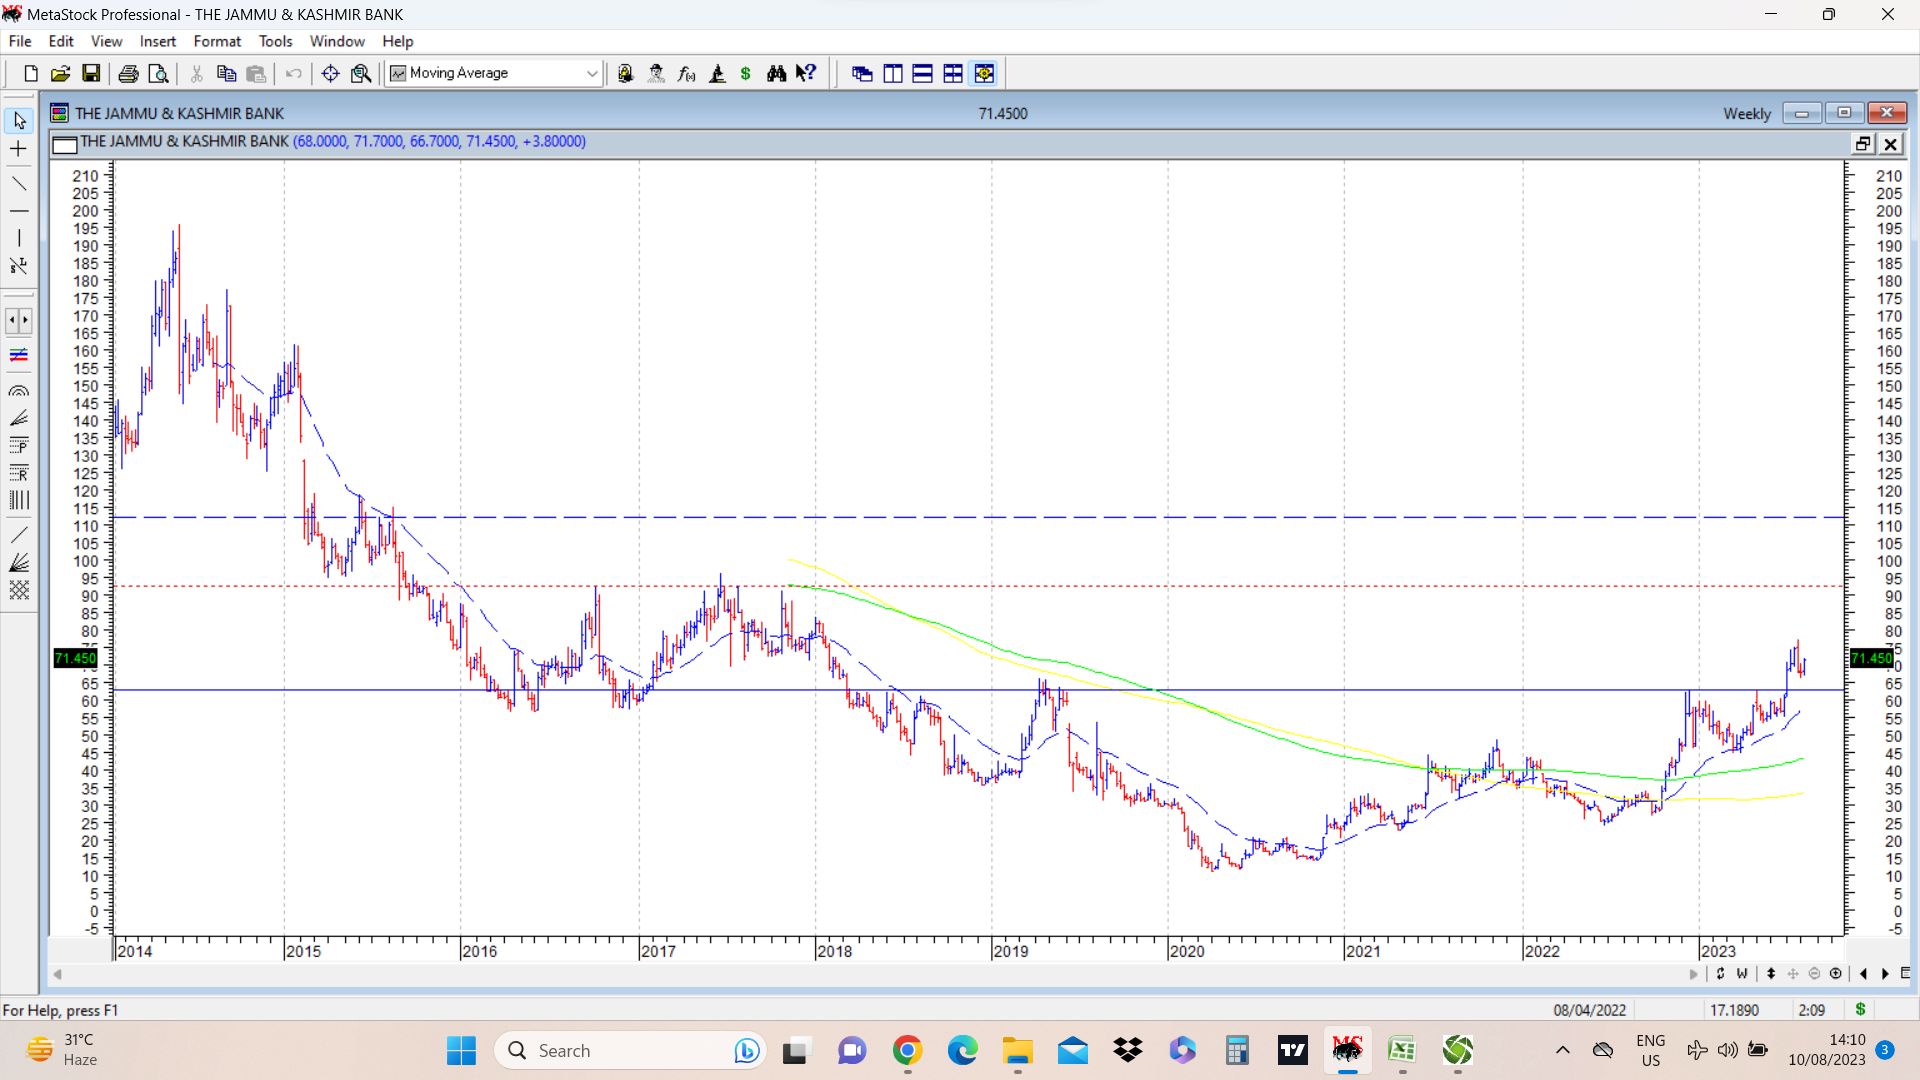
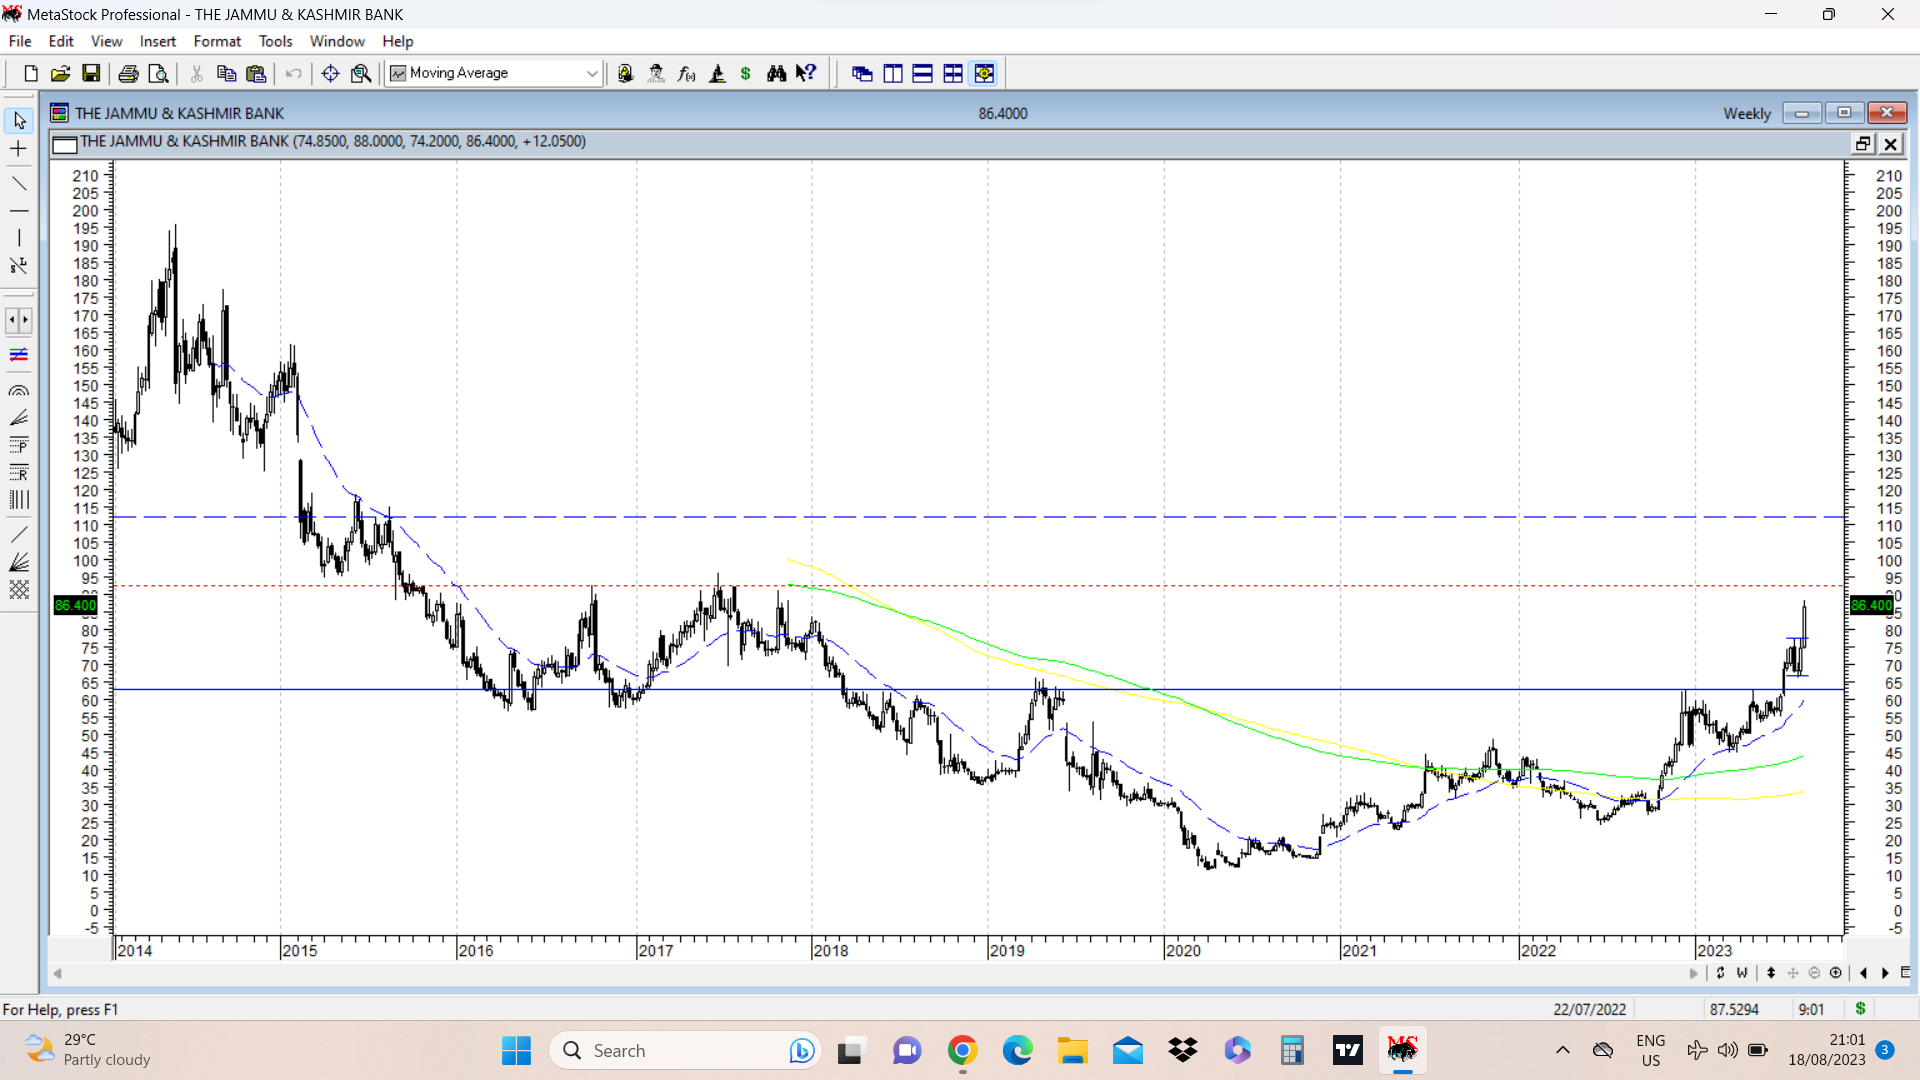
JK bank has been posting good results since past few quarters. Currently stock price poised around 70. Above 62, it gave a breakout above 5 year highs and since then it has been consolidating.
Management talks of aspiration net profit target of 4000 crores in fy 28, which is nearly 3 times current profits. Tall ask.
Solid blue line marks the neckline of a medium term inverse head and shoulders patttern breakout. Potential resistances marked overhead in dotted lines.
disc; invested as a techno funda bet.
18 Likes
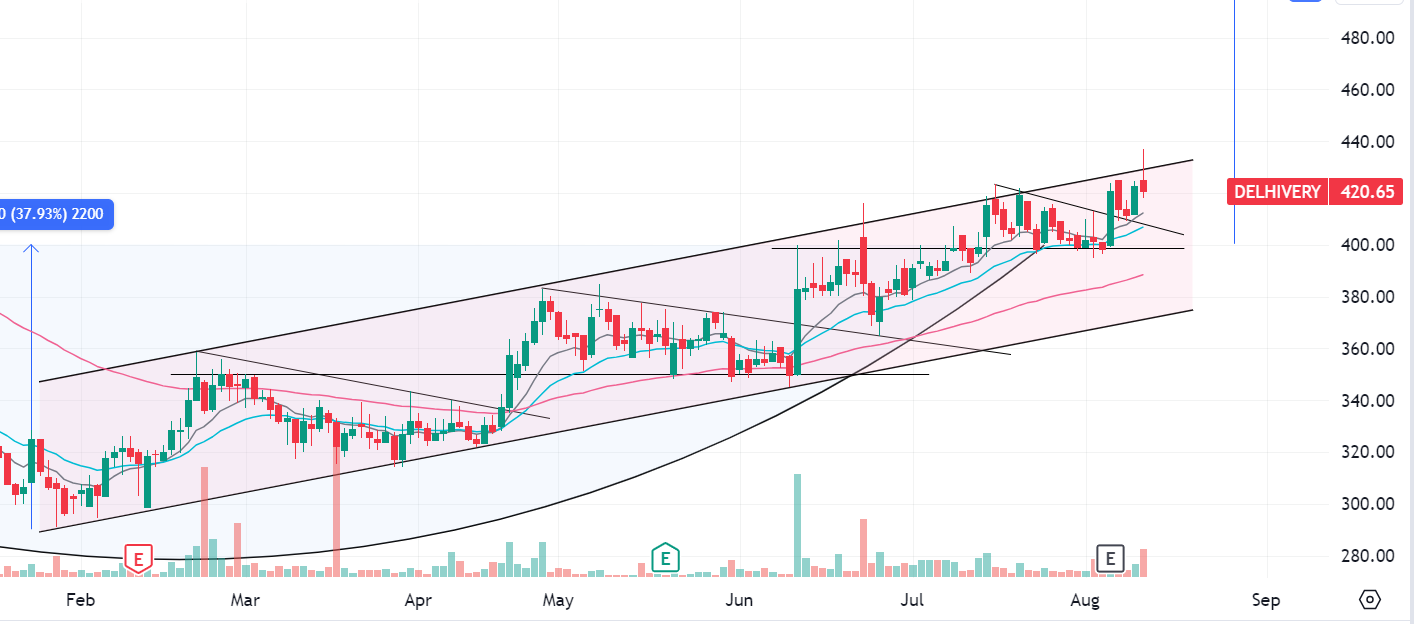
Delhivery (in sync with other platform businesses) broke out of its medium-term arc formation 1 month back. Since then, it has consolidated between 400-420.
Delhivery-Weekly
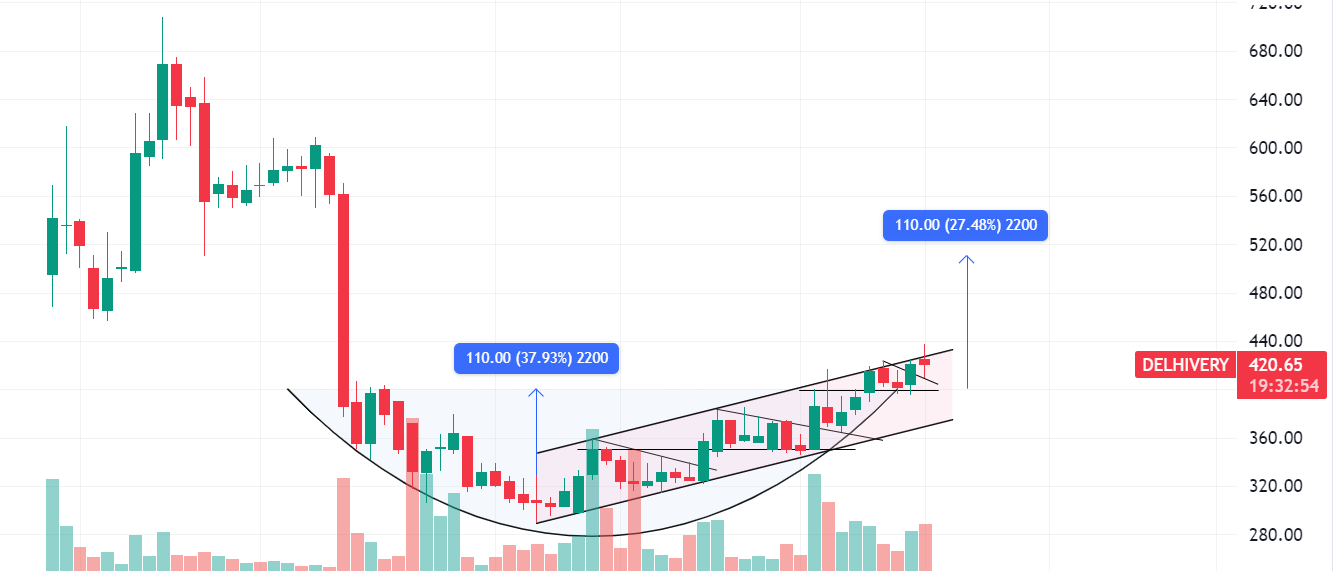
It is also in a short-term rising channel and is currently testing the upper band, however there seems to be strong supply at ~420 level, which looks like the last hurdle - if taken out - before the stock gives a quick ~20% upmove to ~500.
Delhivery-daily
@hitesh2710 sir, this is my first post on Valuepickr and would love to hear your views on the same.
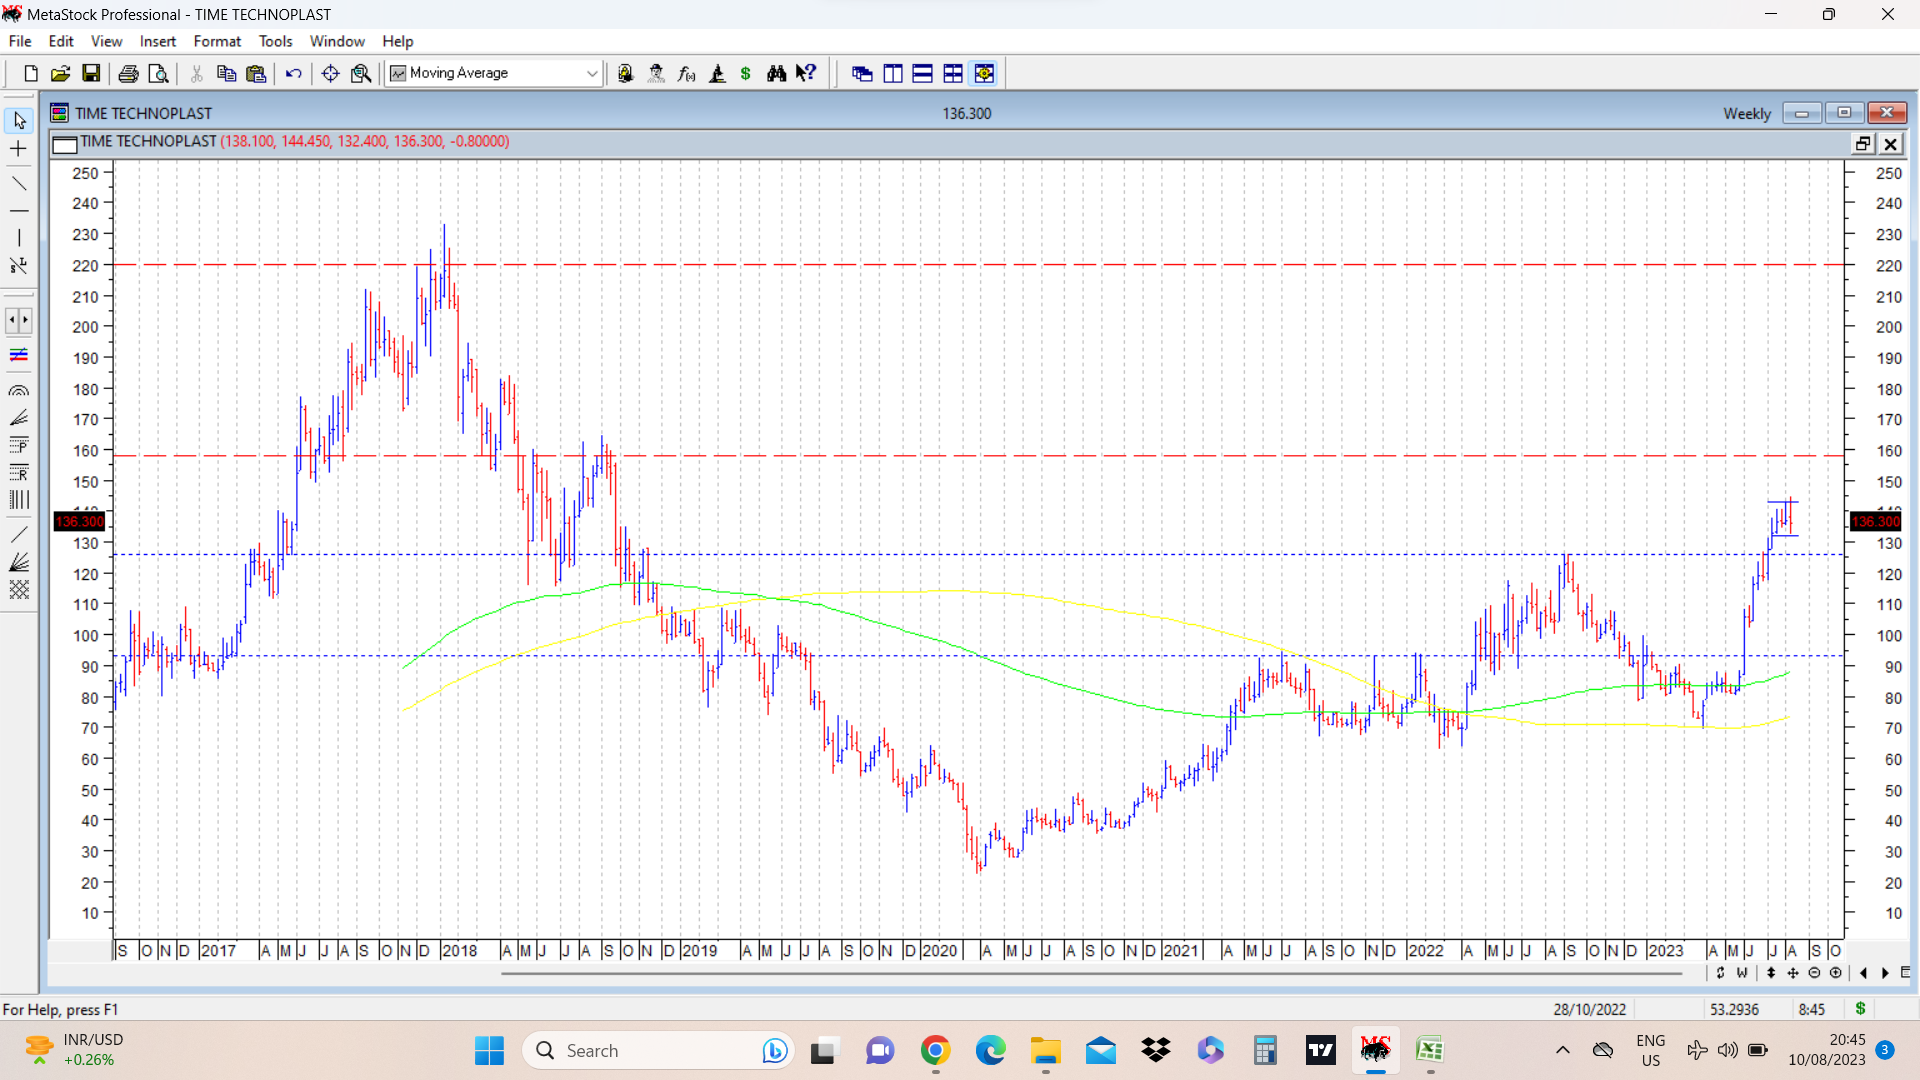
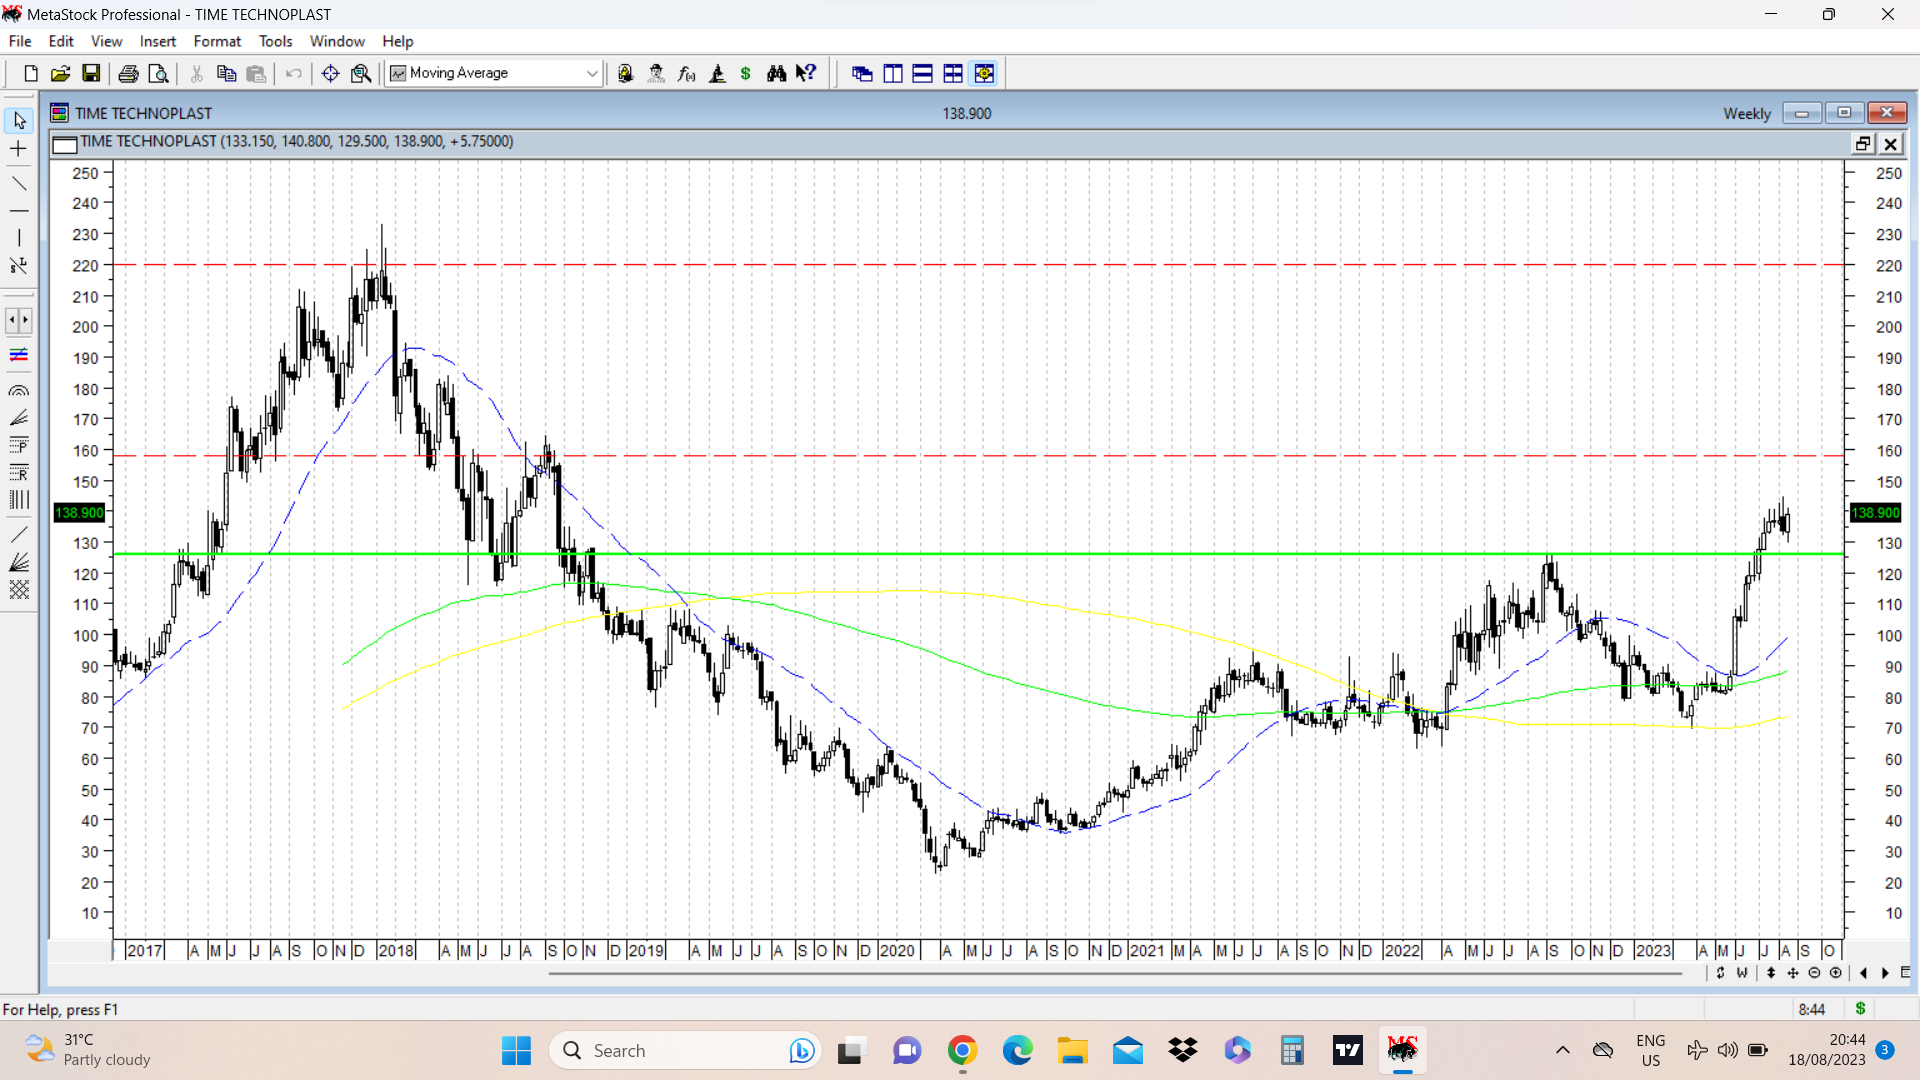
Time techno chart details were posted some time back on this thread. Company today came out with decent results. Investor presentation provides all the details about the business and quarterly performance.
Technically, the level of 142-144 has been a near term resistance. If and when that resistance is cleared, upmove can resume a new leg. disc: invested as disclosed before.
Attached chart shows key resistances crossed at 92 and 126 in dotted blue lines. Potential targets/resistances on way up are marked in dotted red lines at 160-220.
7 Likes
Delhivery chart has been earlier discussed by @rupaniamit along with other platform companies. Problem with all these is that since they have fallen post IPO from very high levels, there is likely to be consistent supply on way up at most resistance levels. So upmoves might be interrupted from time to time. Plus we are not sure if this is a trend change or a dead cat bounce.
8 Likes
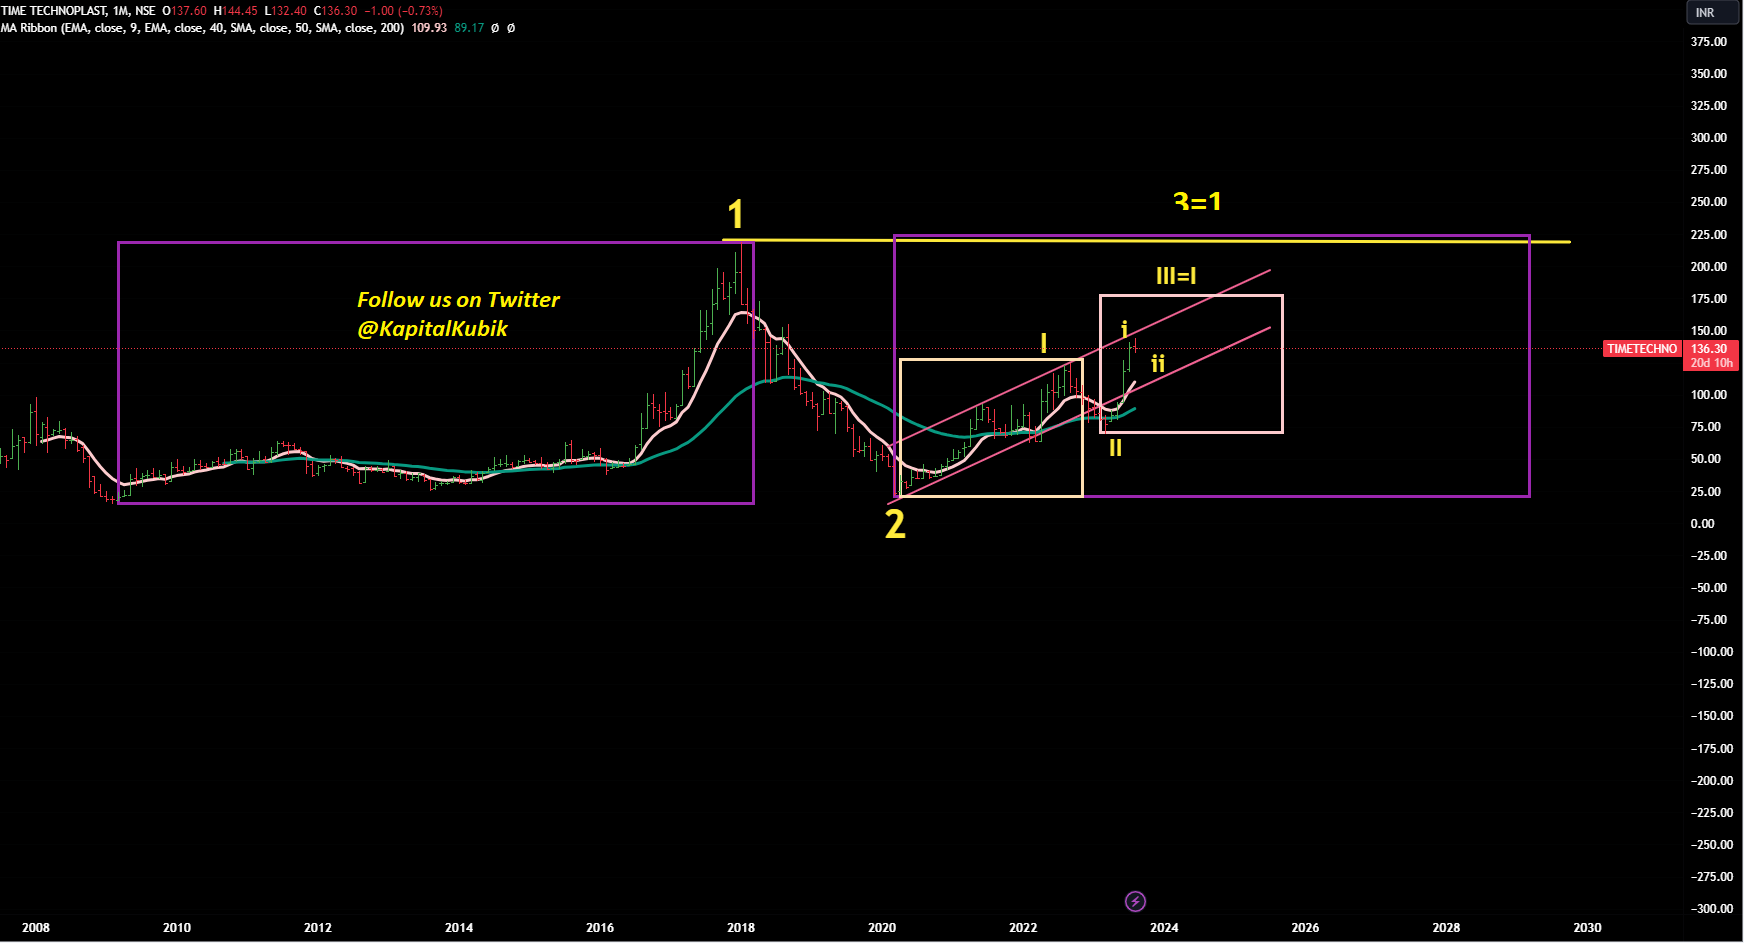
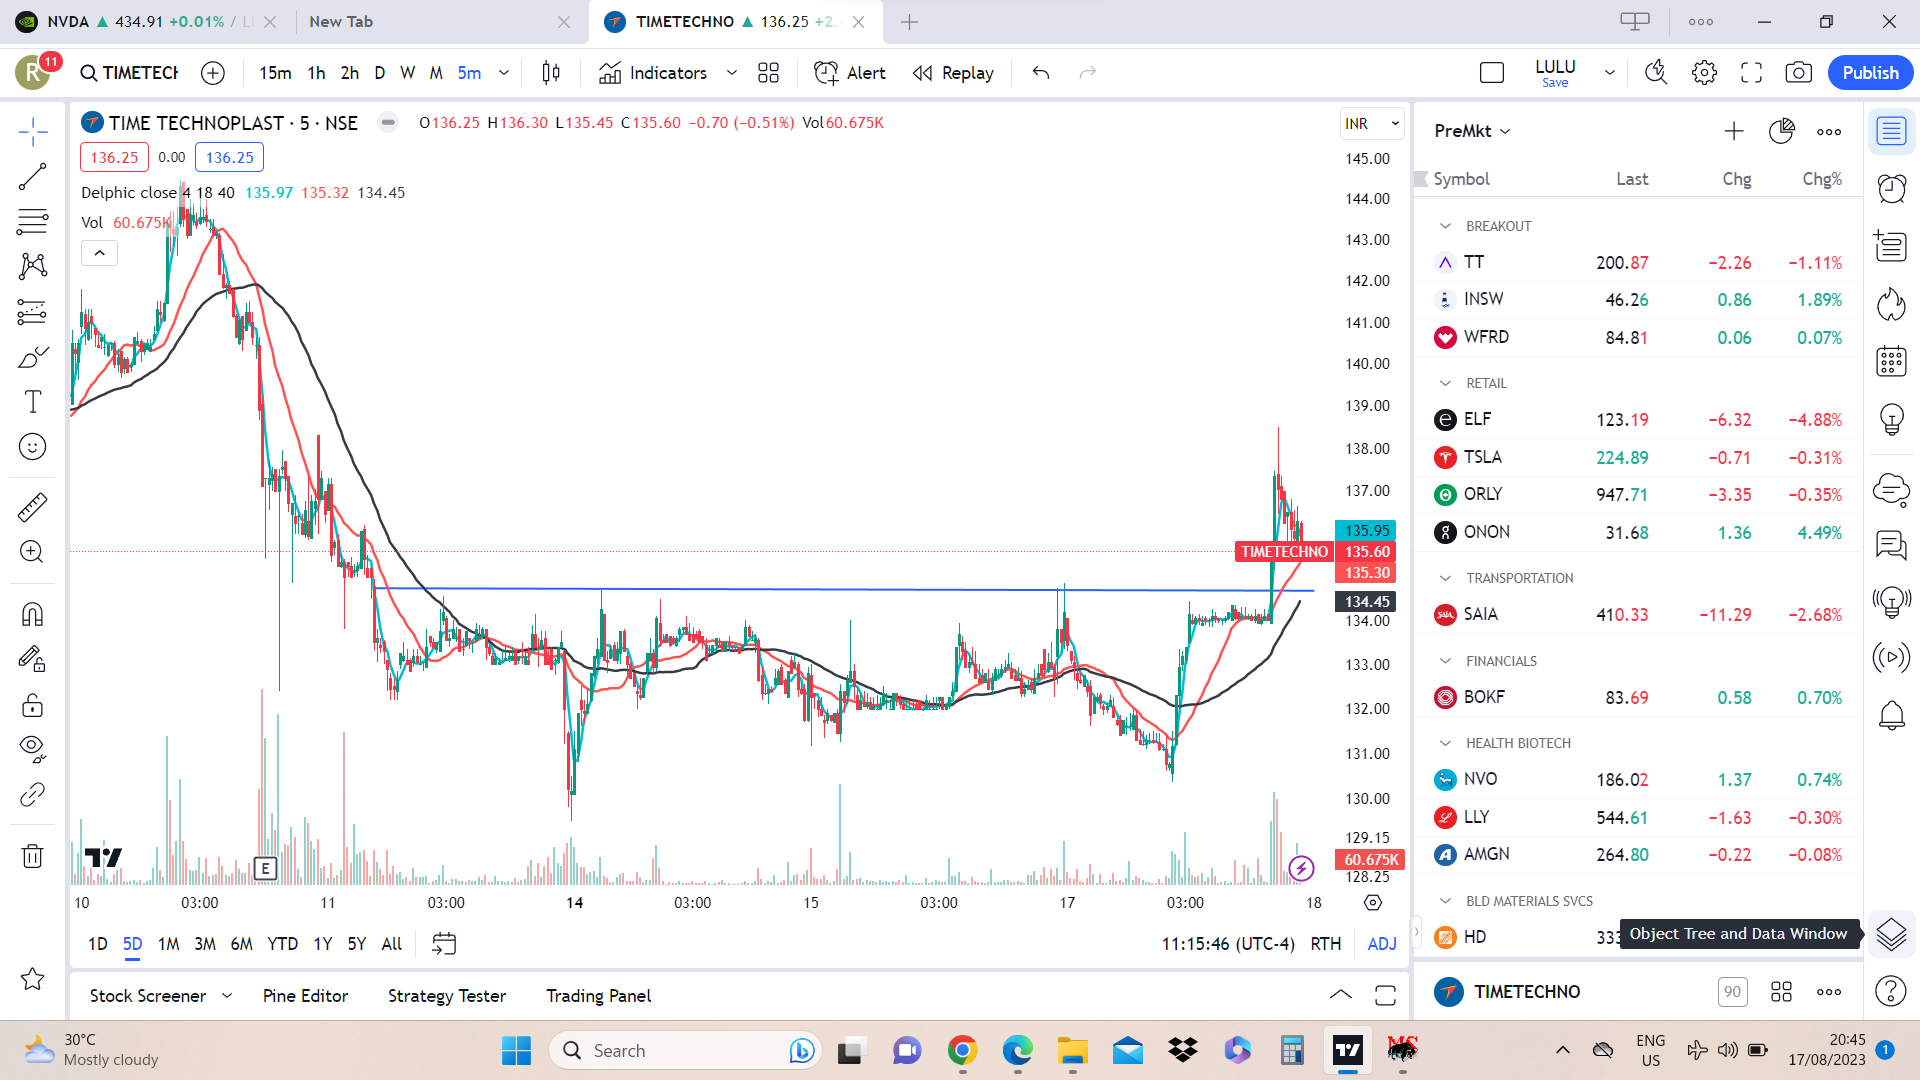
TimeTechno
CMP 136
From EW prespective !
It seems that we are in larger wave 3 and with in that we’re in III.
Now we’re near to completion of minor wave i and a slight correction is happening in wave ii , also we’re near upper line of the recent rising channel .
Once correction is done then we should go beyond the levels shown at III=I.
Overall 3=1 is near the old resistance level at 220.
3 Likes
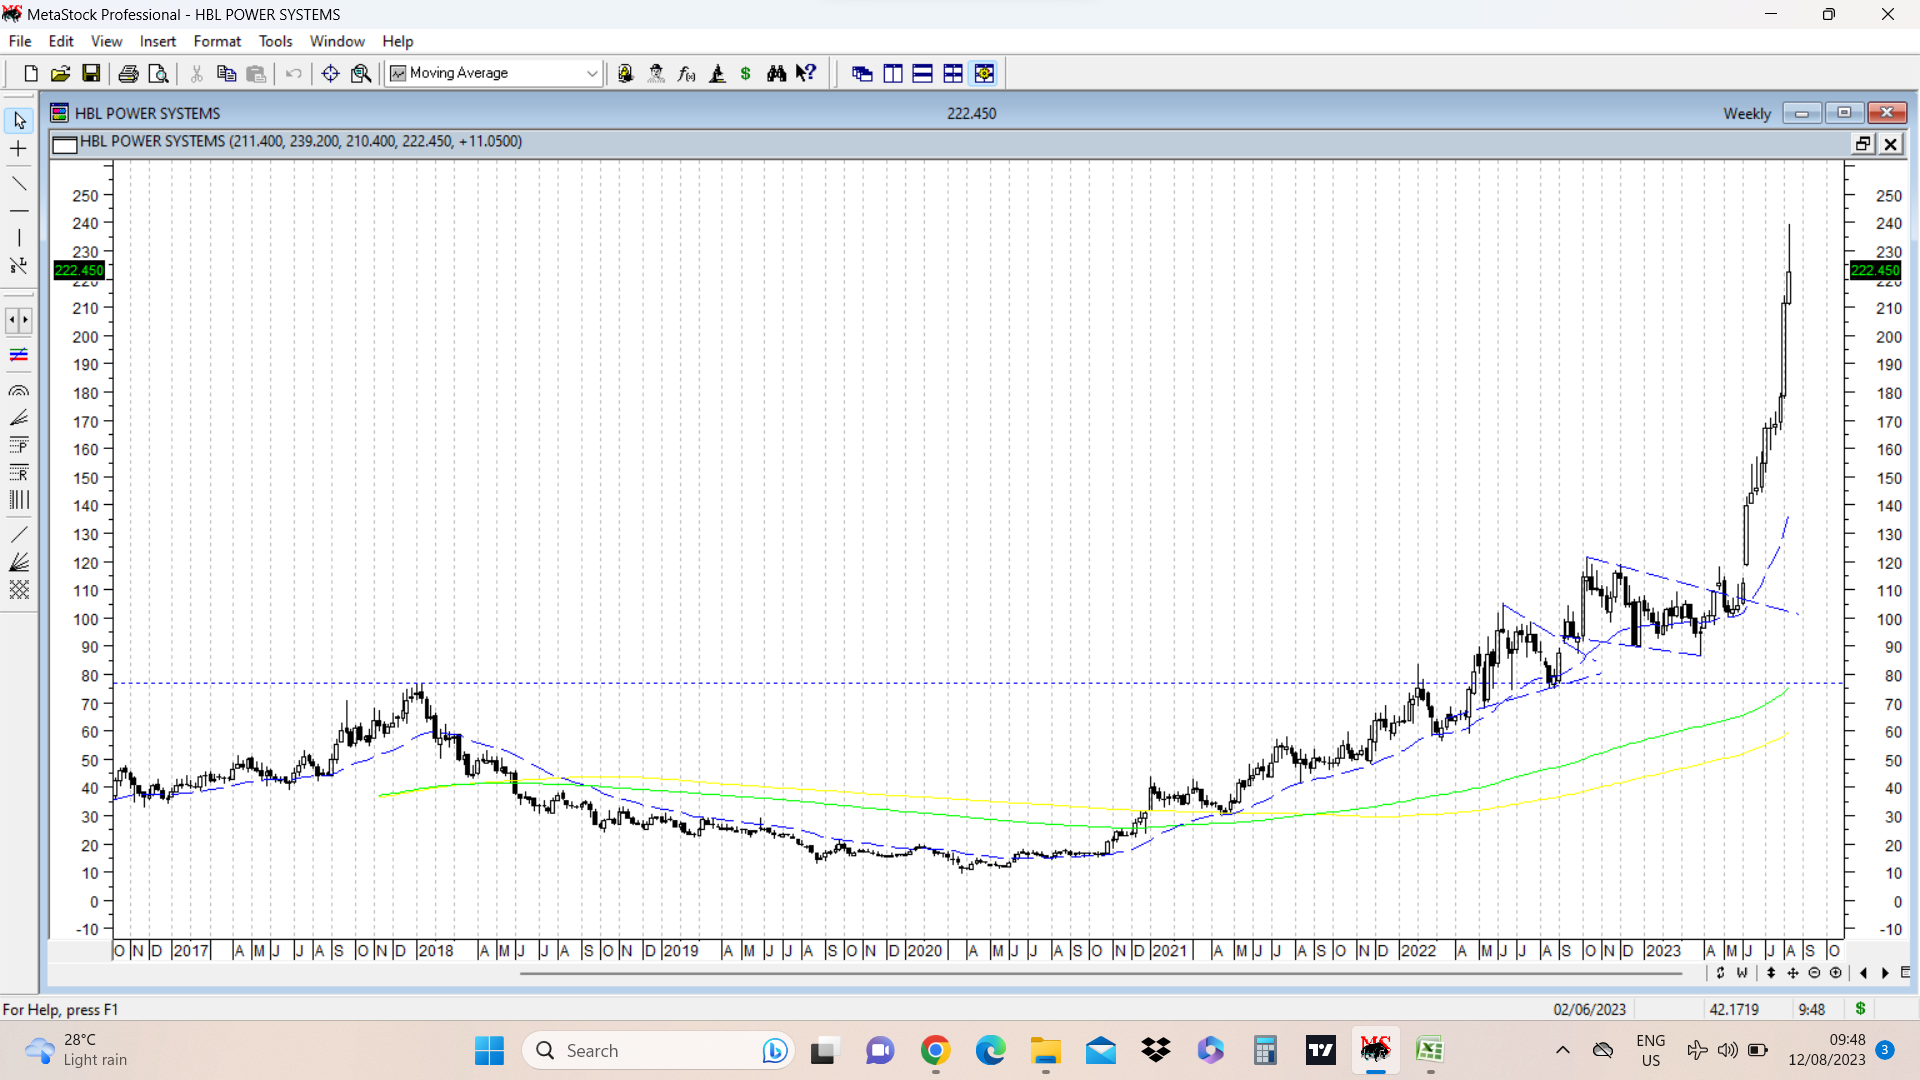
HBL Power weekly candlestick chart posted below. Some important observations till date.
-
A very nice saucer shaped rounding formation took place between Jan 2018 to April 2022. In April 2022, stock price crossed and closed conclusively above previous ATH of 77.
-
Two triangular consolidations after crossing ATH have been marked in dotted blue lines. These are on top of each other. Often similar to a base on top of a base formation referred to by William O Neil.
-
After crossing previous ATH of 77 in April 2022, real big move in the stock price happened in June 2023. It took nearly 14 months of consolidation above previous ATH even after the breakout happened , which goes to show the importance of having patience in these kind of investments. This 14 months period was filled with a lot of doubts about the business and its prospects.
-
After the first time stock price conclusively crossed previous ATH in April 2022, stock price went down and retested breakout levels and touched levels of 67 in May 2022, and around 74-75 in June 22 and August 22. This is an important learning and can be used in the future in case of stocks breaking out past previous ATH with a nice rounding bottom formation, and good business prospects. ( initially after the breakout for a few weeks and months, the fundamental picture is often hazy and murky, but this is the time to do proper homework fundamentally. )
-
Stock price gapped up between 114-118 on daily and weekly charts in June 2023 and since then doubled in quick time. This explains the importance of breakaway gaps.
-
This week results were out and have been quite good. On daily charts, stock has gone sideways, and weekly candle shows a long upper wick with a high at 239. Low for the week remains at 211 which is the high of previous week’s big bull candle. Going ahead, these levels of 211 and 239 assume a lot of significance in terms of breakout or breakdown.
36 Likes
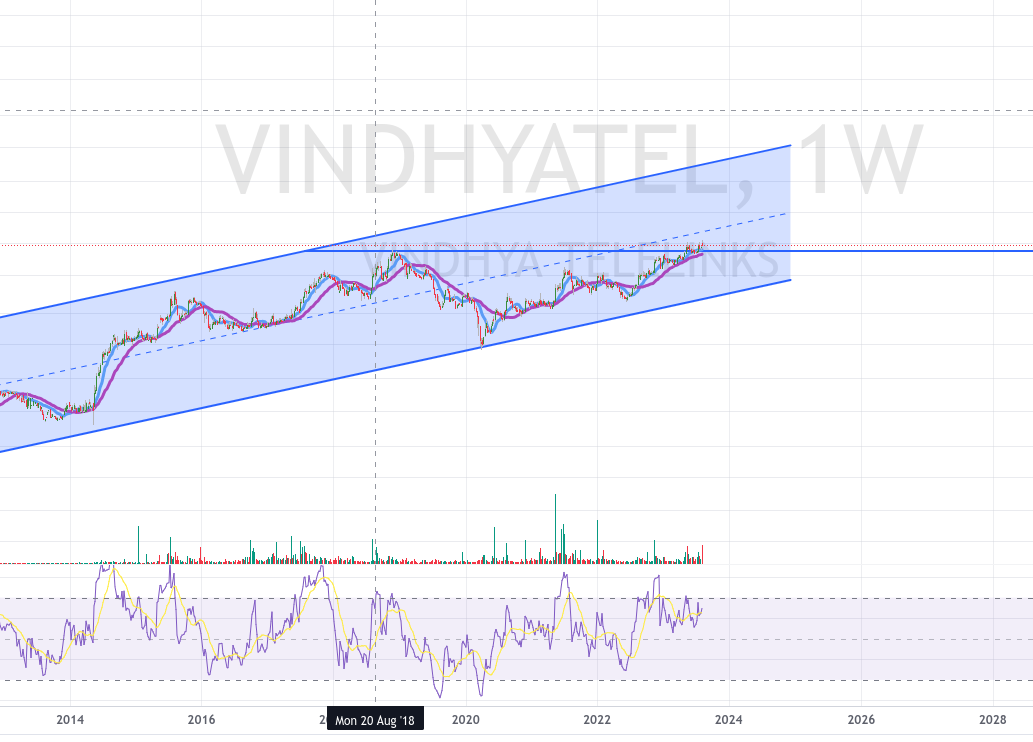
VTL is an M. P. Birla group company, one of the established business houses in India having various business interests like cement, jute, carbide, power cables, optical fibre cables, guar gums, power capacitors, etc.
Vindhya tele links a holding company of sorts a good order from UP state gov water works in underway …optical fiber and cable demand going up due to bharat net etc… firing on all cyclinders… giving muti year break out…!
1 Like
Still room left …it seems
1 Like
Attaching a 5 day chart with 5 minutes ticks of Time techno plast. Major resistance was around 135 for major part of recent correction in price. Today an attempt was made to cross that level in the last hour of trade. Volumes uptick also seen. Another important observation is the very tight consolidation before this last hour breakout happened for several 5 minutes tick… Its an example of VCP – Minervini pattern on a much smaller time frame. Its too early to say that correction is over, but I have tried to use smaller time frames to see how they can predict end of correction. Fingers crossed. disc: invested as disclosed before.
16 Likes
Time techno weekly update. Stock price has given a bullish candle close for the week, especially in a week that was overall weak for indices. The 5 minutes chart posted above ( from trading view provided by a friend ---- a question was asked whether I switched to tradingview, but was moderated because it did not seem relevant to a very focussed thread) did seem to work out atleast till now. Need to see how it goes. It needs to cross and close consistently above 140-144 to make a case for definite reversal and resumption of uptrend.
9 Likes
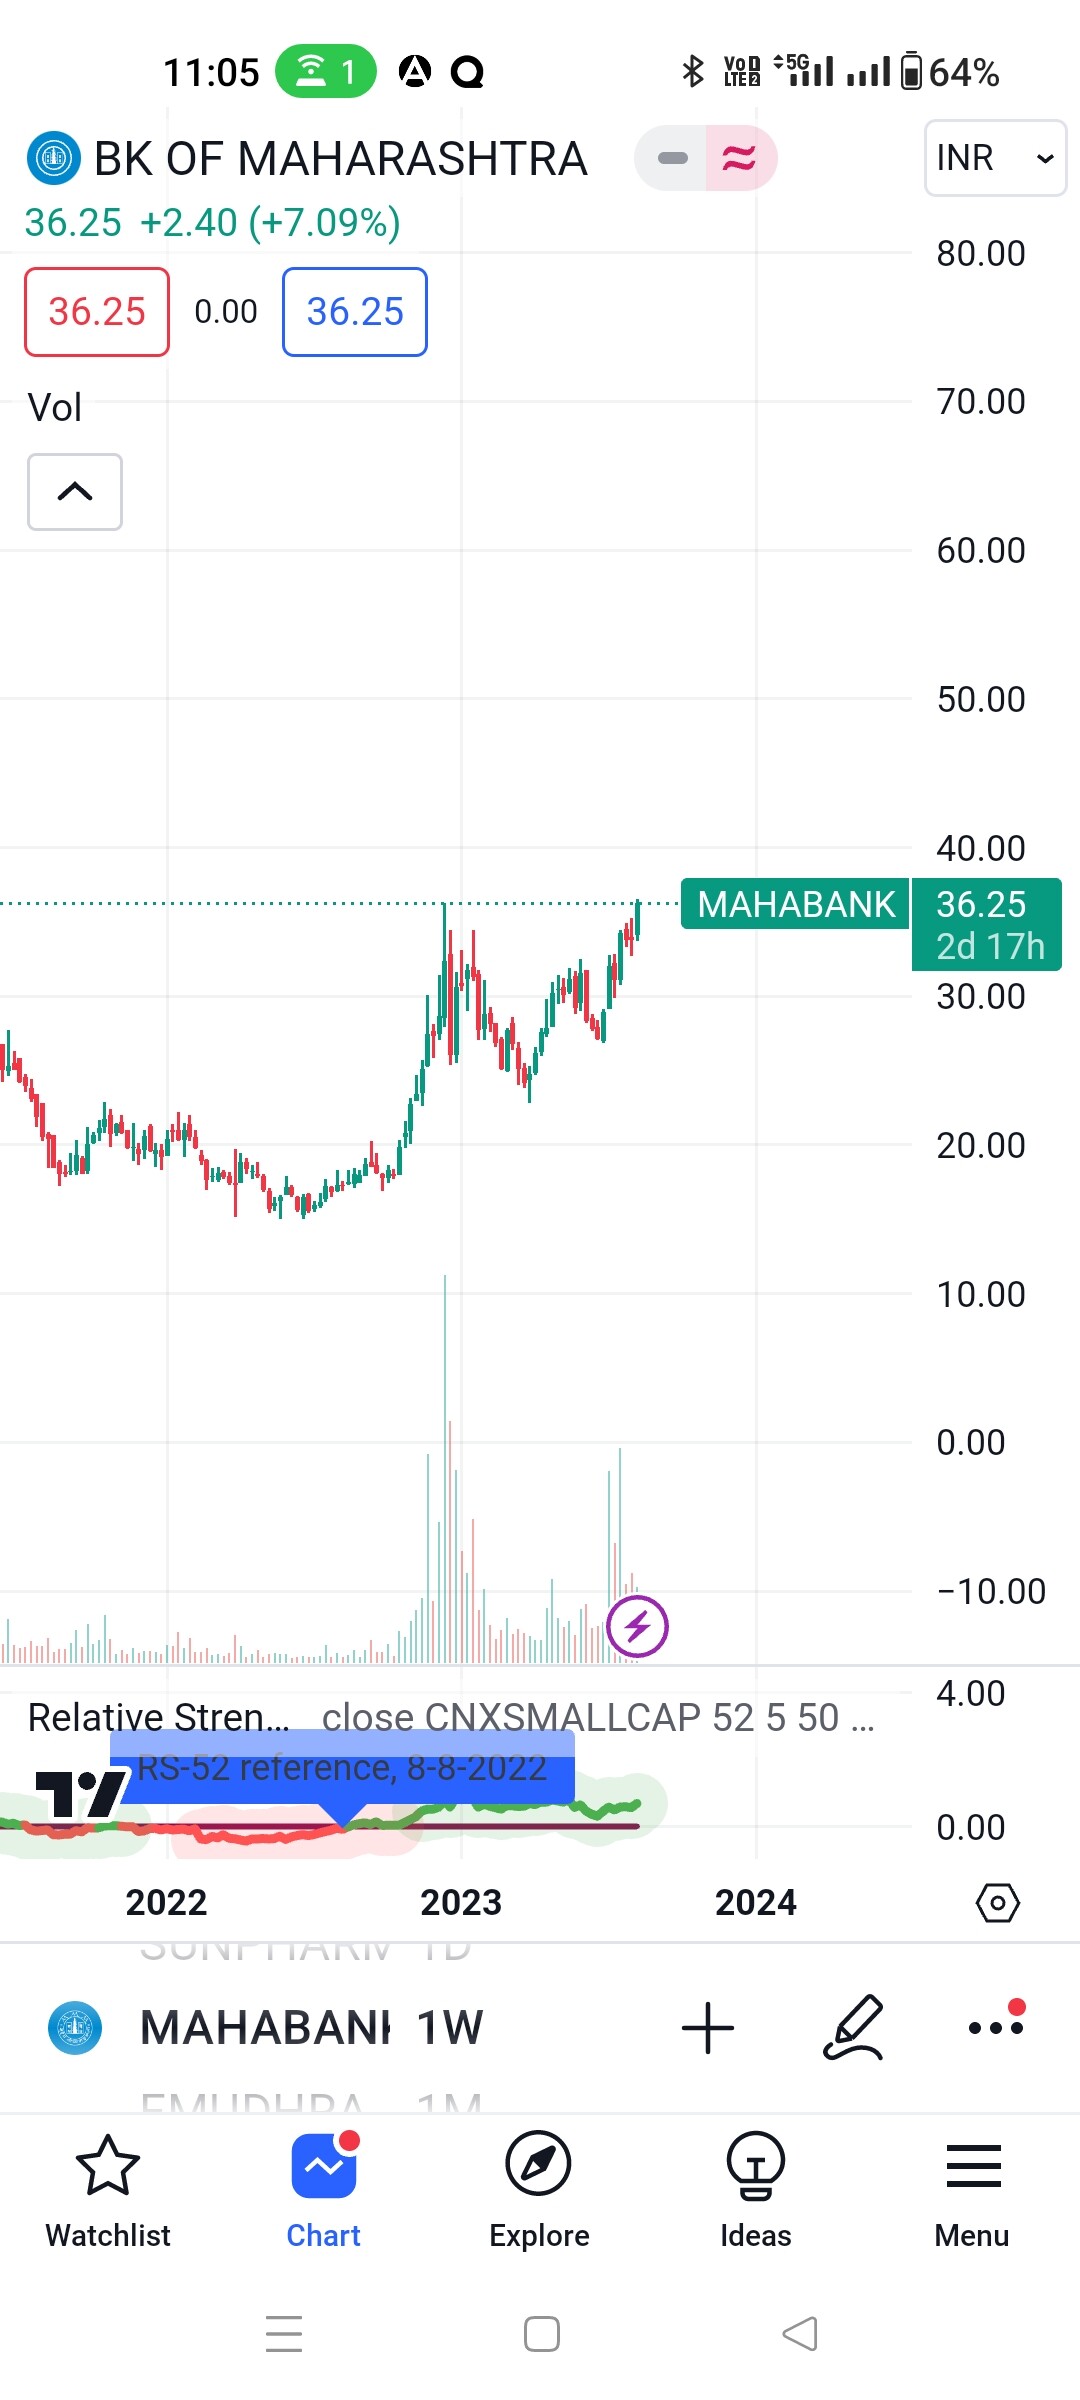
J&K bank follow up to the chart posted above. The stock price this week gave a strong close with a big bullish candle and a breakout above a 5 week range between 66-77 marked in dotted blue lines. Near term resistance is marked in dotted red lines at around 92. Above that next major resistance is around 110-115.
This chart is an example of early stage rounding bottom and if that pattern plays out then ultimate targets can be its previous life highs of 195 and above that could be a blue sky scenario. Needs to be seen how it plays out as there can be hurdles on the way up even in rounding bottoms.
16 Likes
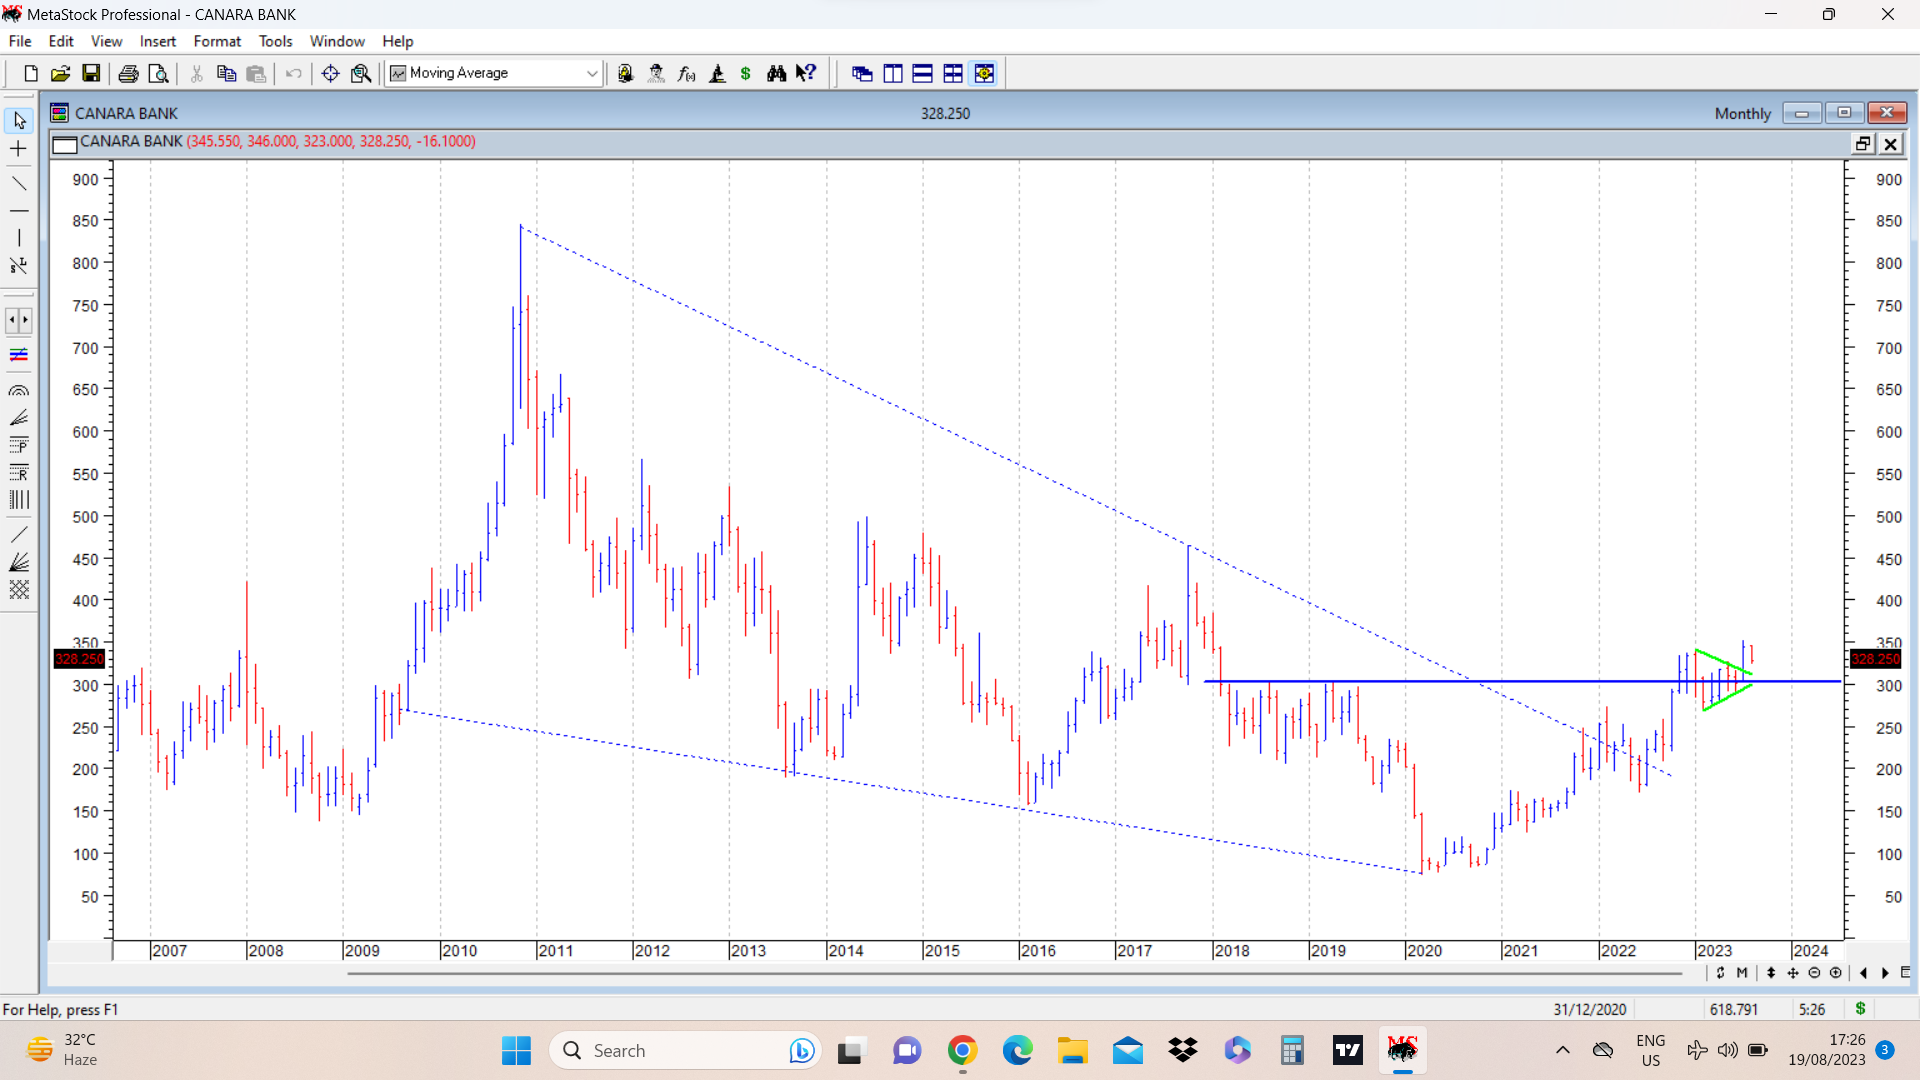
Canara Bank cmp 328 has been reporting decent quarterly financials in terms of its asset quality and profit numbers. Attached monthly chart shows a crucial 4 year high resistance at around 300 marked in solid bold blue line. This was crossed in December 2022 and post that stock price has gone into a triangular consolidation above and below the level of 300 and it has been almost 9 months of this . In July 2023, stock price broke out of this triangle and hit a fresh swing high of 351, crossing previous swing high of 341 and again seems to be consolidating post this triangular breakout.
Another interesting aspect of this chart is the breakout from falling trendline shown by dotted blue lines. The whole previous correction in price from 844 in October 2010, to a low of 74 is in form of a triangular structure shown in chart. Breakout from that falling long term trendline happened conclusively in July 2022.
disc: invested as a techno funda bet.
29 Likes