
This is my first technical chart. So please let me know if there is any mistake. Gabriel India seems to be having 5 year breakout. Last time it touched 212 in Sep 217.

4 Likes
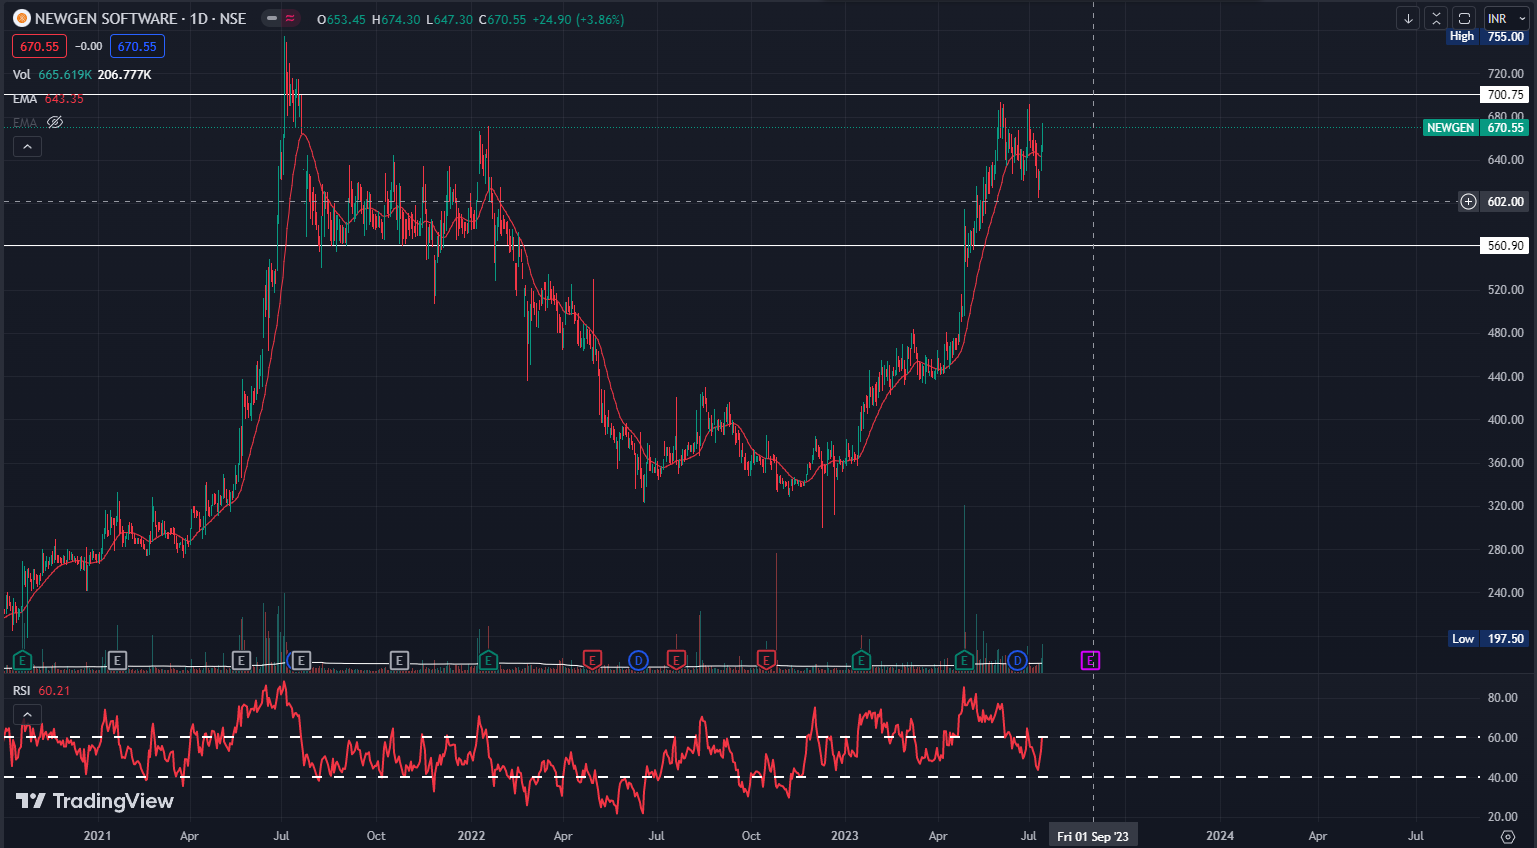
This is the chart of Newgen Software. It has formed a beautiful cup in the last one year and it near it’s 52 week high. RSI is also well positioned around 60 Levels, indicating a strong possibility of a break out. If it hold above the 700 levels we can see a good up move. With all the major IT stocks running up on Friday, there is a pretty good chance of the same effect trickling down to smaller Software Companies. Fundamentally, it is also not overvalued. It is trading at 25 PE with a 3yr sales growth of 15%.
Disc: Invested for Swing trade
4 Likes
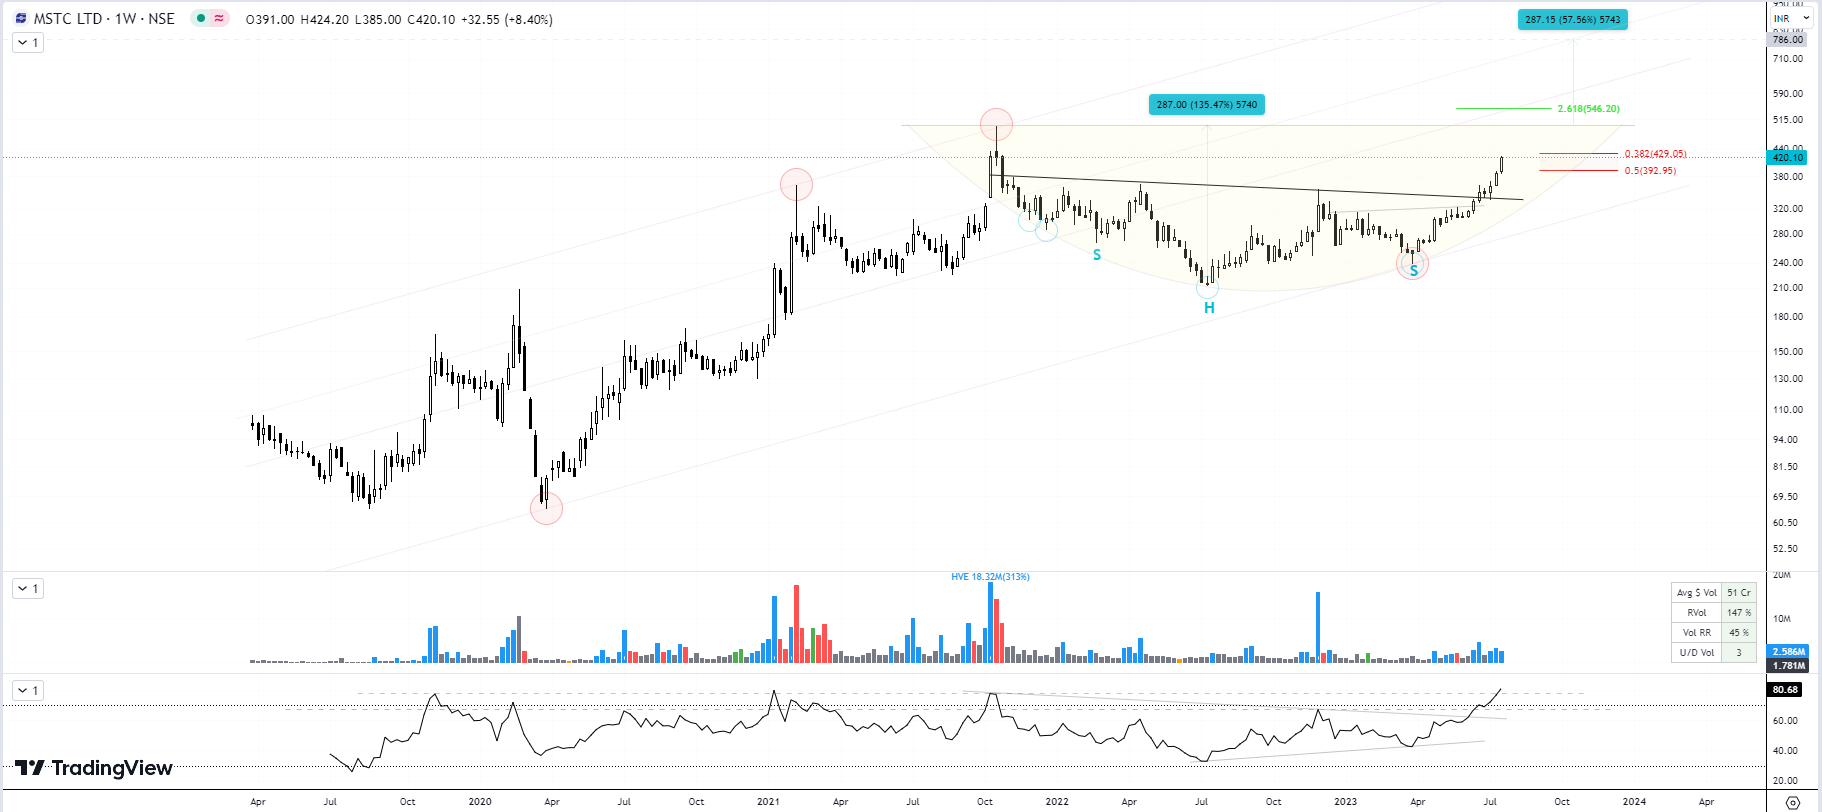
Update on MSTC:
- Beautiful Inverse H&S breakout done,
- Followed by a retest on lower volumes
- Currently follow up bounce in progress post retest, with rising volumes.
10 Likes
Update: HERITAGE FOODS: 155-245 CMP
- Long term trend reversal seems to be possibly taking shape
- RSI has broken out on Monthly chart
- Downward Slant line broken - (Confirmation would be monthly close above)
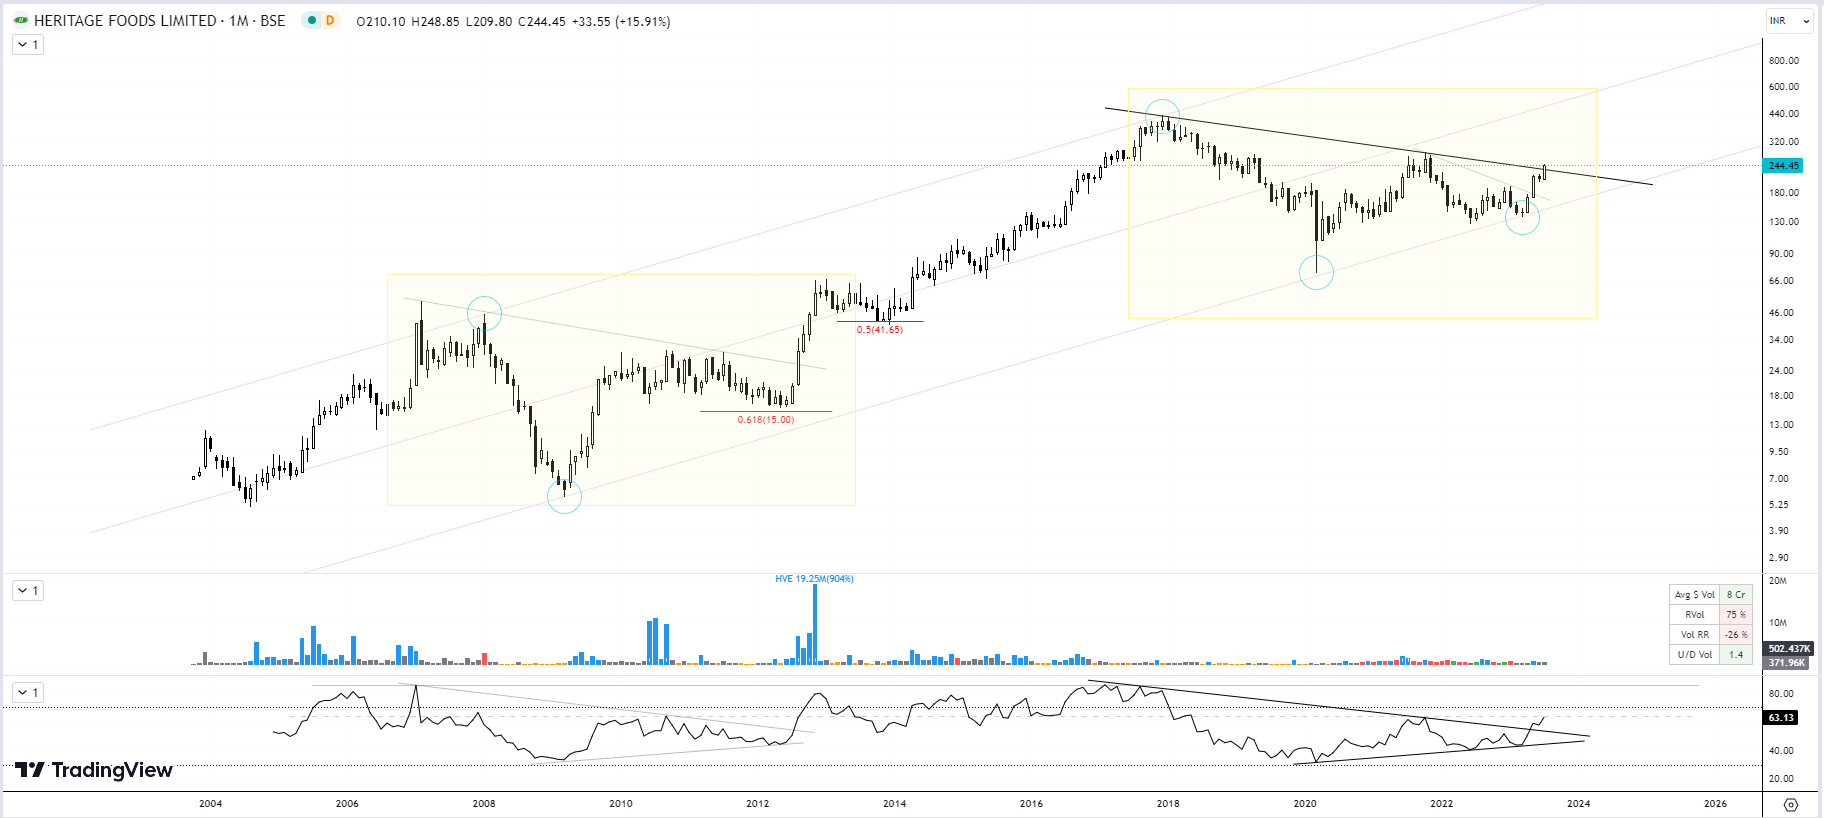
- After a good 42% drawdown, a strong reversal is seen in the Dairy Sector Stocks:
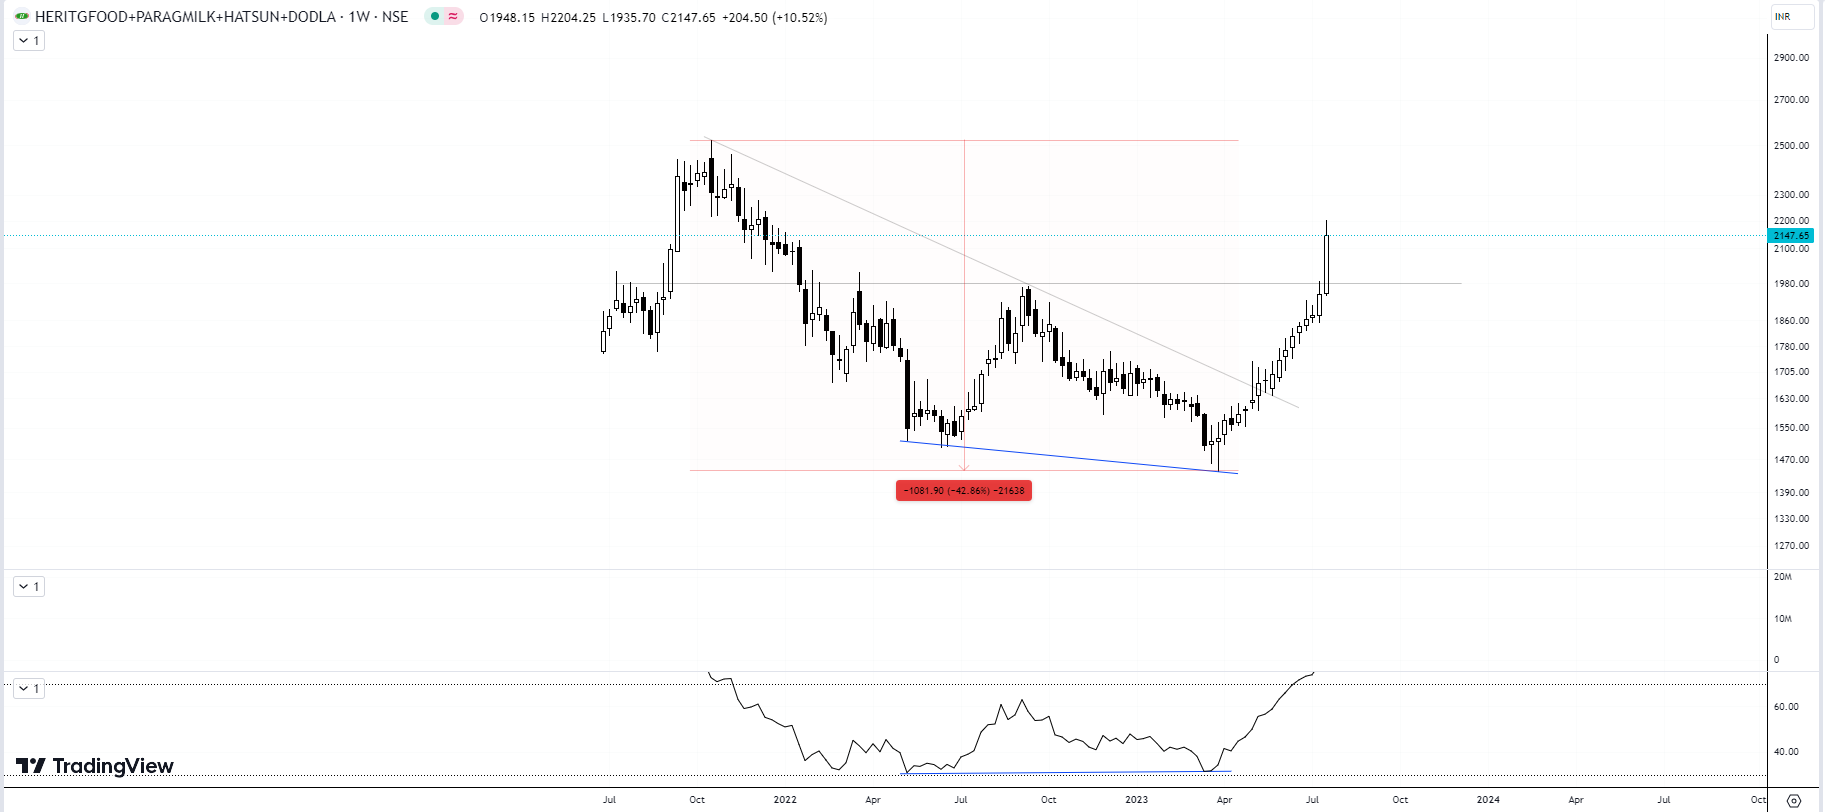
It would be safe to assume a bullish bias moving forward…
3 Likes
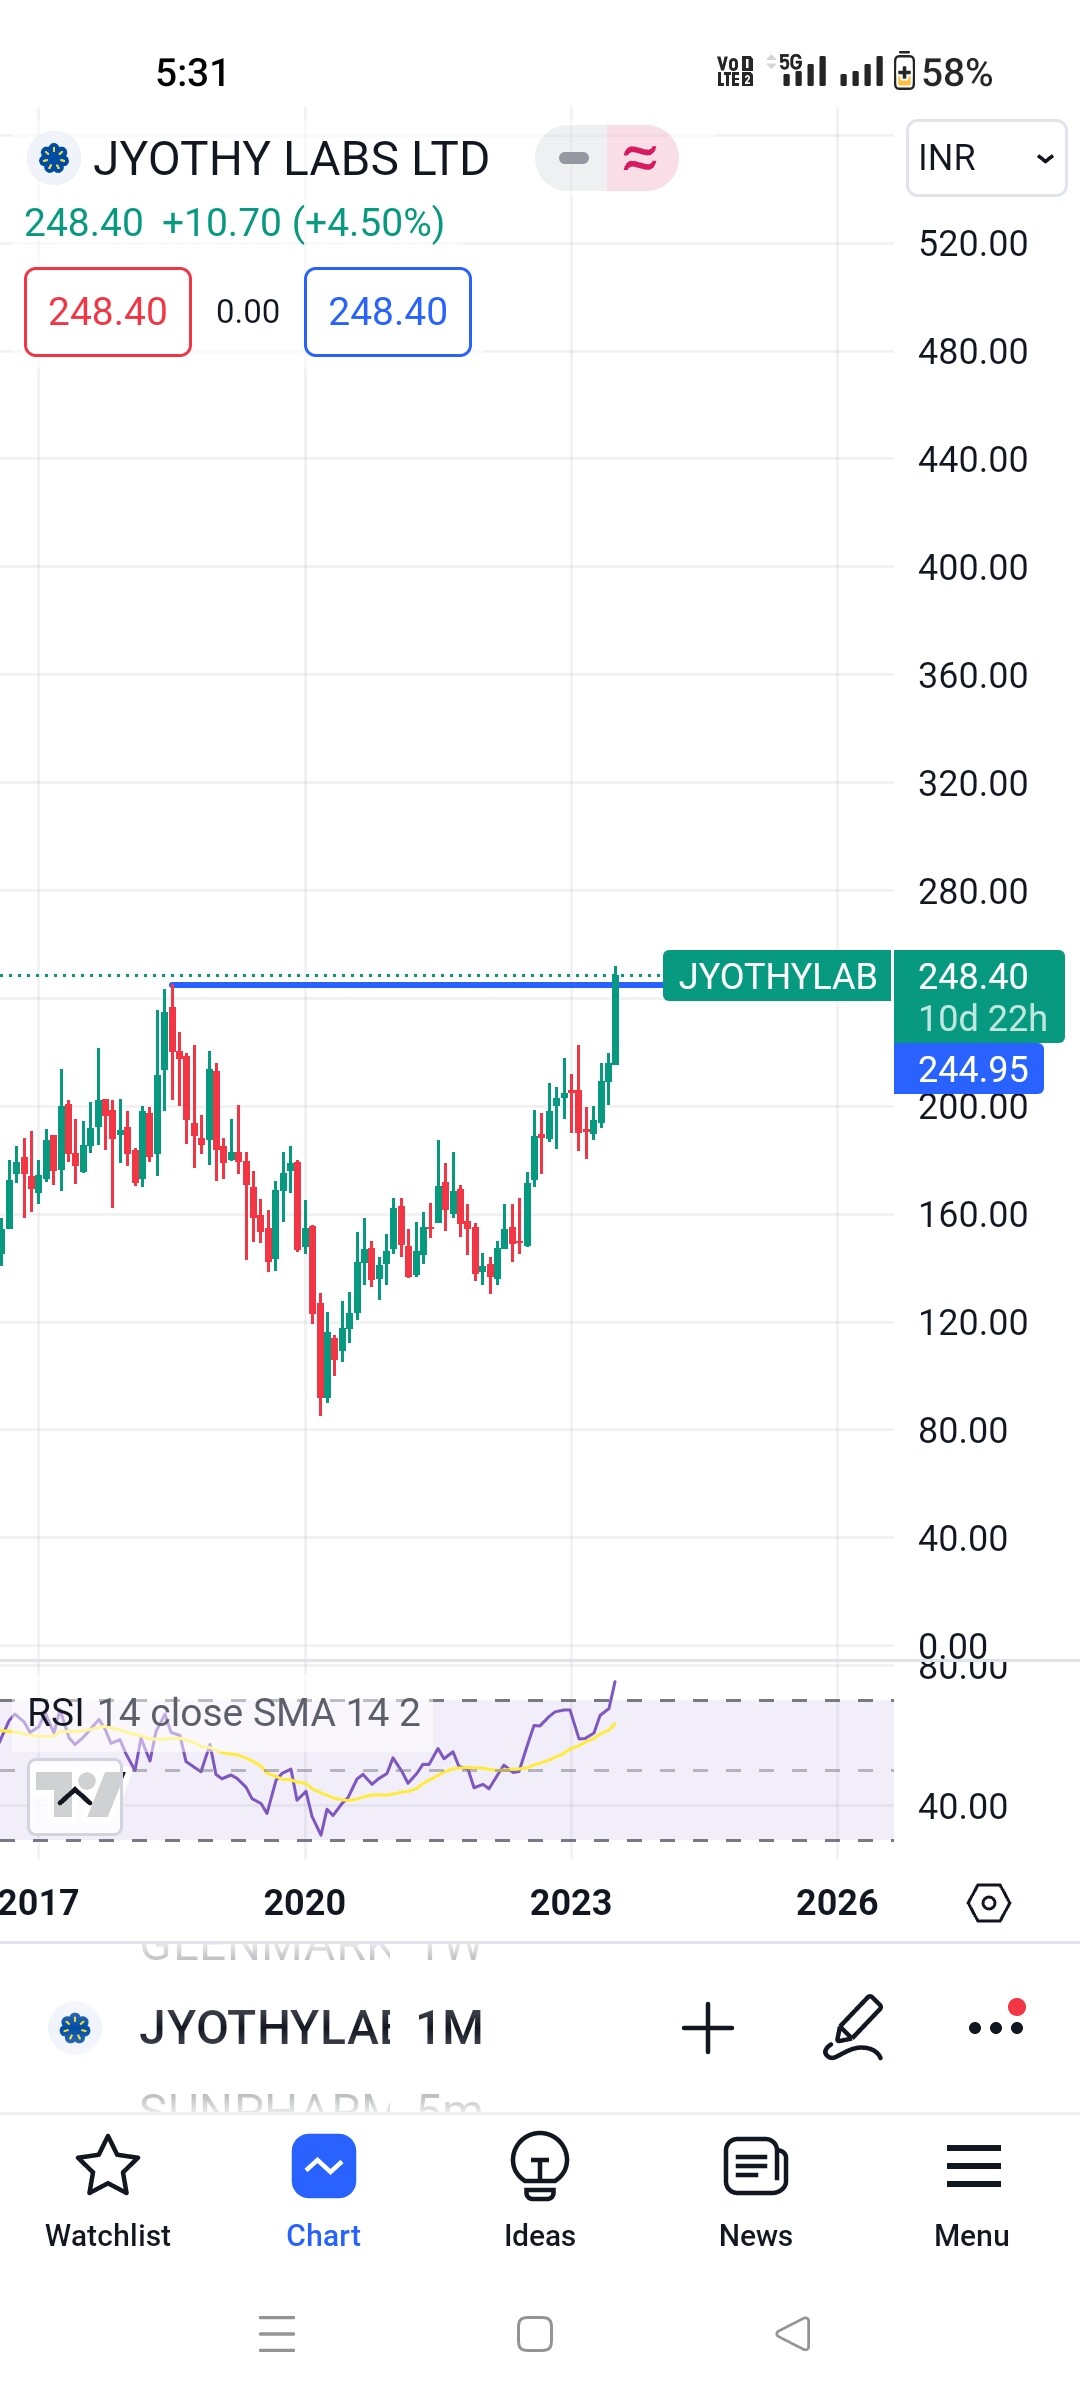
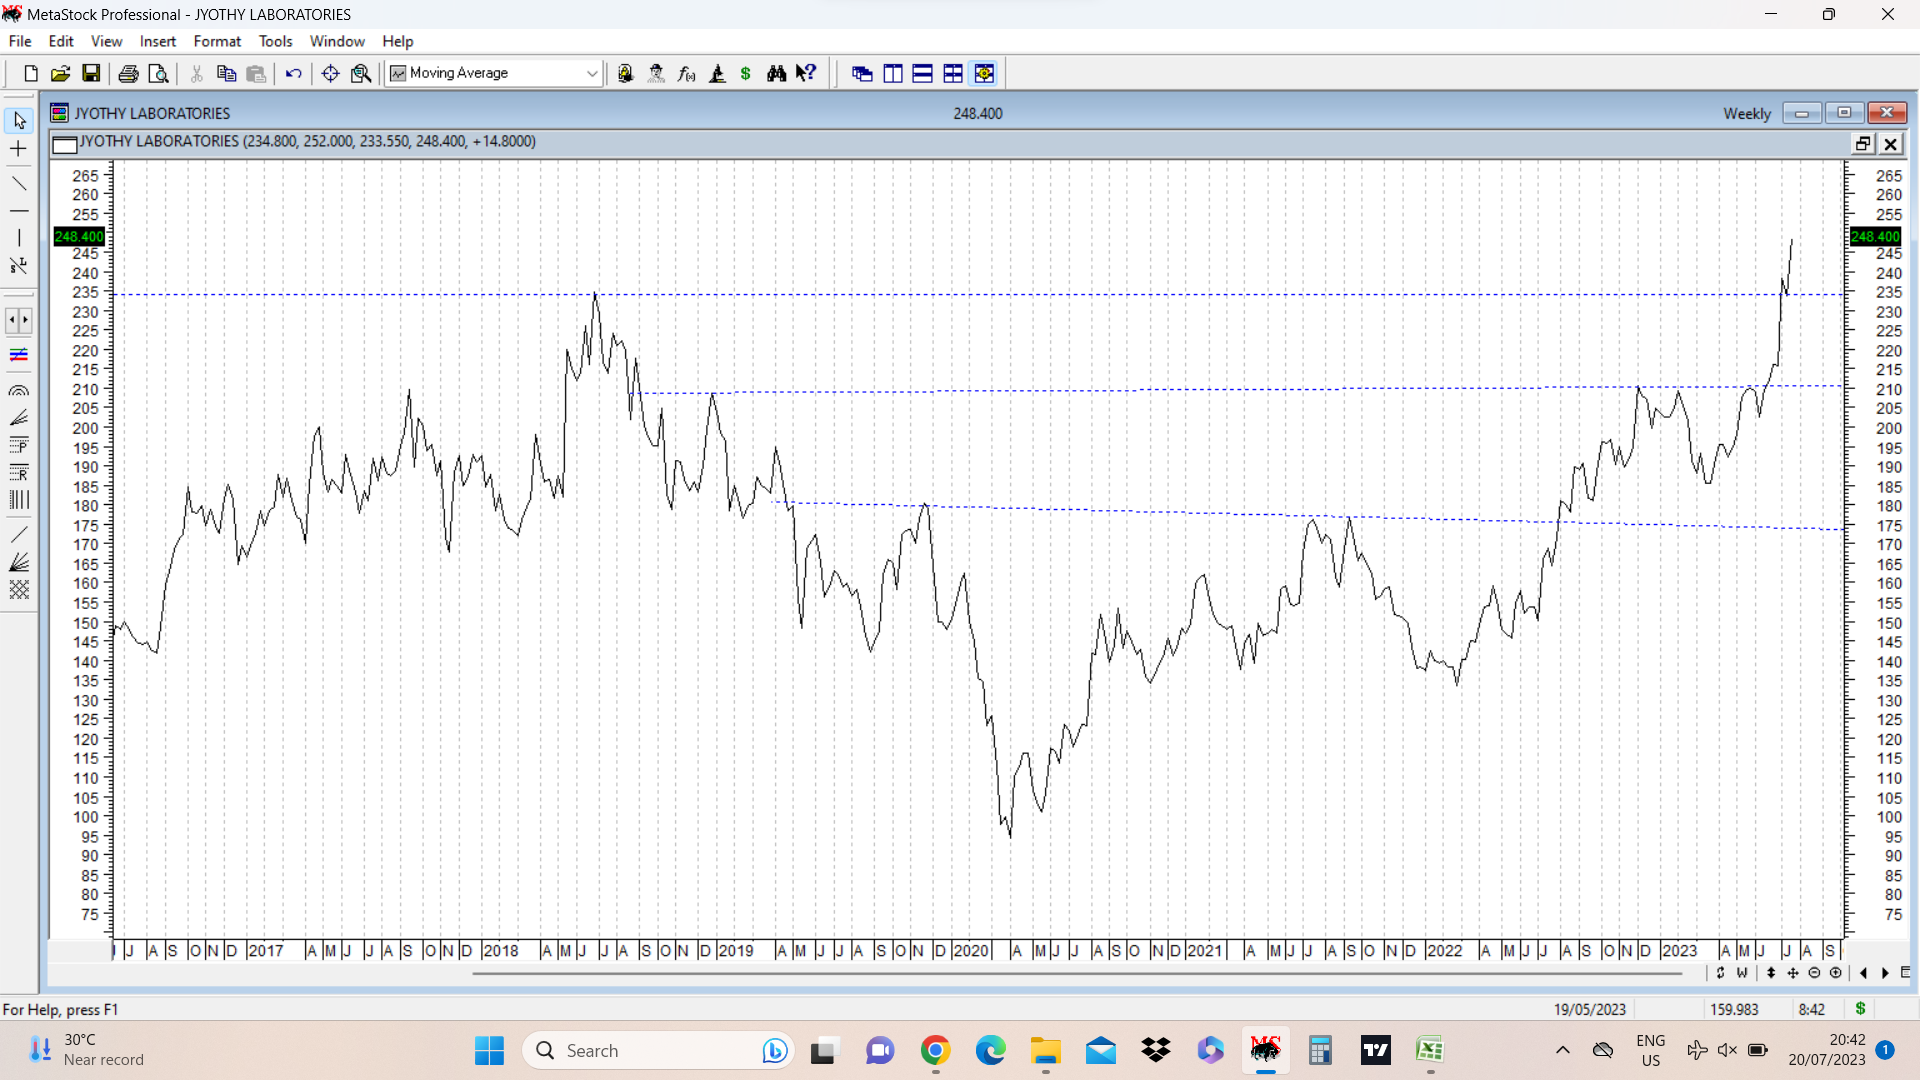
Jyothy laboratories today closed above previous all time high of 245. The attached chart shows two inverted head and shoulders breakouts and the recent all time high (weekly closing basis which is 235 as compared to all time high of 245 seen on bar charts) breakout above 245. This company has been under my watchlist, but due to scarcity of funds, I have not been able to take a position here.
18 Likes
sir, if its closed above 245 , previous all time high on a monthly time, then we can make a new positions in jhothy labs ?
Just a quick update on this stock. It reached a high of 805 in the last trading session and was up more than 10% yesterday. Some Profit booking can be expected in the near term because of the negative new by Infosys Results. It can retest 700 levels which was it’s long term break out point.
Disc: Invested for swing trade
We are here to learn momentum investing and technical analysis wherever possible. It’s beyond the scope of this thread to give advice on whether to buy or sell, as I am not a registered advisor.
Whenever a stock breaks through all time highs, it can either go up another 20-30-50% and cool off, or consolidate in some form, usually triangular form for a few weeks, or months and then move up, or correct from those levels and consolidate and maybe sometimes form something like a cup and handle formation… So we have to observe and take a call. I don’t have any positions, so not biased either ways. Chart posted merely for academic purposes especially to see how stocks that have cleared ATH behave.
17 Likes
Aether Inds was a recent listing and on first look appeared extremely expensive. Sales for fy 23 is 650 crores and market cap is 10000 crores with PE of above 100. Company has done lot of capex with assets nearly doubled in last year and talking about another 750 crores capex in next couple of years. Promoters hold 81% stake. Concall provides a bullish scenario for the company. But I still cannot get my head around the valuations.
One of the models I have seen succeed in technicals is a stock clearing its Post IPO highs and consolidating. Aether is an example of this phenomenon. It listed in June 22, and posted a swing high of 1048 and underwent consolidation and traded broadly between levels of 800 and 1050. In 2023 it crossed this range and posted swing high of 1209 and is retesting the breakout zone and currently at 1058.
There are a lot of examples of big winners quoted by the likes of Mark Minervini wherein he states that even the starting valuations are expensive and the stock moves up and keeps getting expensive. Here in case of Aether there is promise of growth and a part of the business is somewhat niche. I am posting this live example to see how things pan out. disc: no positions, but in watchlist.

20 Likes
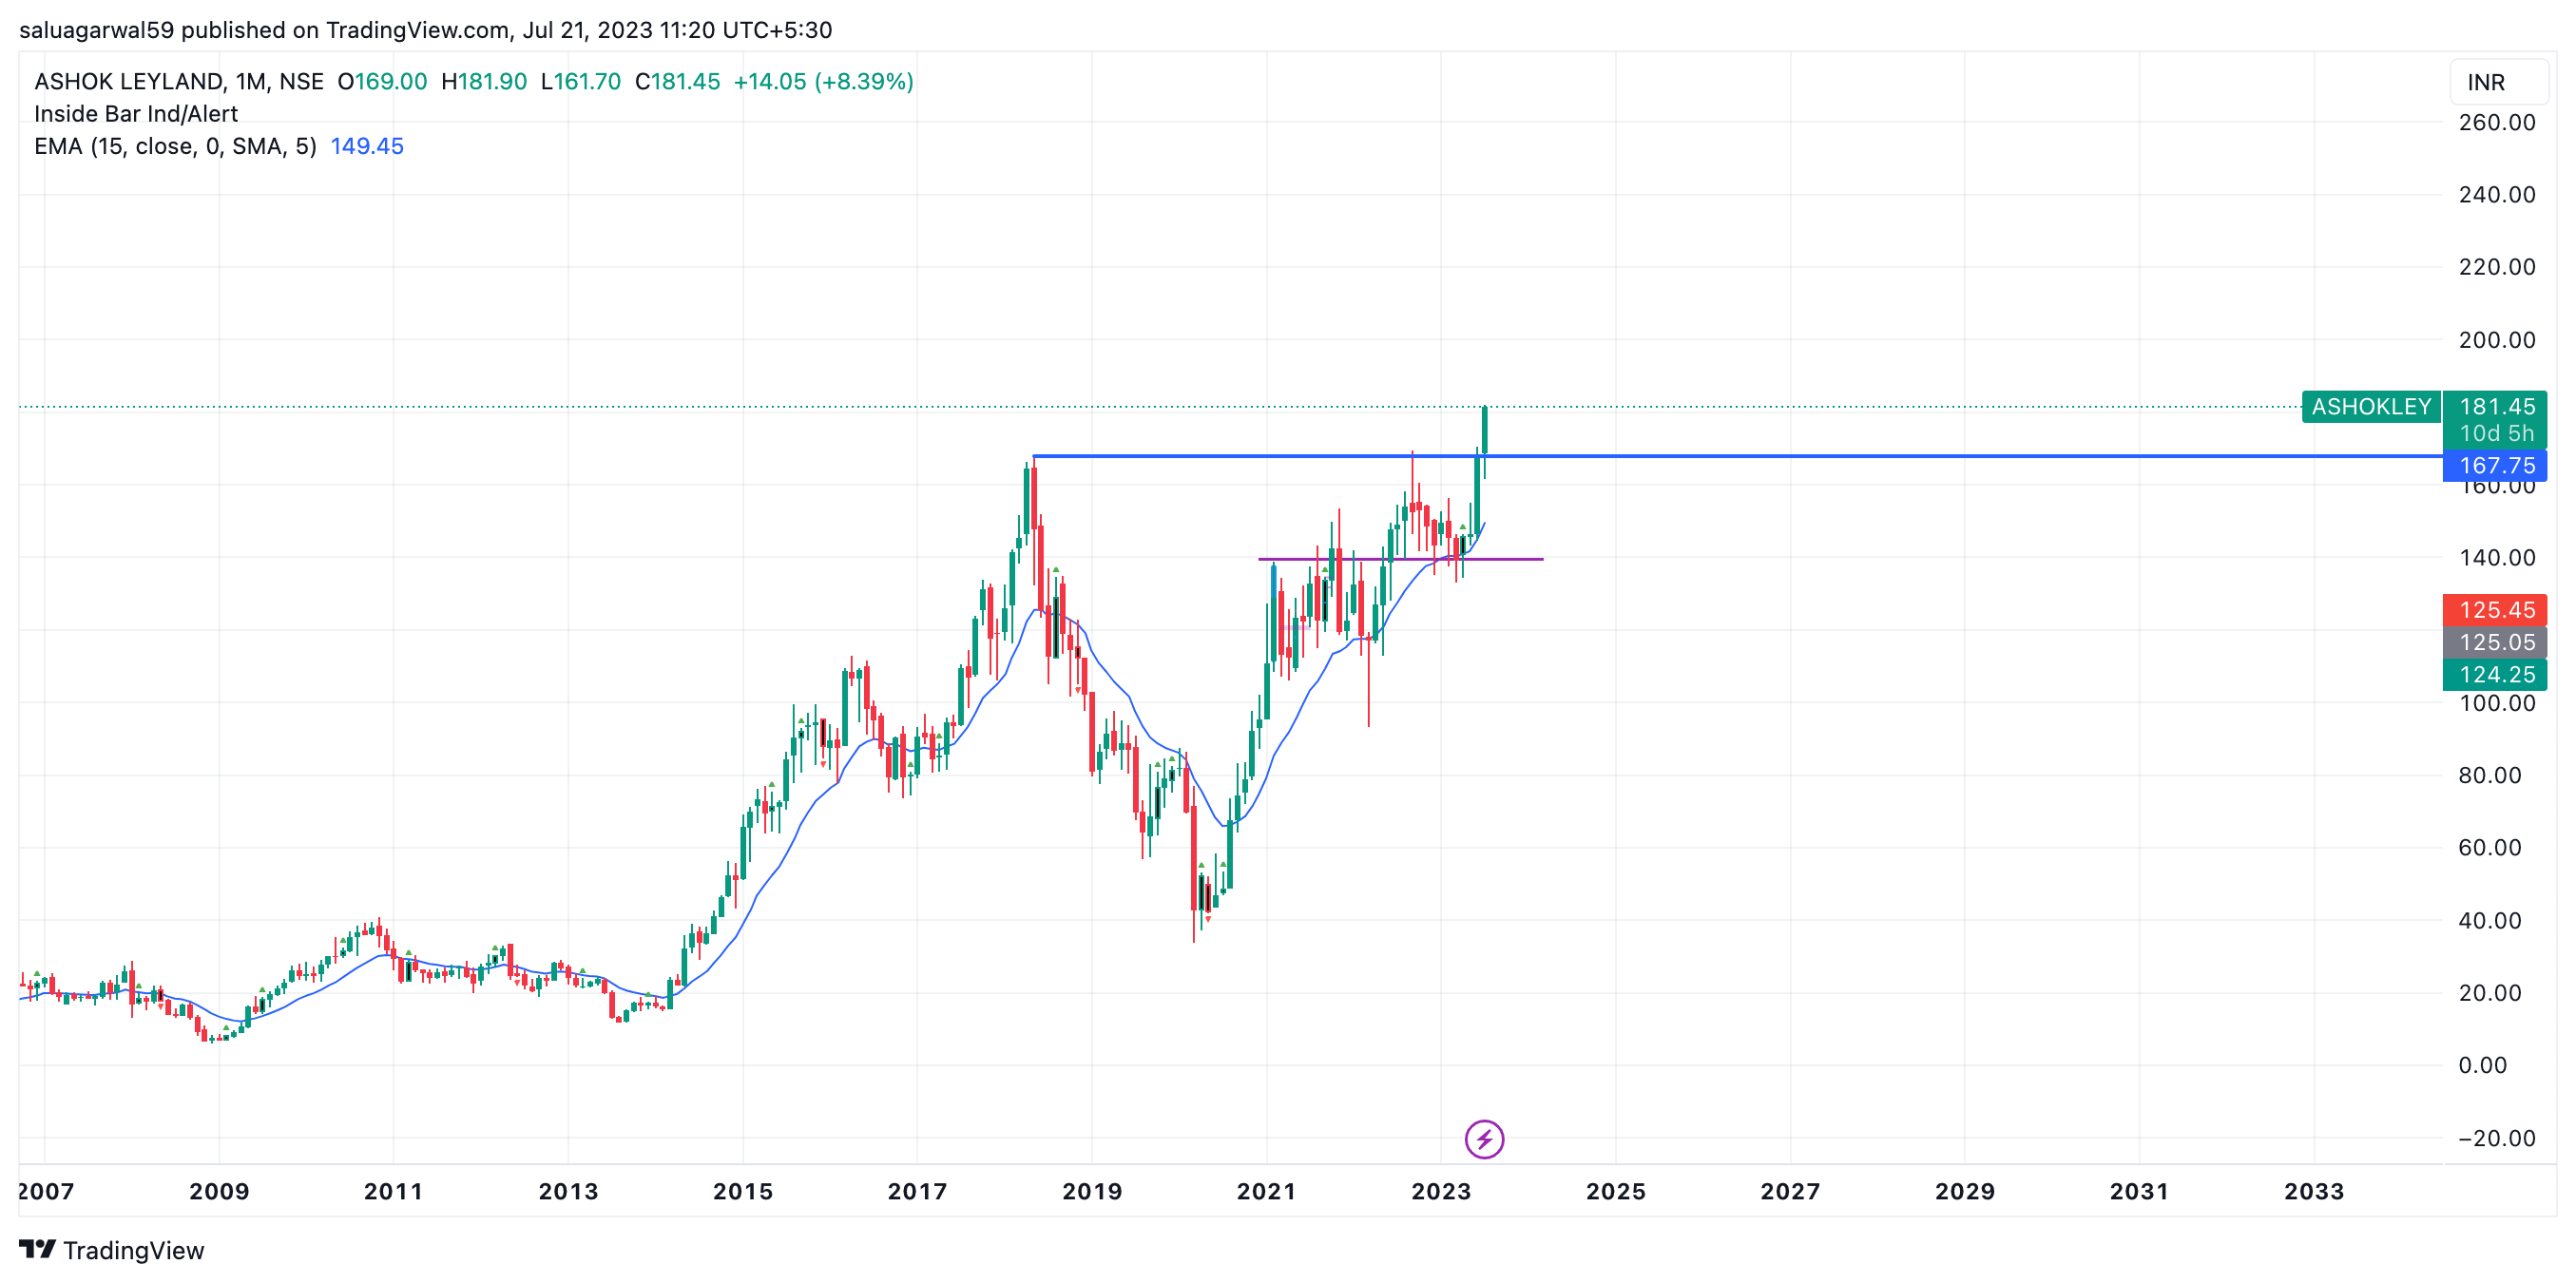
ashokley is above all time high… and break all time high after some consoldiation near all time high.
3 Likes
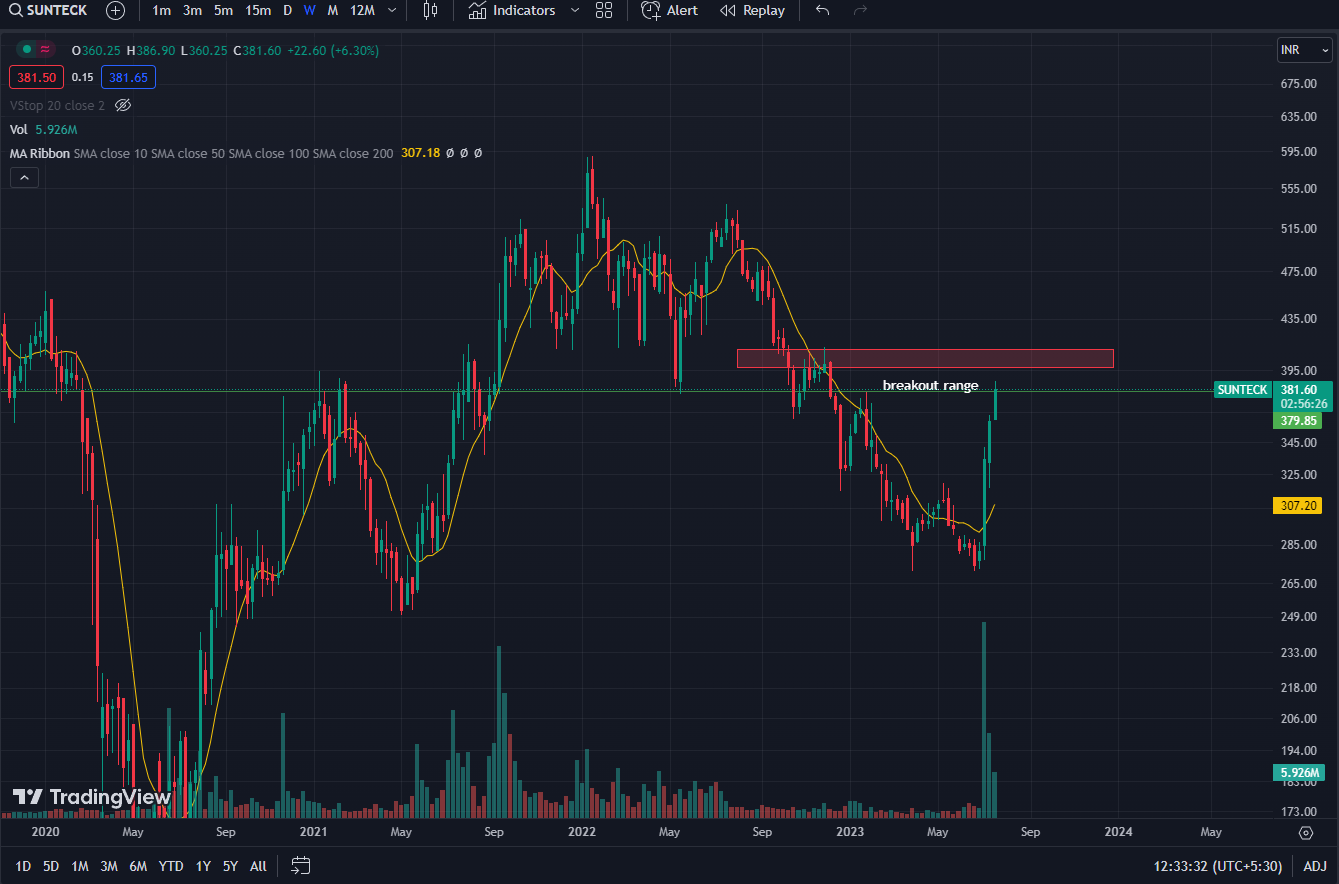
Is anybody tracking Sunteck realty? Good traction of volumes on weekly chart, possibility of a breakout from the current levels.Current fundamentals also speak well. I also believe there’s a head and shoulder pattern being formed here. A resistance zone at 400-410 levels. I think can it can give a breakout from the current levels. Would really appreciate everybody’s thoughts and views.
1 Like
Might be a naive question here…
How does one choose a specific timeframe for a chart?
Let’s say one wants to buy now and sell after about a month of buying. Which timeframe of the chart should he/she look at?
1 Like
Usually for medium to long term ( few months to year and more) delivery based buying, time frame to look is weekly charts. For short term trading for a few weeks , daily time frame is suitable.
8 Likes
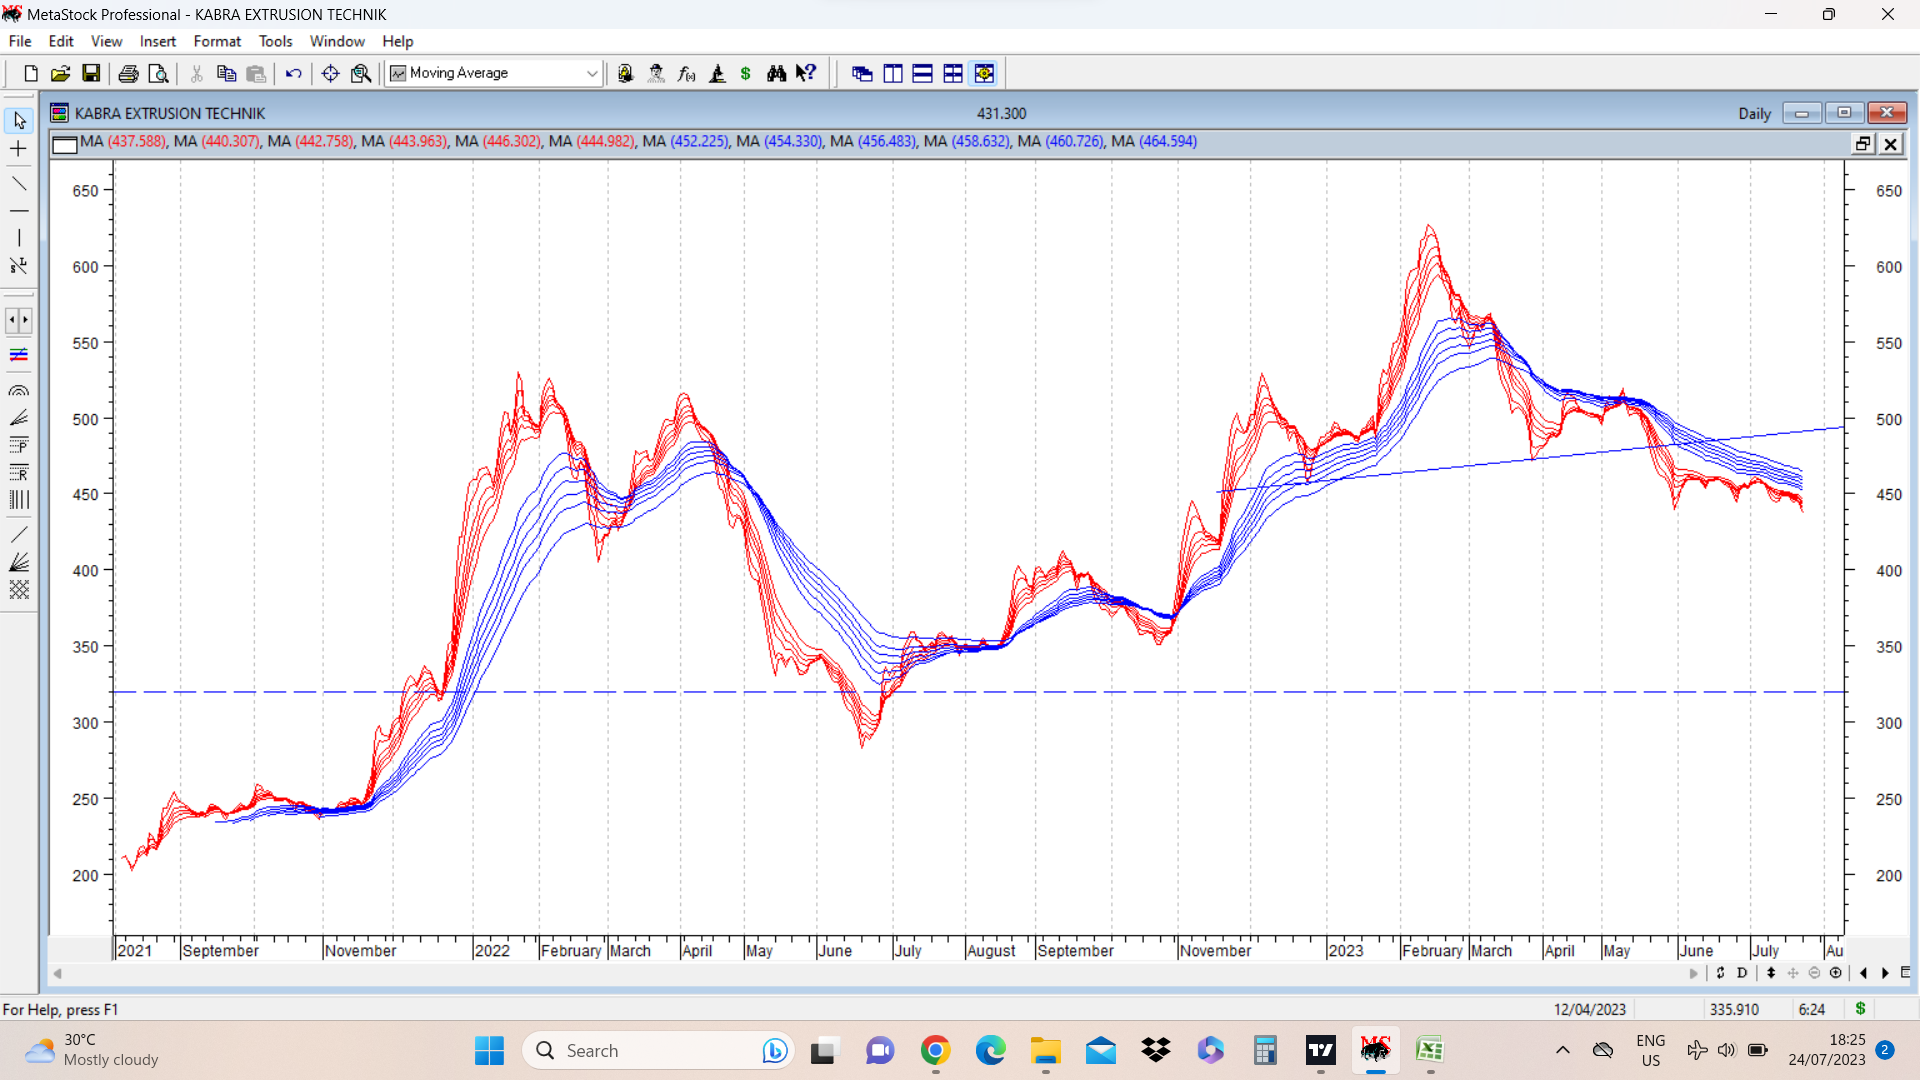
Kabra extrusion (cmp 430) gave a head and shoulders breakdown in past few weeks and potential target for that pattern is around 320. However we need to see whether this pattern plays out or goes on to develop a failure pattern, in which case stock price can give a good upmove once reversal happens.
disc: no positions… not a recommendation.
9 Likes
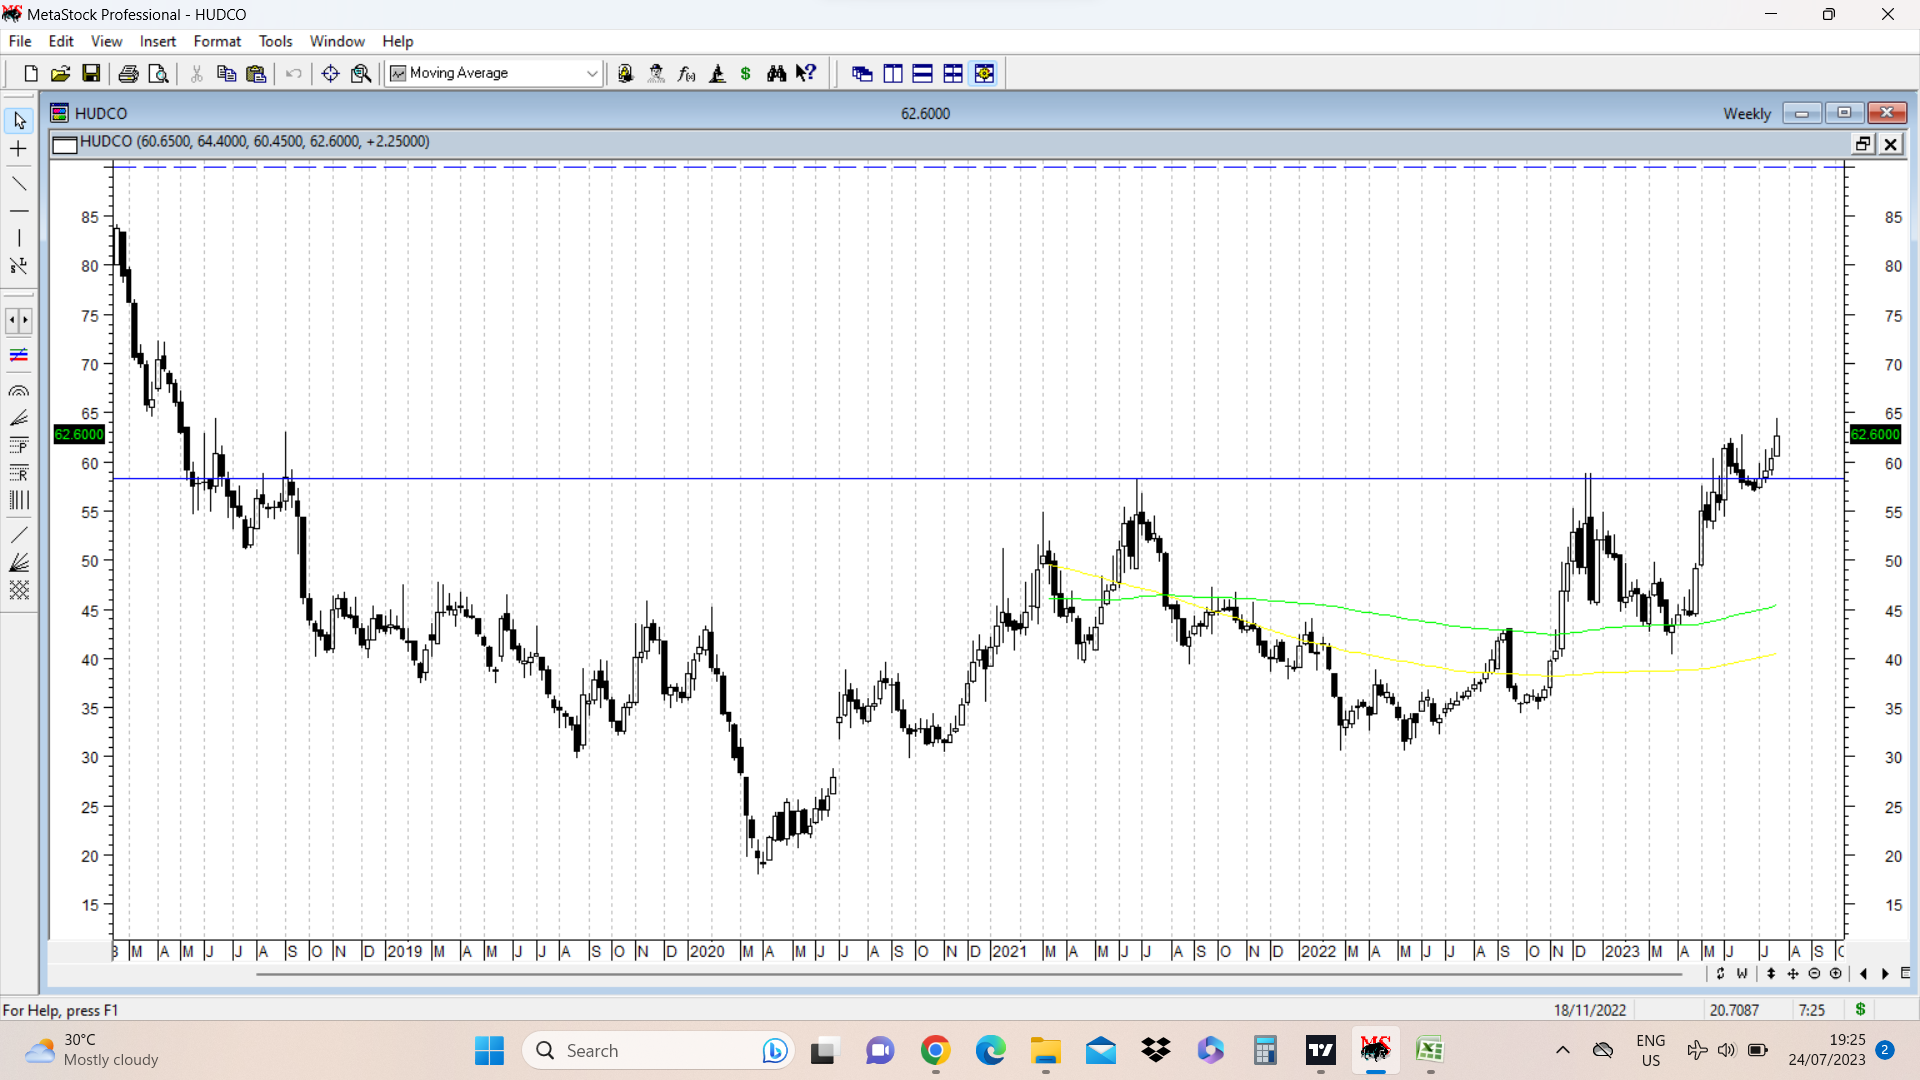
HUDCO today attempted to cross its resistance zone of 60-62 and managed to close above 62, with volumes much higher than preceding few days.
Level of 58 as shown in chart was a strong rejection zone on three ocassions during August 2018, June 2021 and Dec 2022. Finally in June 2023 stock price managed to close above this crucial level on a weekly basis and then went down to retest the breakout zone for 6 weeks with very small bearish candle sticks with low volumes ( a sort of volatility compression), and then since past 4 weeks we have had bullish candles and finally today previous swing high of 62.80 was breached and stock price posted a fresh swing high of 64.40 before settling just below 63. We need to watch where the stock price closes for the week. Ideal confirmatory sign would be a strong close with a big bullish candle.
disc; invested as disclosed before.
12 Likes
GAIL cmp 116 broke out of a cup and handle pattern. Chart put up has line chart of GAIL and neckline is drawn in blue solid lines. The handle also shows tight consolidation between levels of around 104-111. Potential target for this cup and handle pattern is 135. ( Next longer term bar chart shows a 4 year breakout above 115) disc: invested as a techno funda bet.
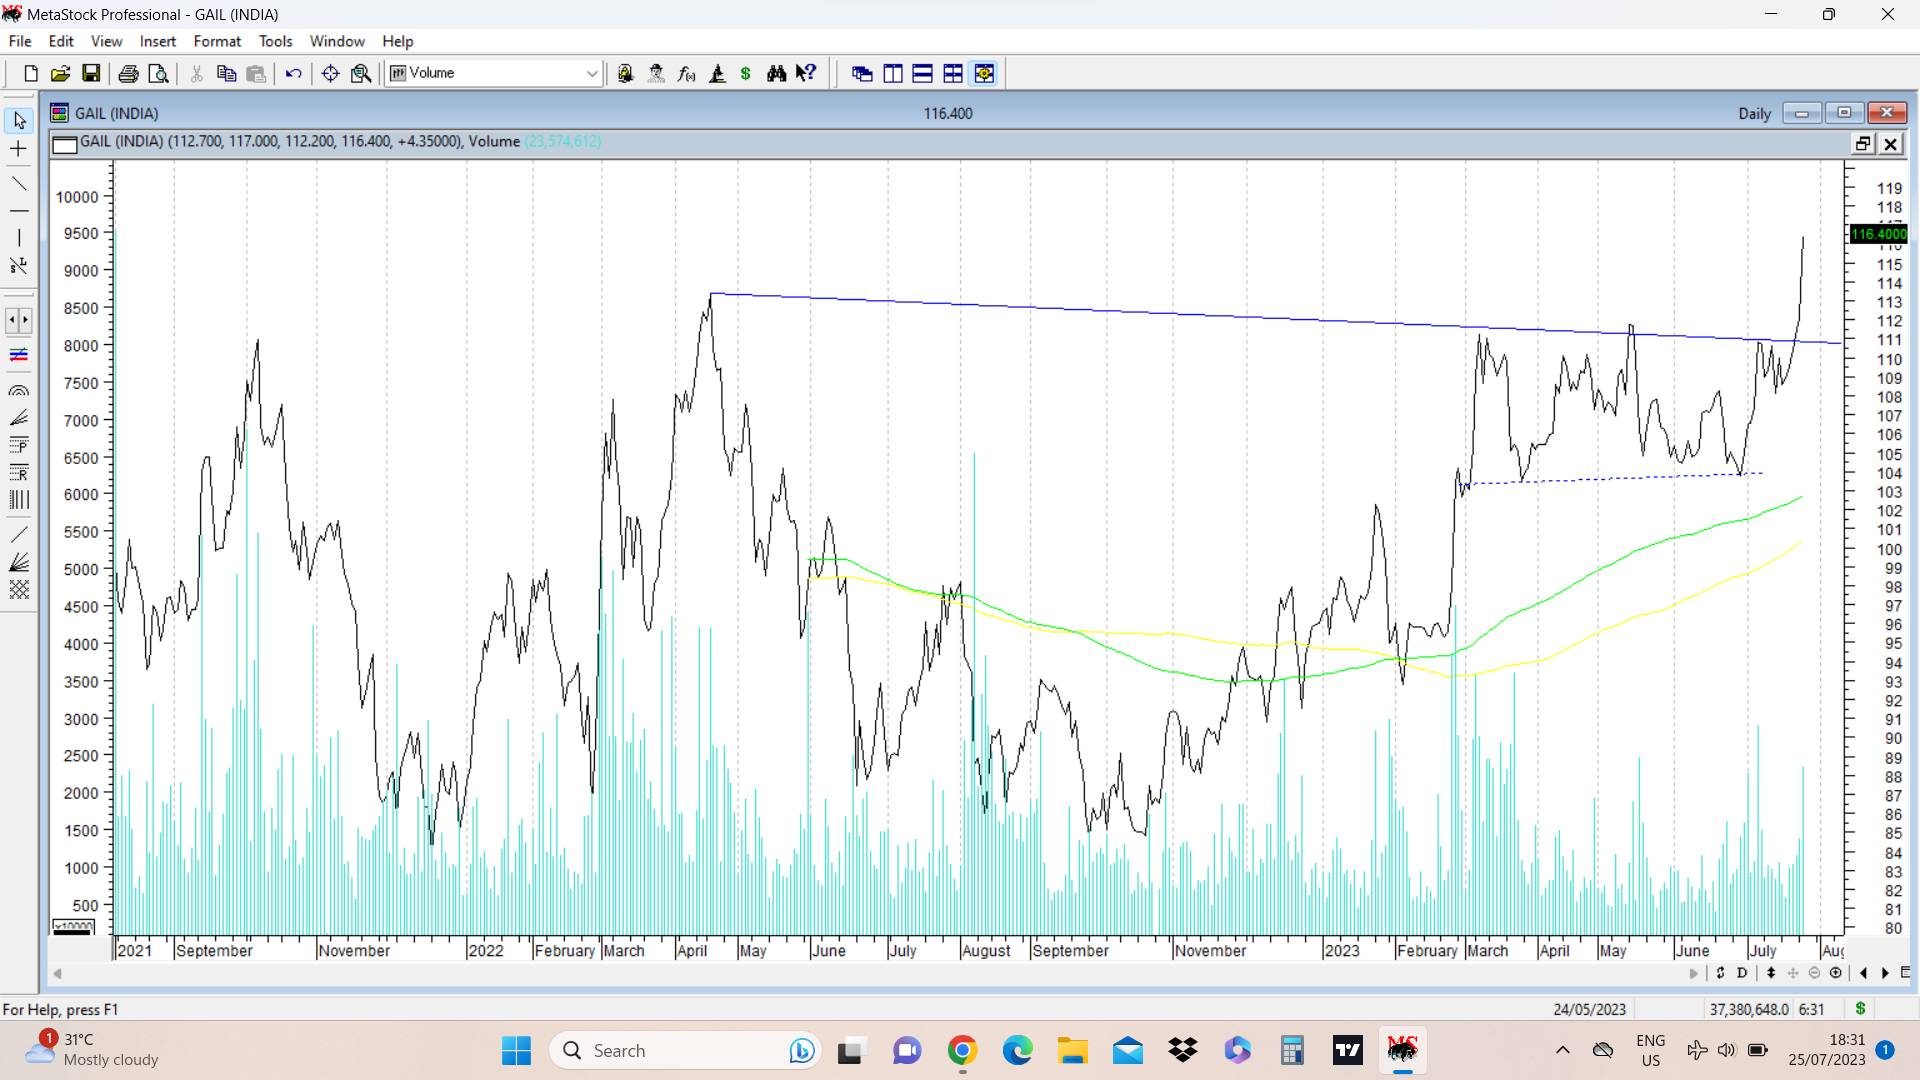
11 Likes
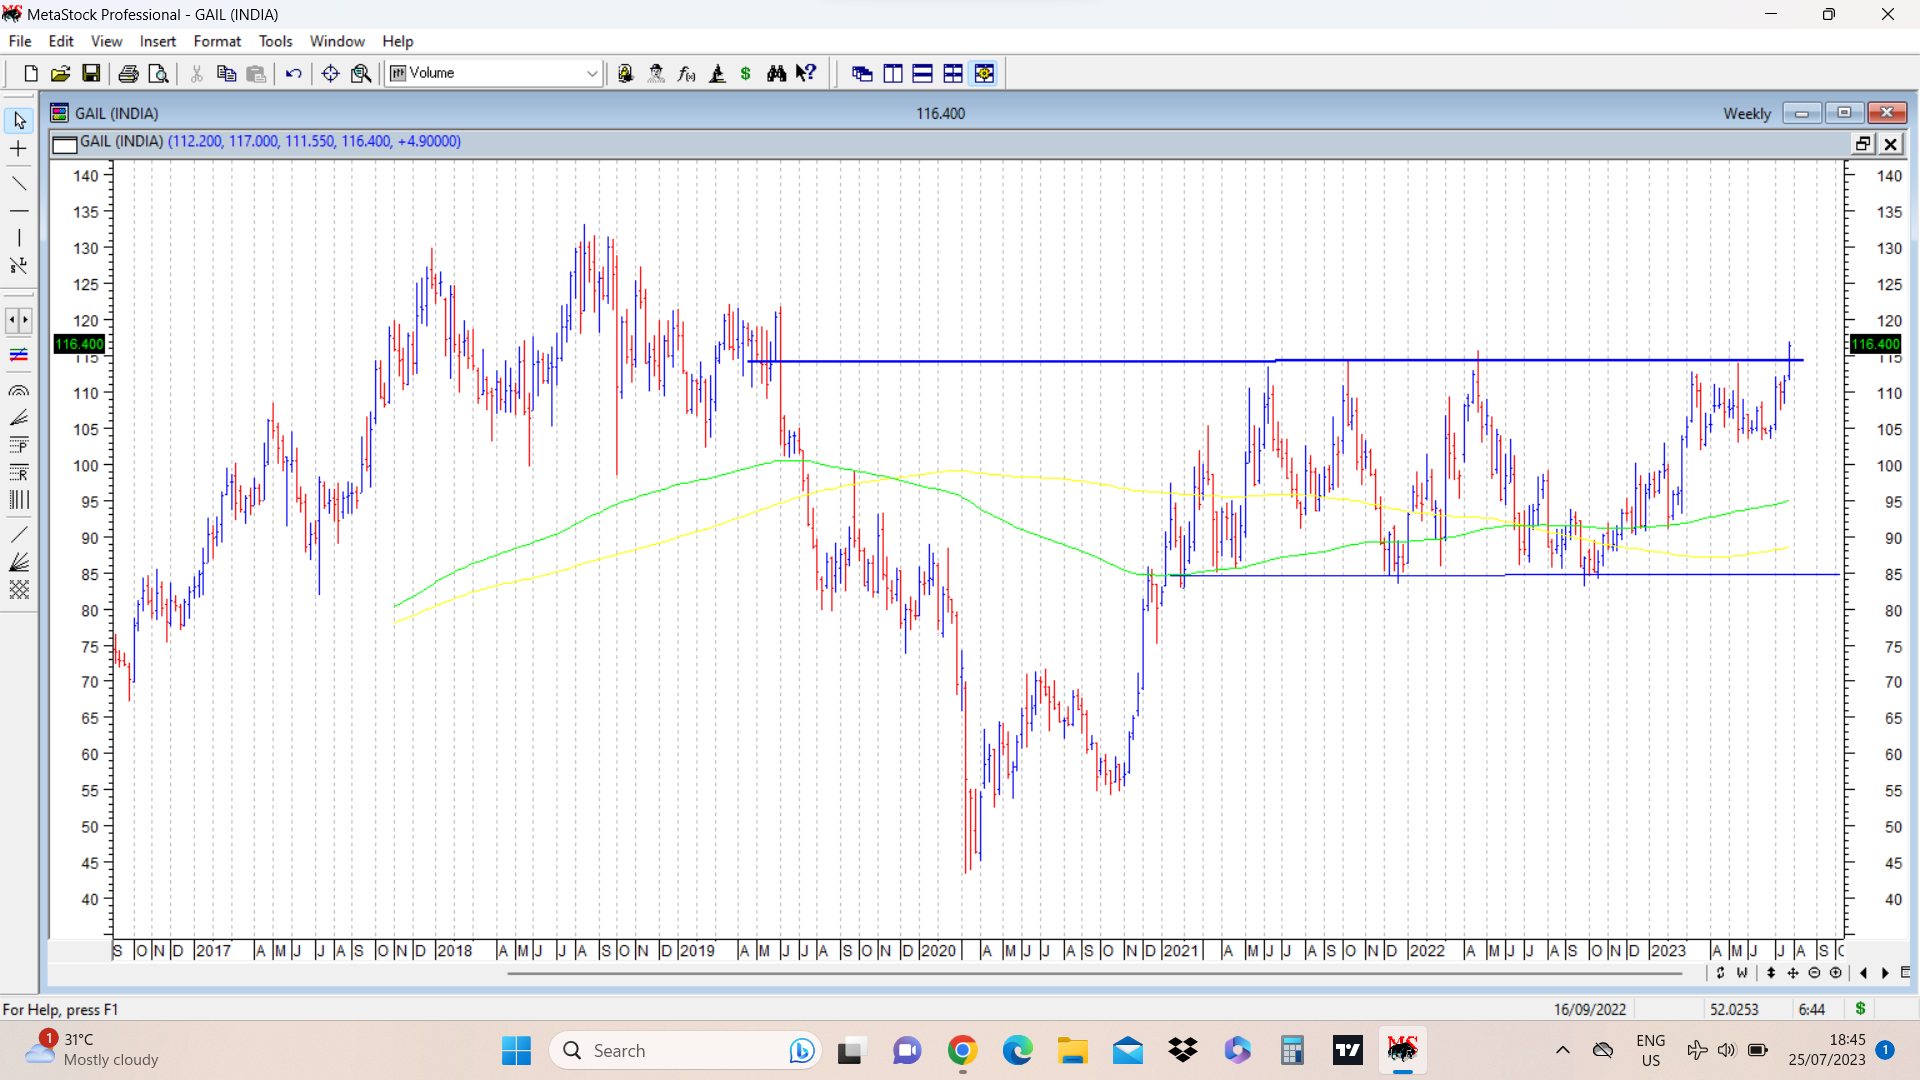
GAIL weekly bar chart. It shows a dark blue resistance line which offered resistance at around 115 for multiple times in last 2 years. Finally today stock price managed to cross this important resistance and close above it. We need to watch out for the all important weekly close.
Depth of the pattern ranges from 45 ( nearer to Covid lows) or slightly higher bottom of 55, to 115 ( resistance faced multiple times) Many analysts calculate the range ( 115-55 = 60) and add to breakout point ( 115 + 60 = 175) to arrive at potential targets.
A horizontal channel drawn on chart shows consolidation between 85 to 115 for nearly 2.5 years. ( extending from Jan 2021 to current time frame)
However since the chart is weekly chart, time taken to achieve target can range a few months to year or more. disc: bought recently as disclosed in earlier post)
This is one of the most interesting chart for me as it was on my watchlist since a long time because of the long consolidation between 85-115. I want to observe first hand how things play out from these kind of prolonged tight consolidations.
15 Likes
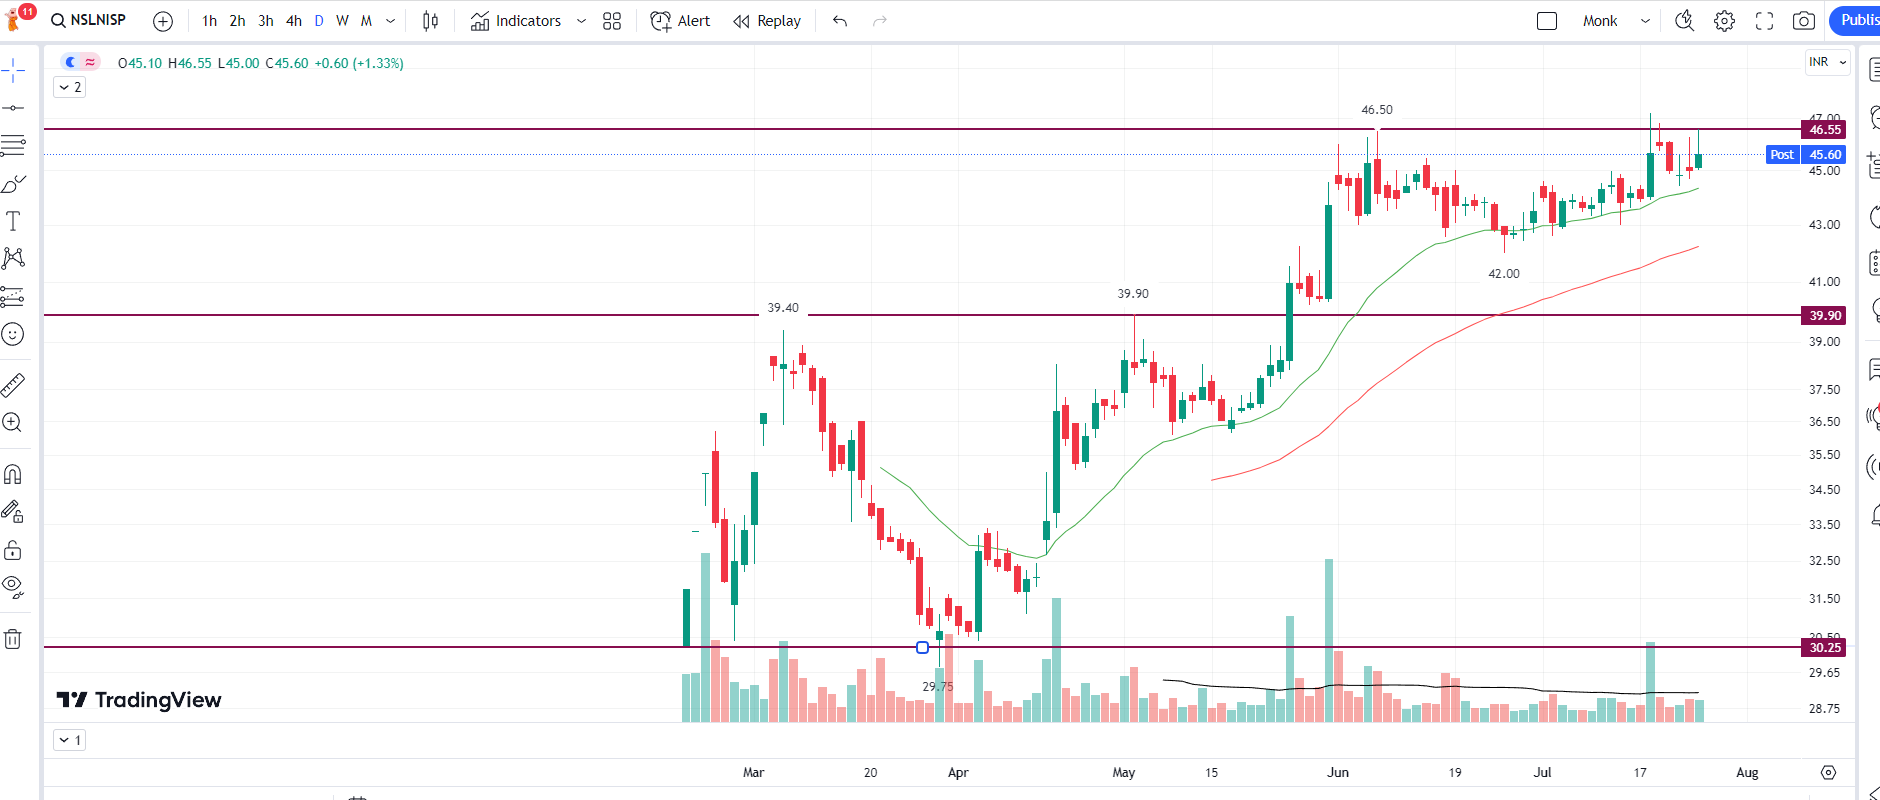
Interesting techno funda situation. NSLNISP consolidation after giving breakout at 40. It found support at 30 after listing. Awaiting call for financial bids. Check out discussions in the fundamentals thread for more information.
Disc: Invested
2 Likes
Hello Sir …
This has played out exceedingly well. Just wondering how do you determine the profit booking strategy after this kind of move?
Do you book partial profits at your target levels or ride the wave with trailing SL ? In either case, how do you go about determining the target or SL level (given that 200 dma is a very steep fall from cmp for support levels)