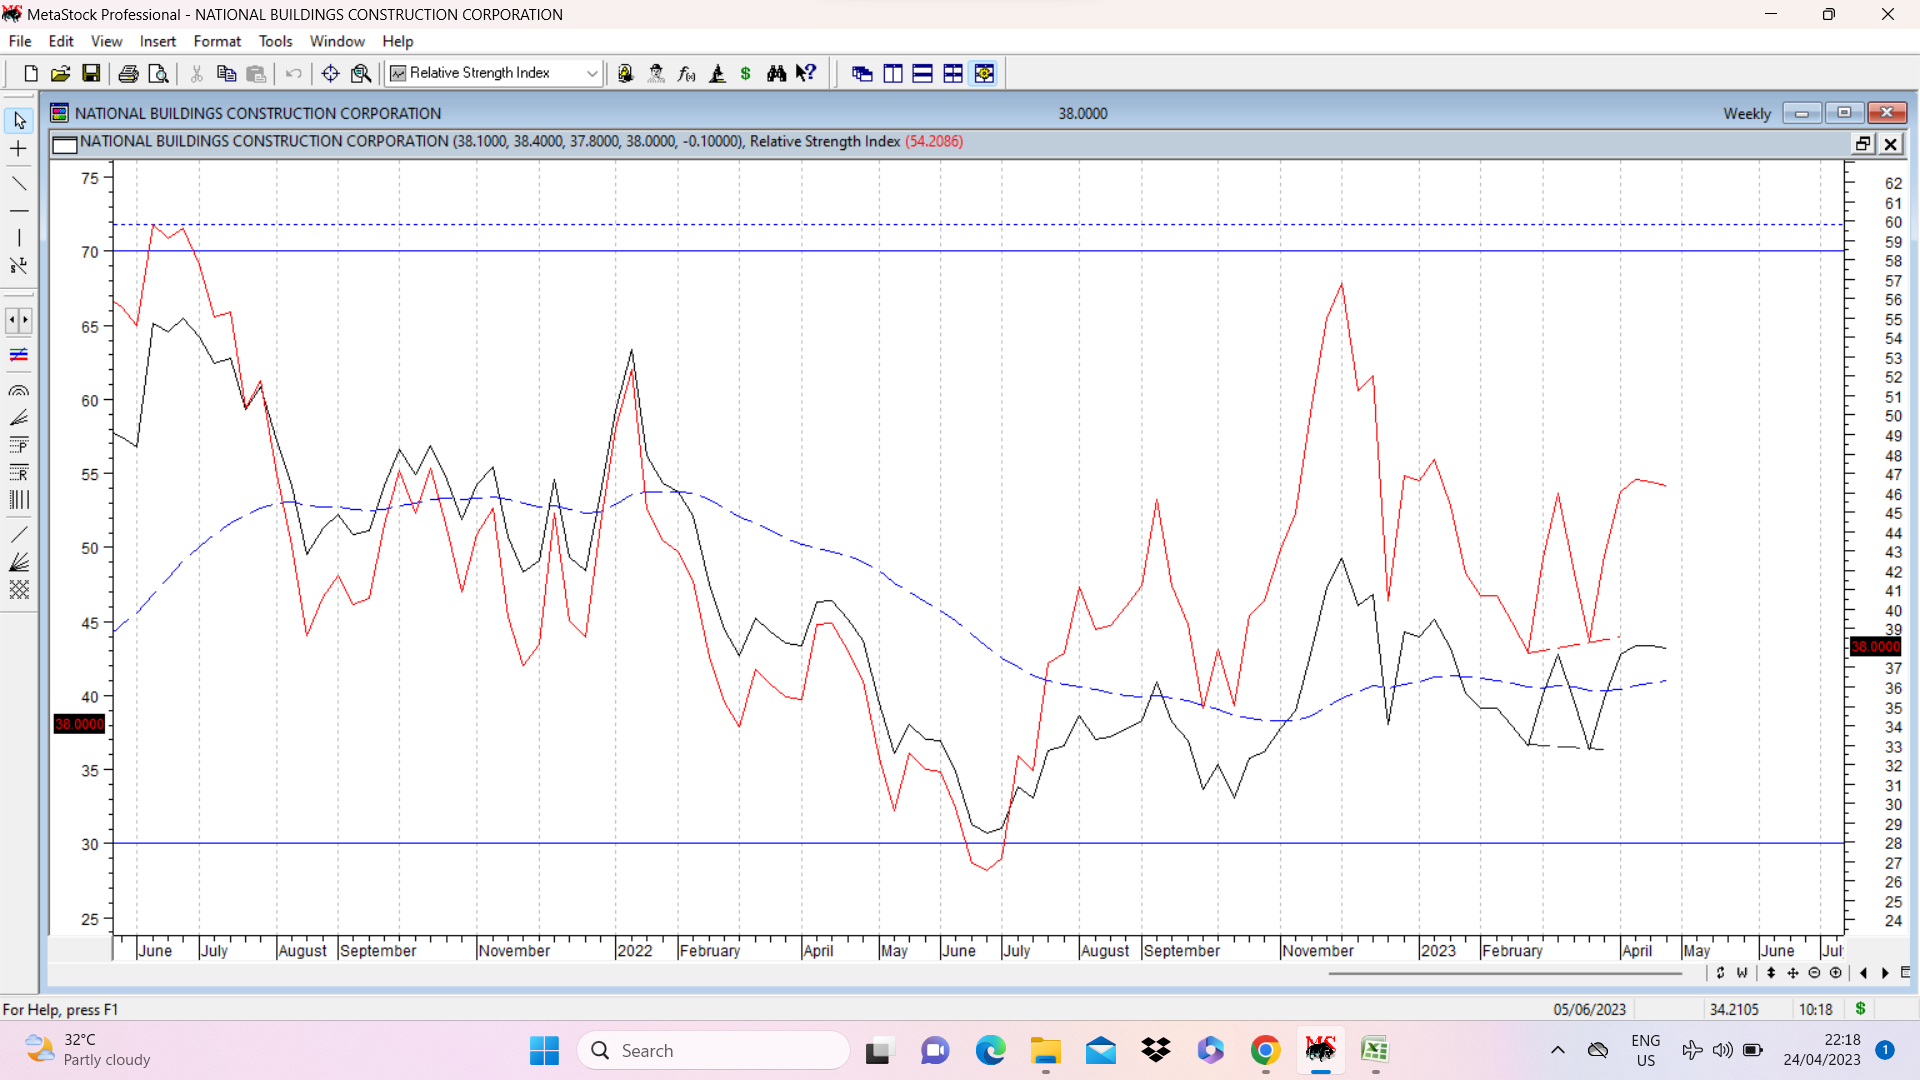
NBCC is another chart where positive divergence is visible on weekly chart. Stock price posted a lower low (shown in dotted black line joining weekly closing prices on the line chart) and RSI shows a higher low during corresponding period (marked in dotted red line) Dotted blue line shows all important 30 WEMA which after remaining flat has started moving slightly up and price continues to maintain above it.
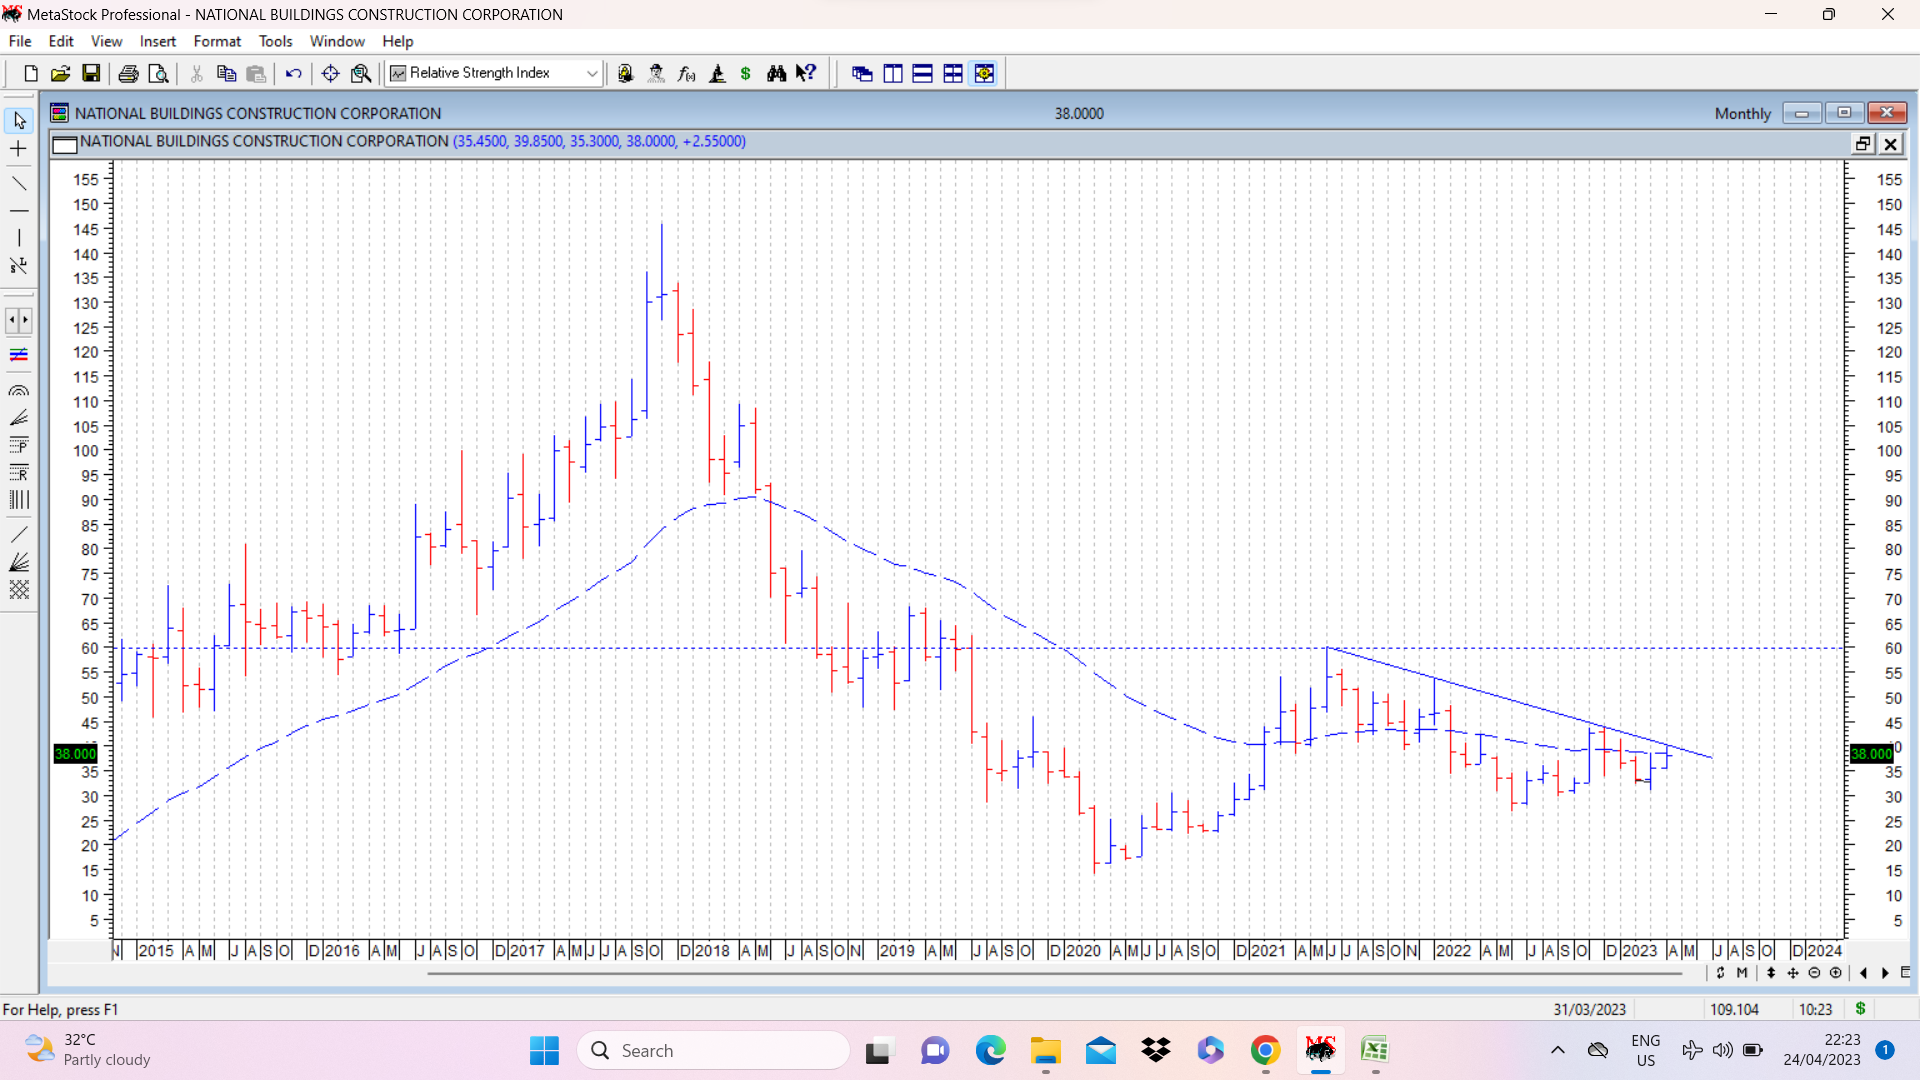
A monthly bar chart also attached shows a falling trendline and a breakout past 40 would indicate bullish sentiments in medium term. Above that major breakout levels are around 60. disc: invested as a technical bet.