
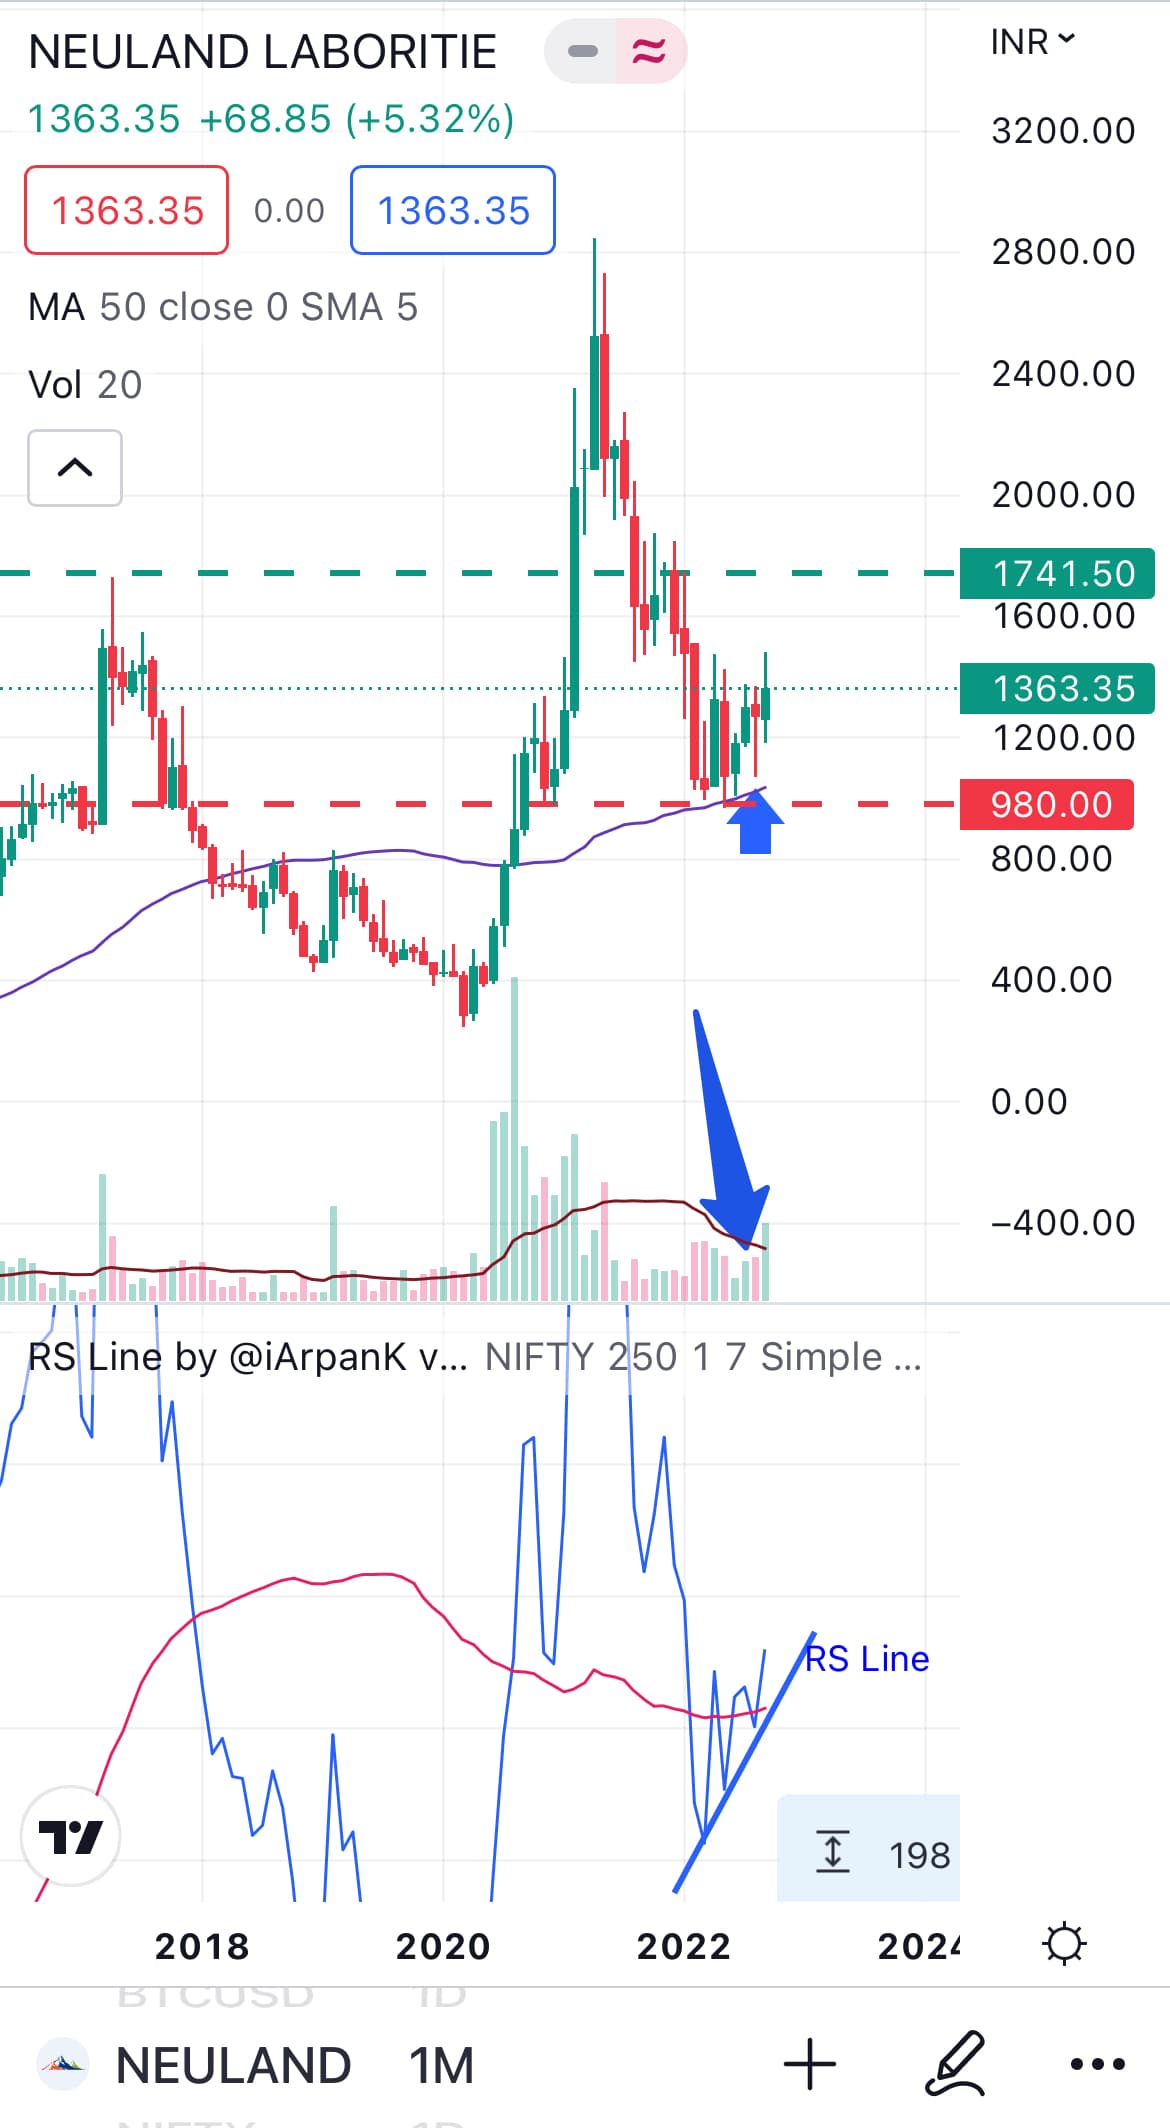
The RS is in uptrend, Price took support at 50 MA & consolidated for a long time. August candle had larger wick & lesser volume.
On weekly chart, the RS line crossed 50 MA this week only.
Price action appears to be in favour uptrend.
2 Likes
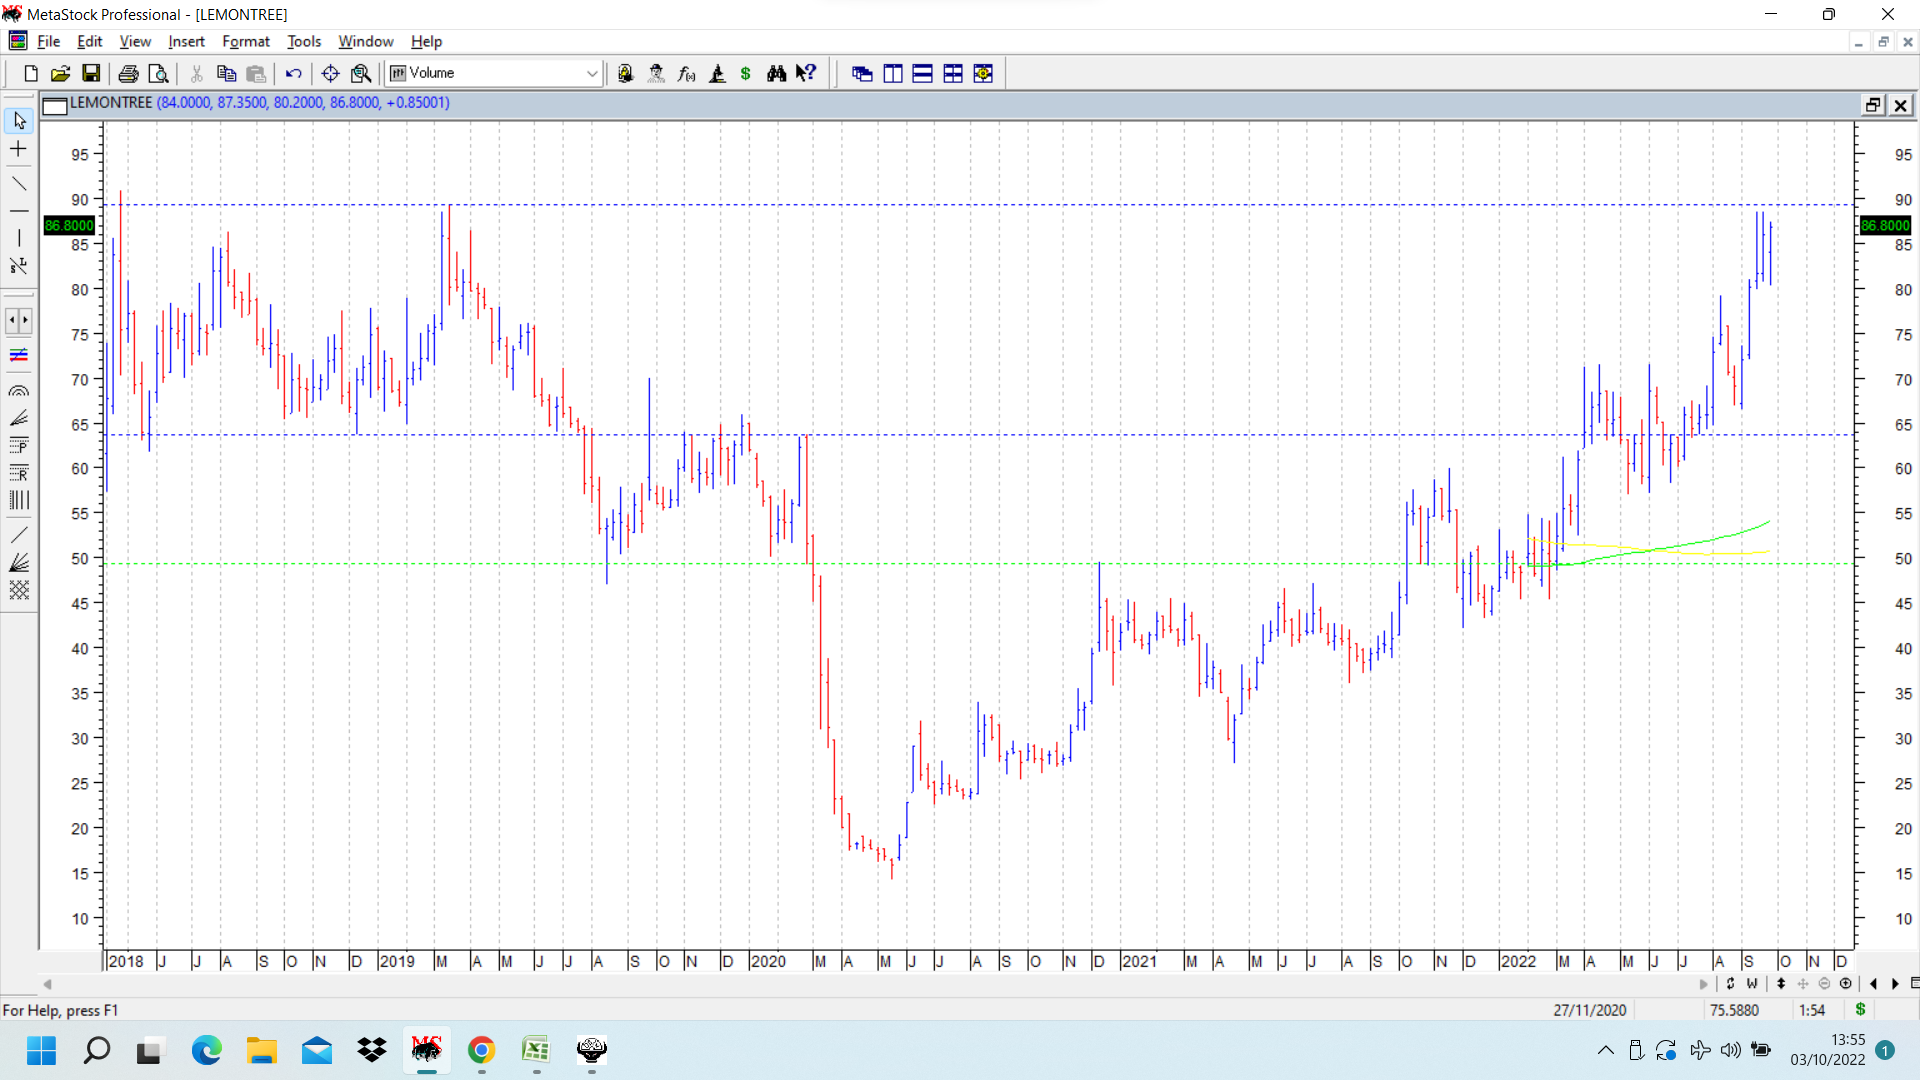
Lemontree charts have been posted in the past on this thread and updated. Today it crossed the recent swing high of 88.50 and posted an intraday high (till now) of 90. Previous all time high was also very close at 90.90 immediately post listing in april 2018.
On the left side of chart, we can see a lot of consolidation between 63-90 which took place between April 2018 to July 2019, (marked in dotted blue line) after which the stock price broke down and posted a Covid low of 15. Recently this zone of consolidation I mentioned of 63-90 has been offering resistance to any strong upmoves.
Most interesting thing about this stock’s chart has been that Nifty entered a longish correction ever since Oct 2021 and Lemontree has been in a consistent uptrend since Oct 21. It broke out of a cup and handle pattern in Oct 21. (neckline marked in dotted green line. ) In fact it has made consistent higher highs and higher lows on weekly chart posted below. Other hotel stocks too have run a lot.
Above 90-91, the stock price will post all time highs and enter into free zone, and can go up without facing significant resistance from any stuck positions. I have my fingers crossed to see how this stock moves once it goes past strong resistance, whether there is any parabolic move or steady upmove, or failure.
This looks like an example of a stock going against overall market trend. Mark Minervini frequently discusses these kinds of stocks in his videos and books.
disc: invested as disclosed before.
26 Likes
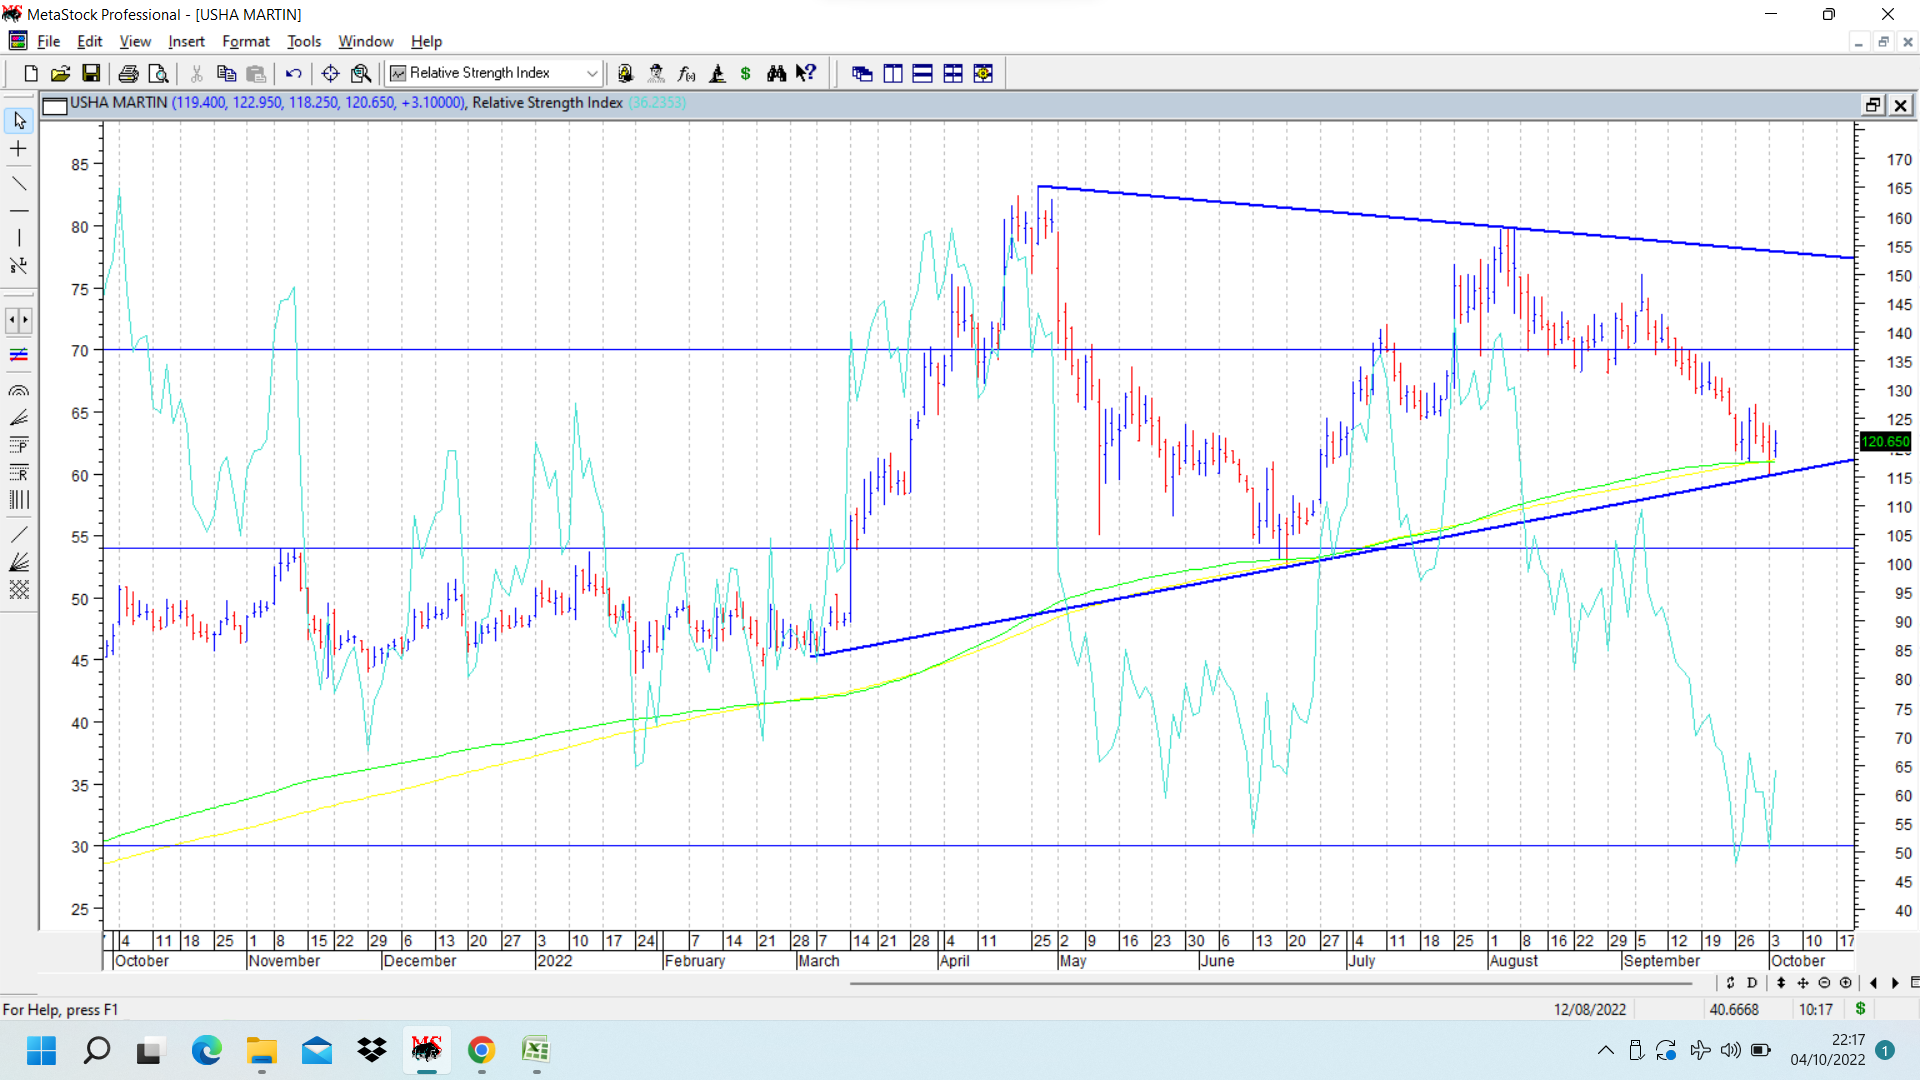
Usha Martin is currently trying to take support at around its 200 dema at 118. In the past too it took support at its 200 dema when stock price was at 100.
It seems to be forming a symmetrical (or contracting triangle) triangle as marked by bold blue lines on the chart.
Another interesting aspect on the daily chart is the positive divergence in RSI seen in the past few days, when stock price hit a lower low but RSI hit a higher low. Last time it did it near the bottom when it tested 200 dema, it rallied from 100 to 157. Can it repeat the feat? Lets see.
Triangular formations are very tricky and keep everyone guessing, but if and when a breakout from triangle happens, it does so with a lot of force.
disc: invested as disclosed before.
22 Likes
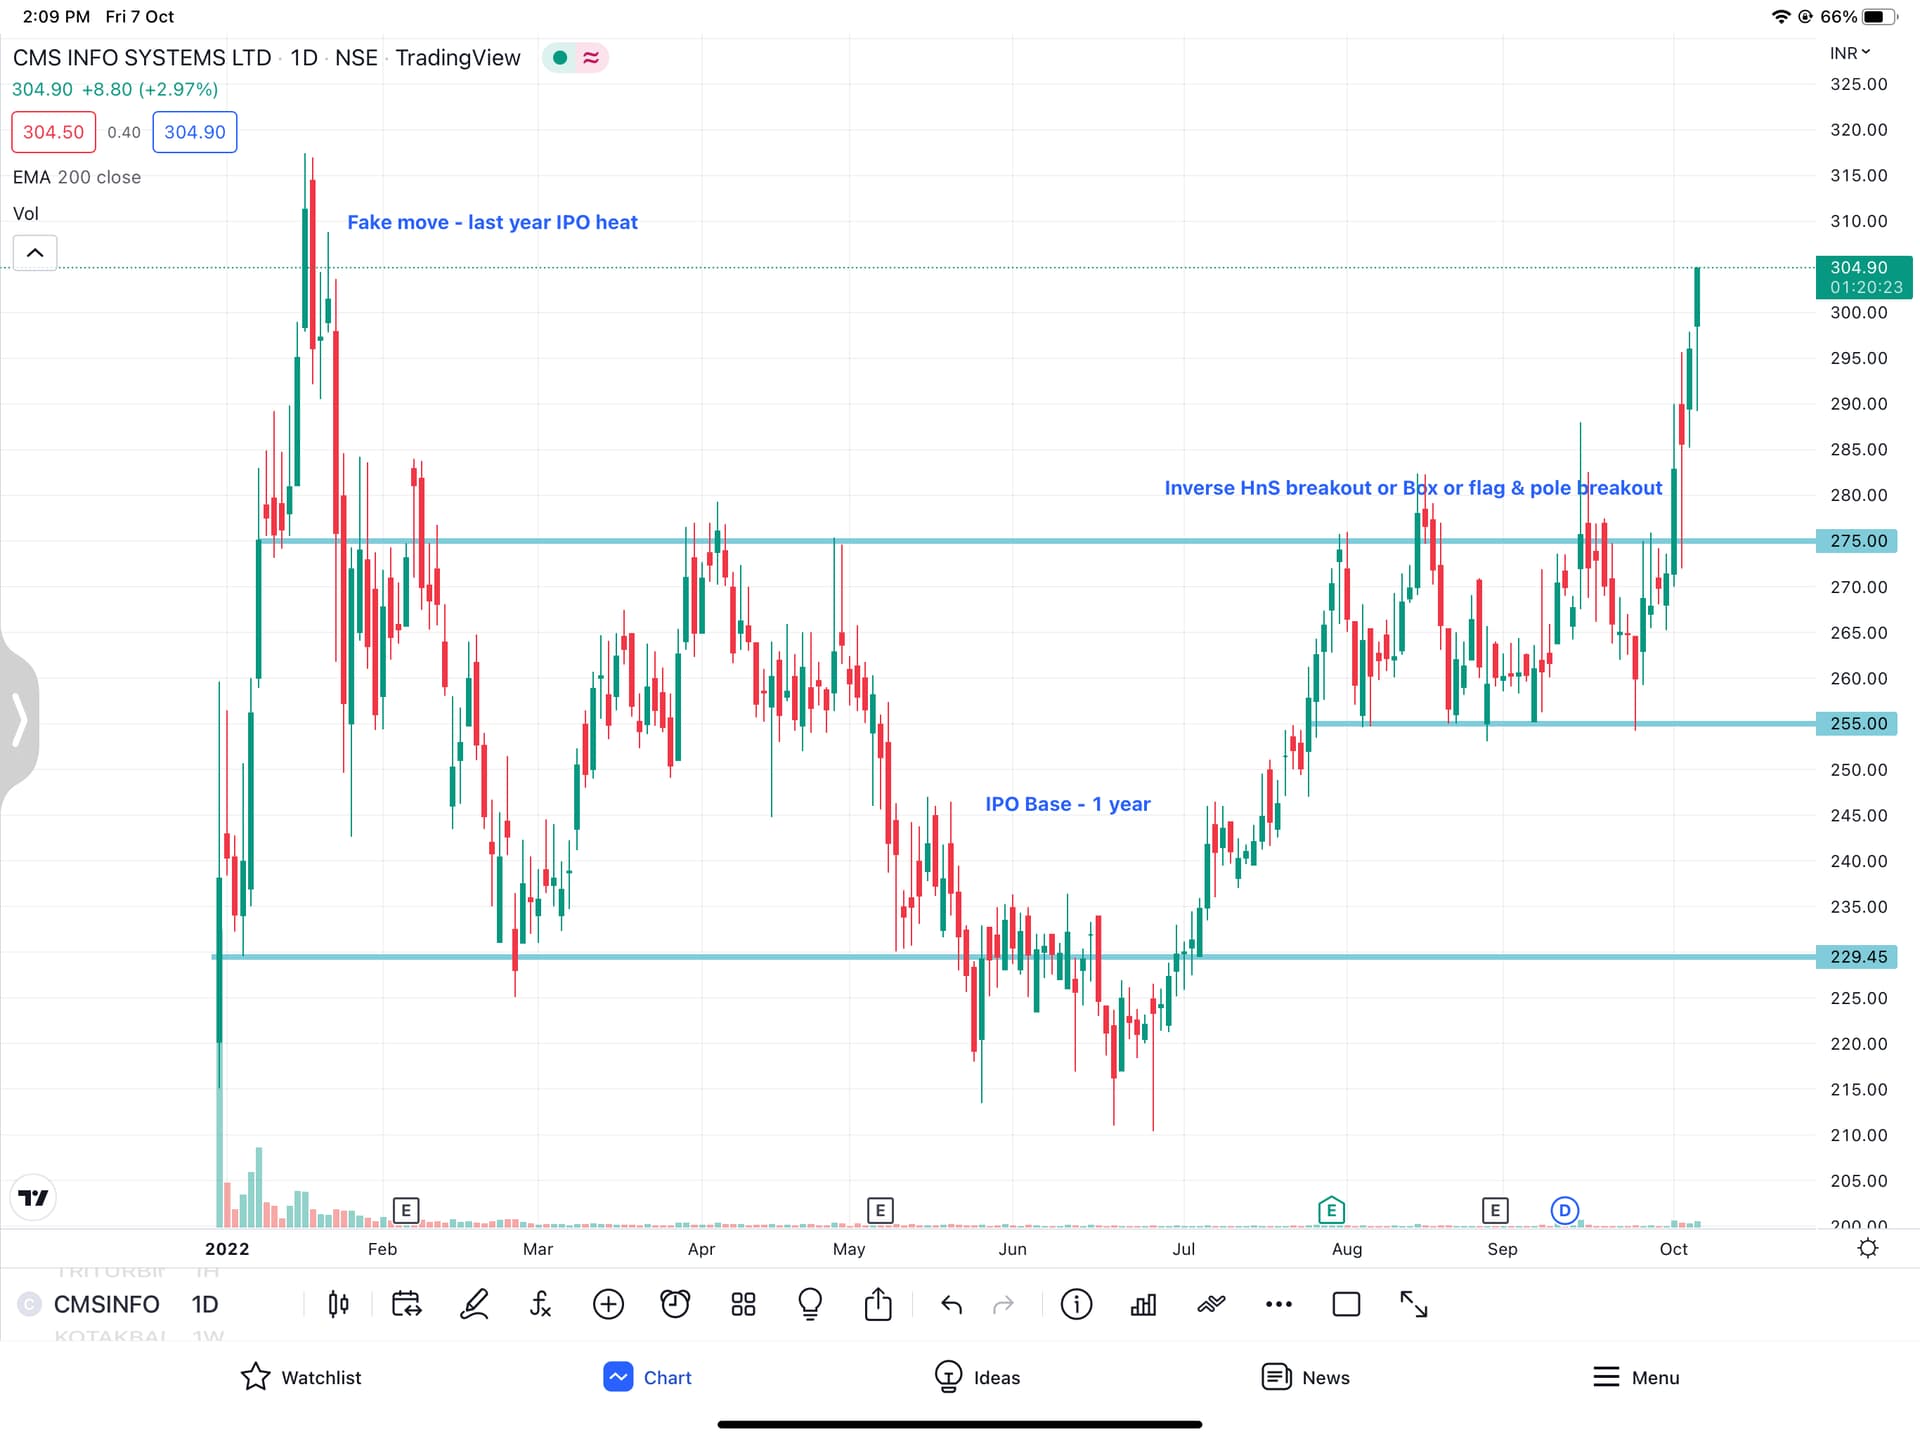
CMS Info systems:
I have recently entered the stock based on technical formations as explained in the chart. Apart from this fundamentally a decent bet.
Expectations technically:
- IPO base breakout (typically after the IPO base breakout the moves are swift)
- Charts point to 325/335 as first target based on charts and if this is sustained first, it’s blue sky scenario.
- Visual patterns, price action, volumes are priority in my technical bets + decent fundamentals.
Box breakout are reliable as stock consolidates for fundamentals to catch up & when there is sufficient evidence of this, stock moves out of the box for next technical formation.
Fundamentally,
The management is talking about 18% CAGR growth which may be ambitious given the sector the company is in however, there are tailwinds like
- Banking sector growth
- Formal economy, Retail penetration
- Banks outsourcing cash management to third party vendors.
Valuations are quite low at FY24E PE of 14 (probably because of low growth expectations of market). However, Low debt, 20% ROE, Leadership position, managed services & new businesses growth, 25% dividend distribution as alluded by management may be the factors for re-rating.
2 Likes
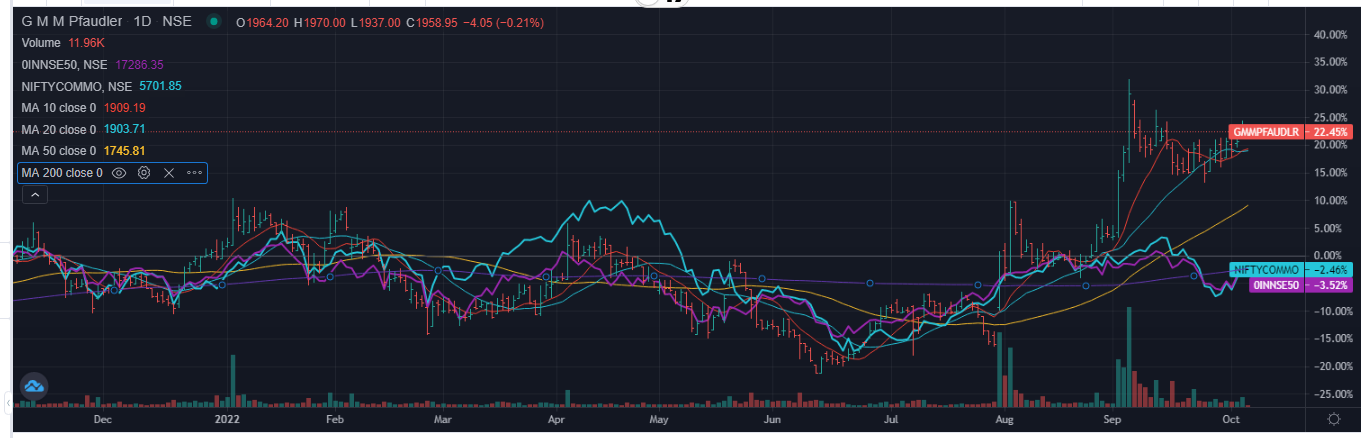
Most of the companies are increasing CAPEX an acting on capex plans and in that scenario one can not underestimate the power of GMM in pharma space . it is proxy to play capex cycle cateringto versatile group of industries .Now Gujrat Machine Manufacturing (GMM prafudler ) is making a technical breakdown after consolidation of two long years and no over hear supply barriers in place will be a strong trigger for the up beat of the price … and it is also coupled with the completion of acquisition of parent company by patels will increase the market reach and production efficiencies and scale of operations
“ICRA notes that there would be some increase in the company’s debt levels at the consolidated level than our earlier expectations, which would moderate the debt coverage metrics. However, the increased scale of operations as well as expansion in profitability from the business shall support its credit profile”
Trading all above key SMA 10,20,50,200
Disc : invested so i might be biased this is not an investment advice i am not SEBI approved broker or advisor, shared for education purpose
4 Likes

Here is the recent interview of Mark Minervini with Vivek Bajaj
13 Likes
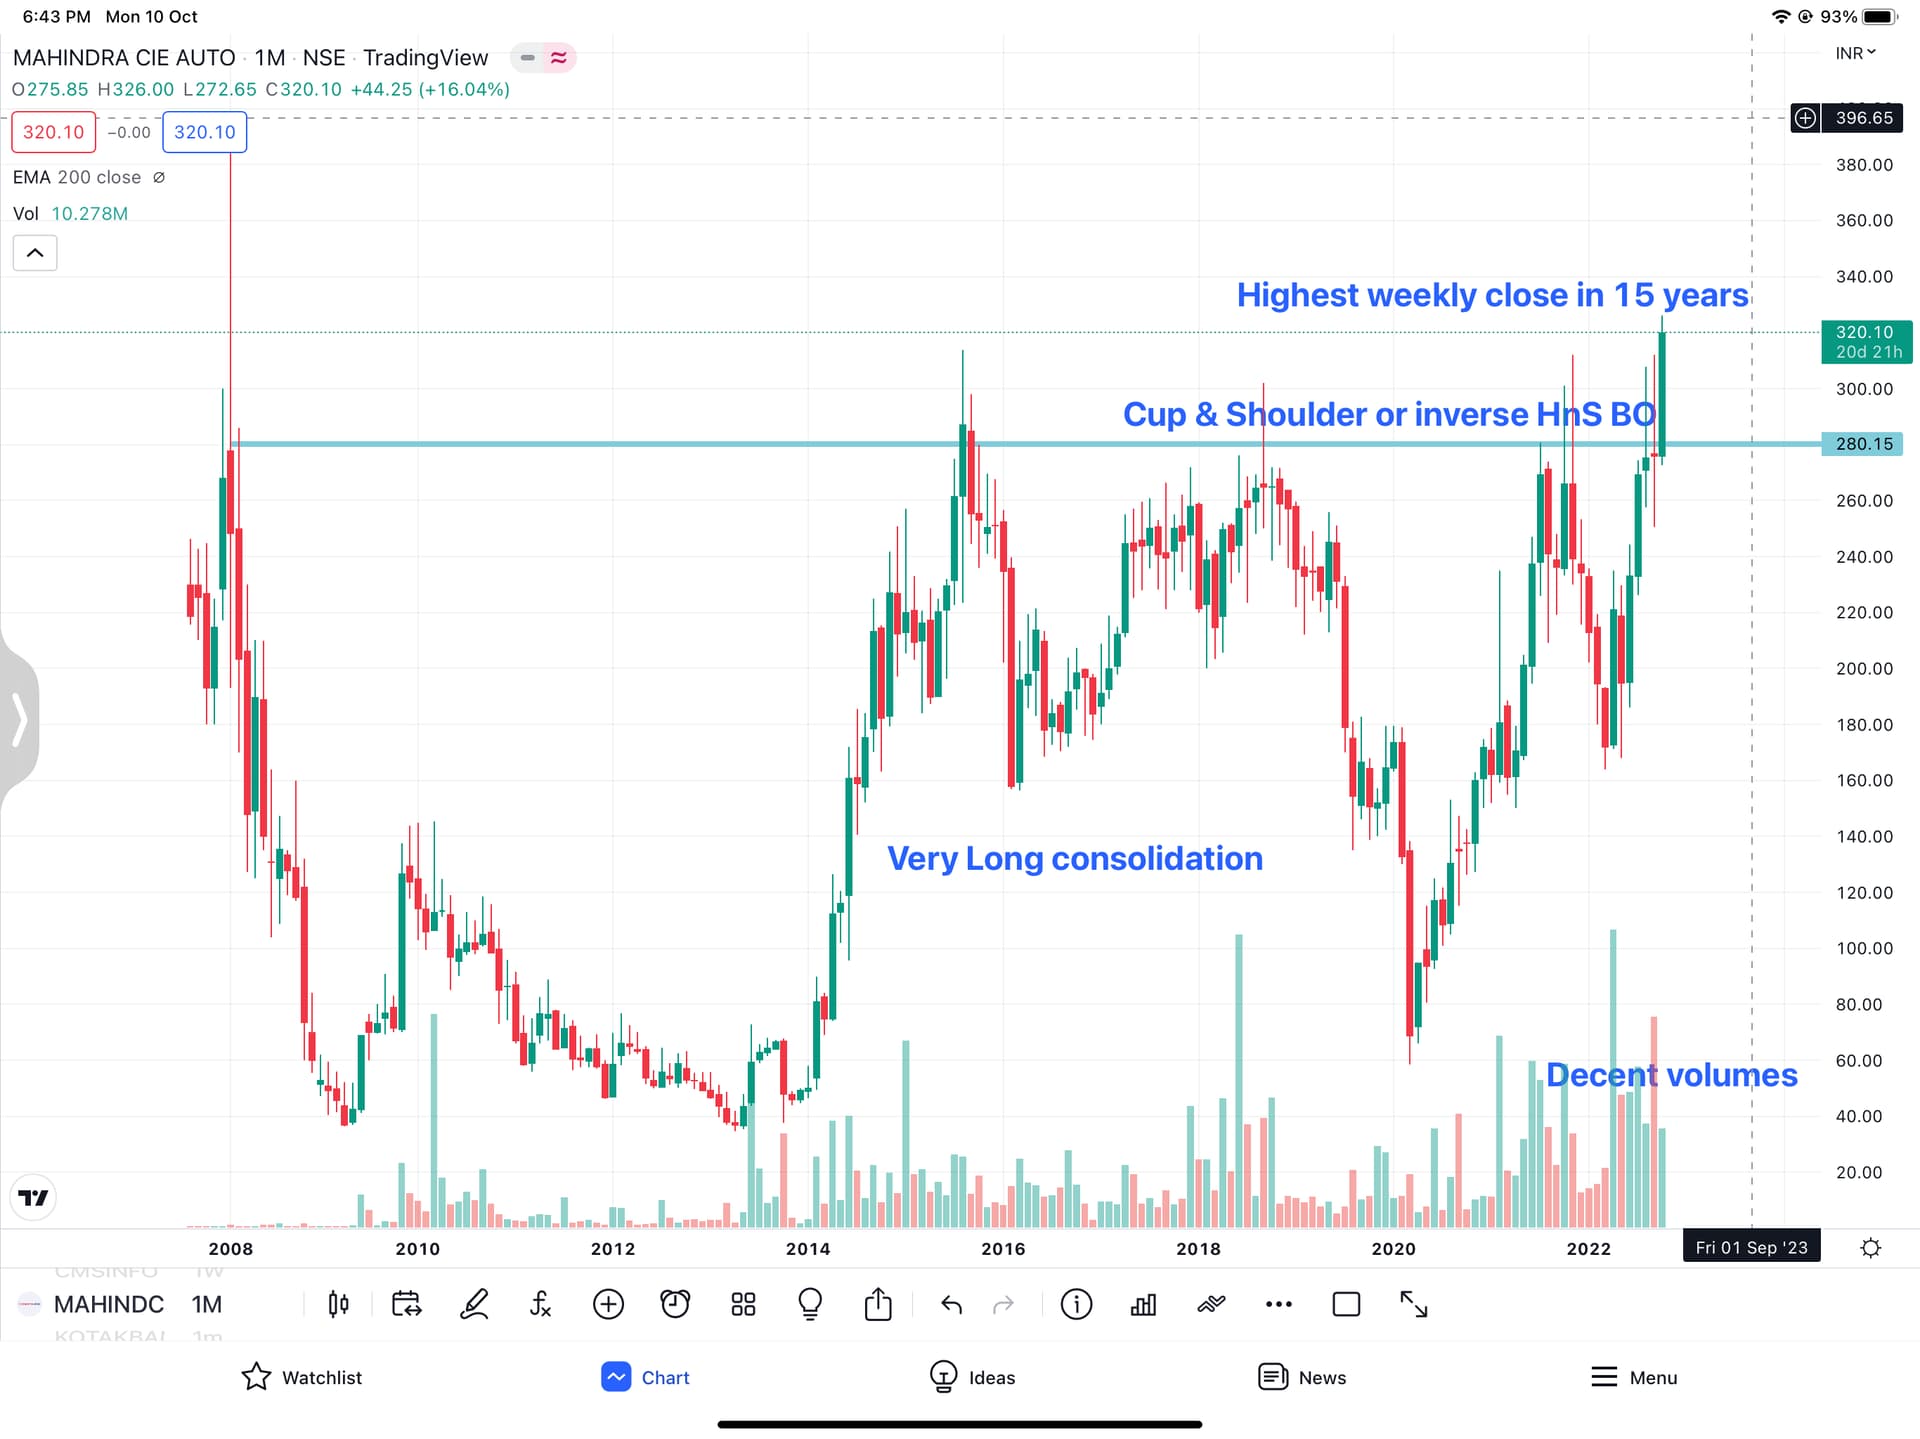
Mahindra CIE:
As written in the chart, set up is ready technically, some fundamental event confirmation either company specific or sector specific should happen. Results on 18th Oct, 2022.
- Auto sector is breaking out after a long consolidation (along with Pharma index).
- Stock is at 14 times FY24E earnings with 15% RoE, <0.2 D/E, 15% earnings growth conservatively, 1.5% dividend yield. Sector leaders like Tube investment, Bharat forge, Endurance trade at least 50%-200% higher PE ratios (20-45 times) with similar characteristics.
- CIE group (promoter) is Spanish and has decent track record of turning around acquisitions and is risk averse & with specific objective goals.
- Benefits from Mahindra’s product success.
Investors waited a very long time for things to fall in place after CIE’s acquisition. Let’s see if they fruitily now or not.
From company’s website & I liked the last paragraph:

Technically,
Once broken out from such a long consolidation, the stocks generally move for much higher targets. There is also something seriously changing fundamentally for multiple year breakout to happen. 450-500 is a first target & then based on further technical formations, next target. Fundamentally, if we give 25 times forward earnings in a year from now, 750-800 can be achieved.
I hold this as part of technical portfolio along with Triveni Turbine & CMS Info.
Nice read on the background. Mr. Luthra is now retired.
15 Likes
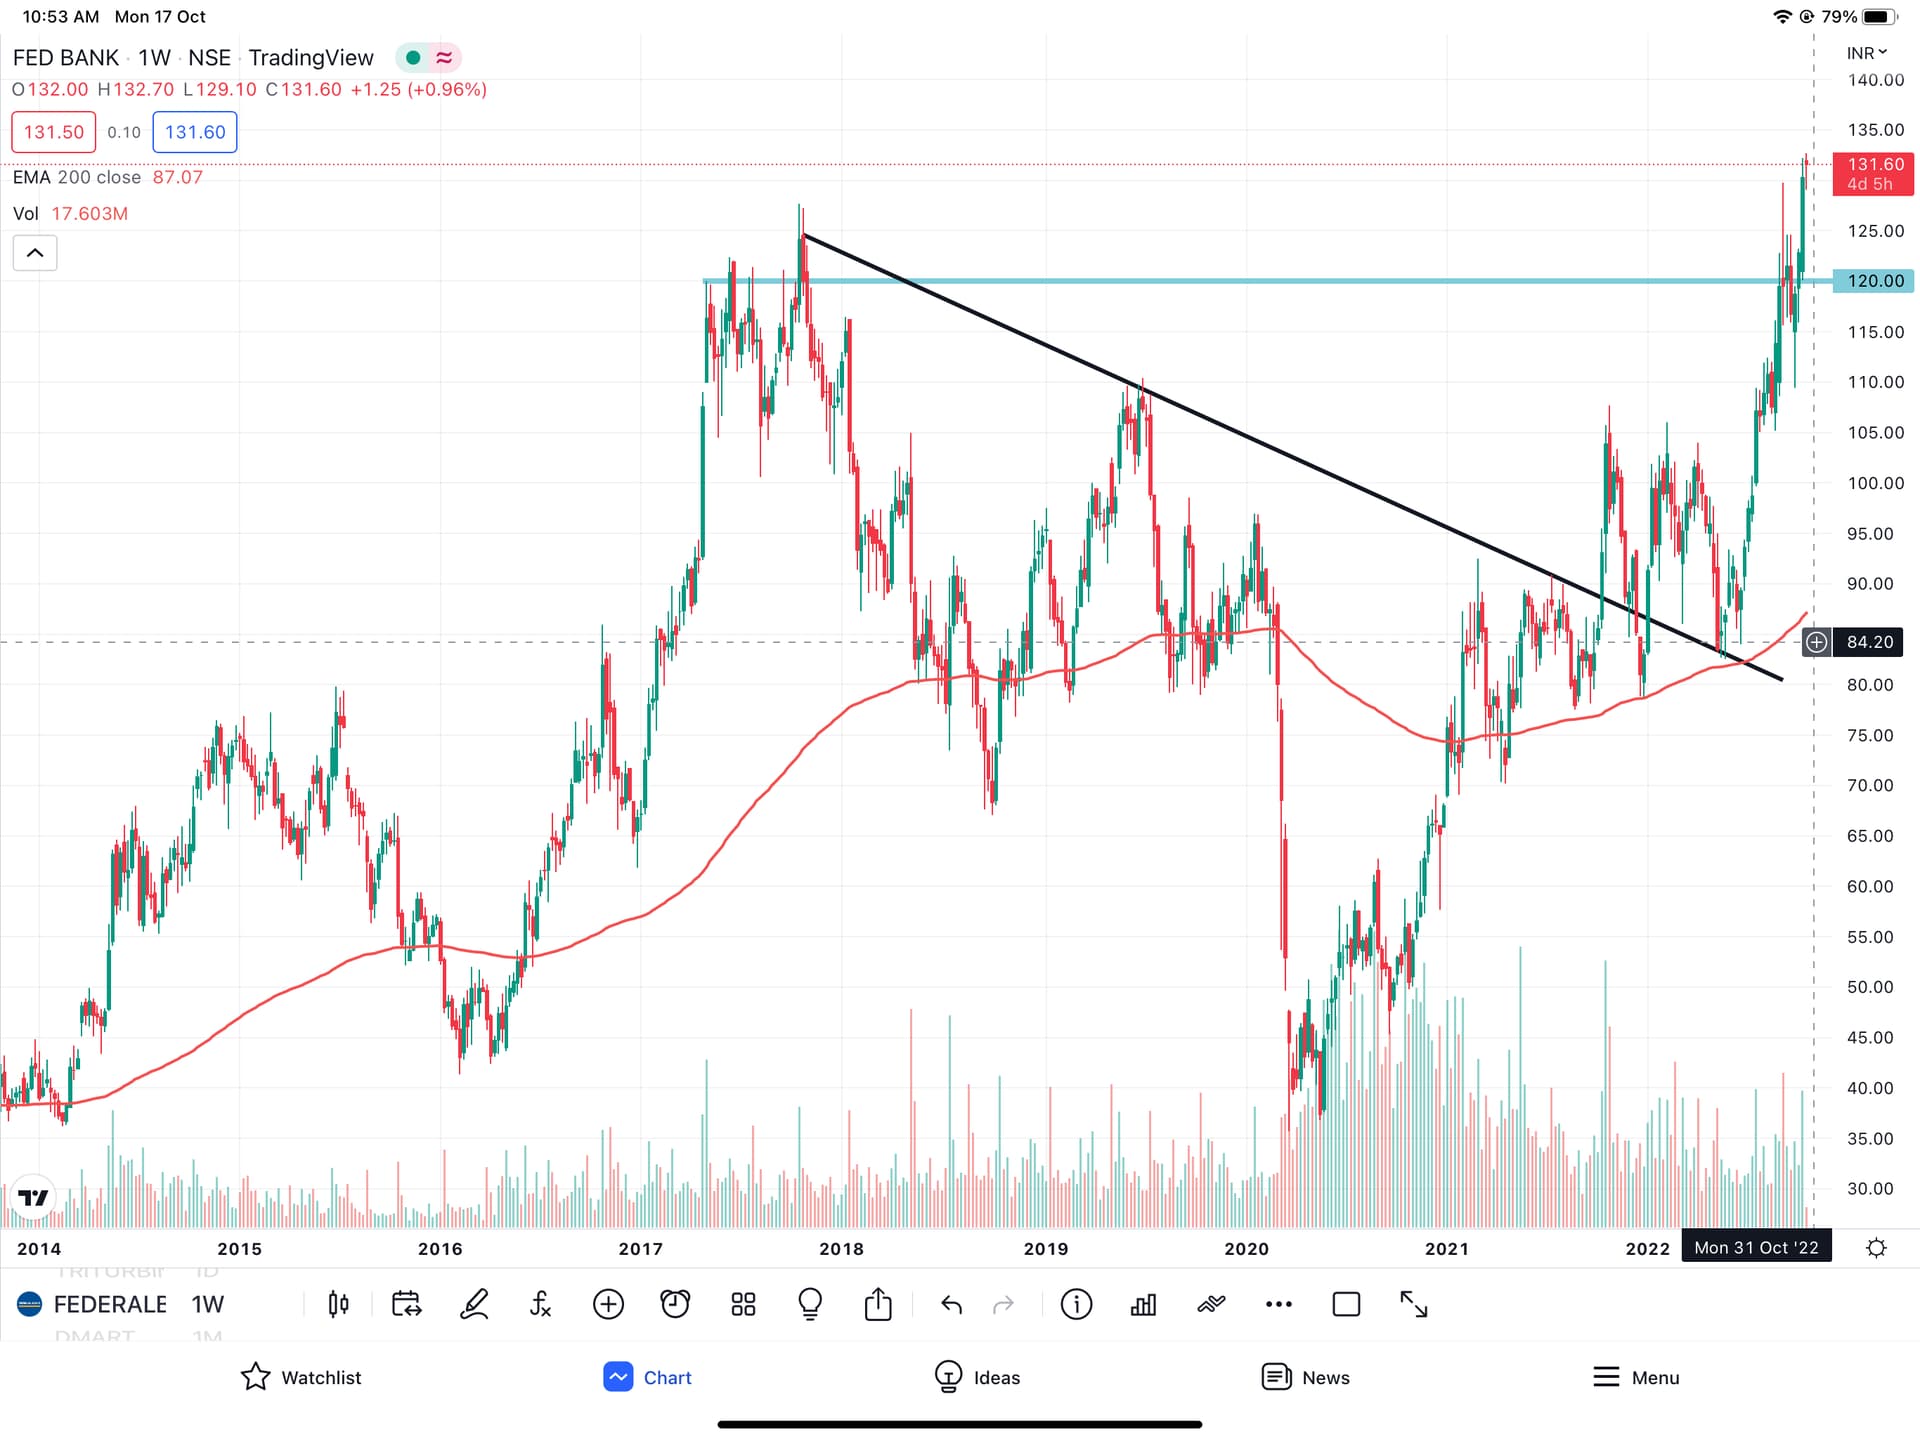
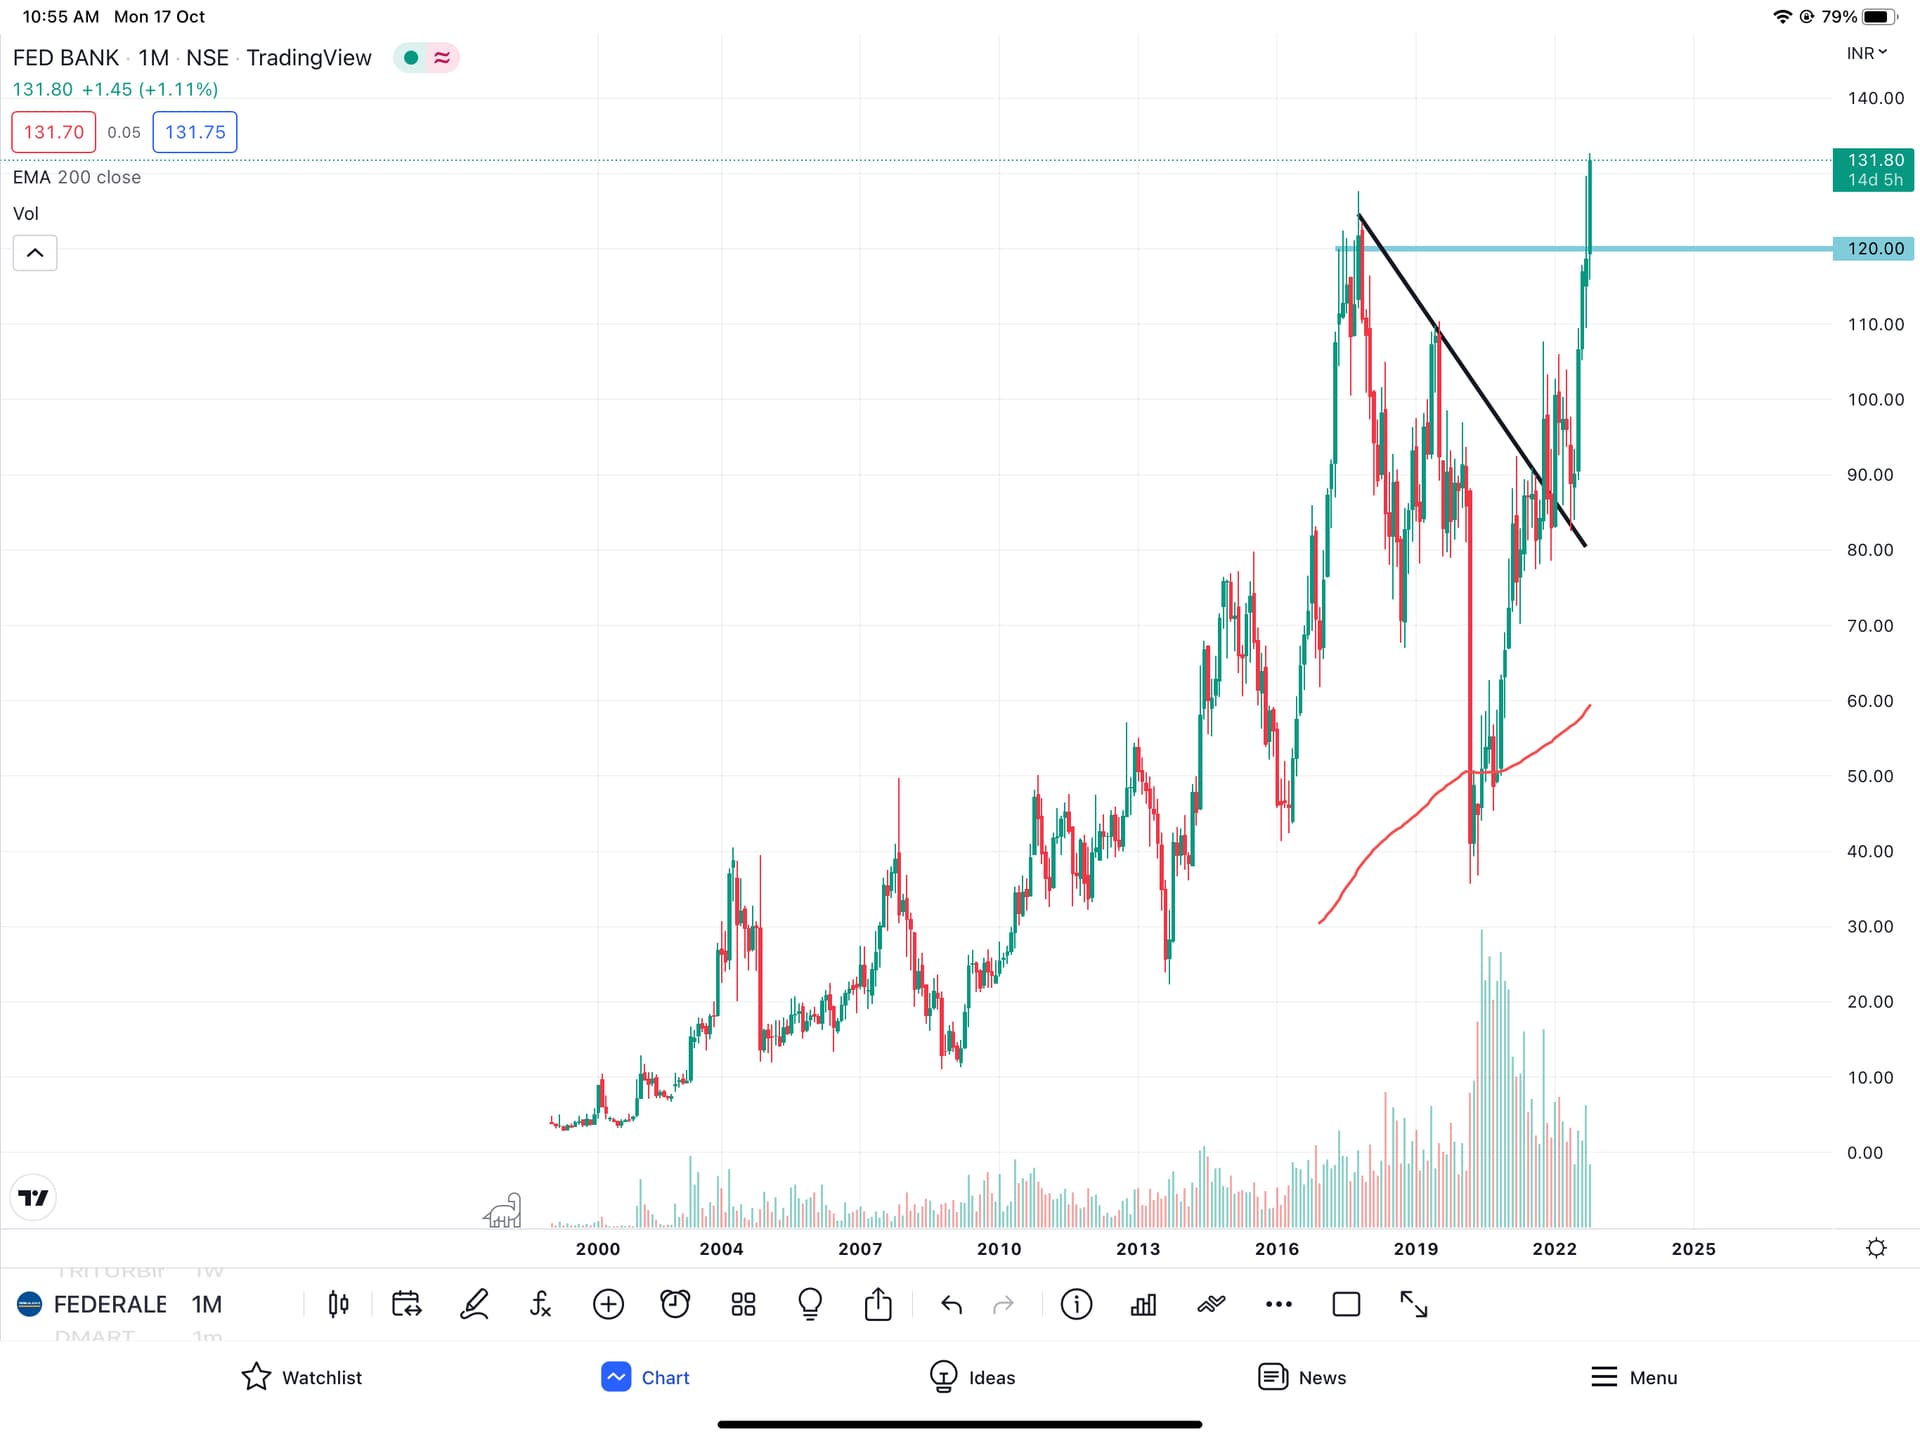
Federal Bank:
This is again a ATH break out, Fundamentals improving, sector tailwinds entry. I have entered the stock around 129 with a stop loss of 115 & a target of 180 ish to begin with.
Once the target is reached, idea is to exit or continue to hold if Fundamentals improve as banking sector could be on upswing post COVID for 3-5 years. Price will of course discount this in 2-3 years.
Fundamentals:
FY23E closing estimates:
ROE: 14%
ROA: 1.2
PCR: 70%
Credit Costs: 60 bps
NNPA: 0.8%.
NIM: 3.3%
CASA: 38%
Loan growth: 20%.
For the above quantitative metrics, forward P/BV of 1.2 is inexpensive.
At technical targets of ~ 180, the P/BV comes to around 1.5 which is fair for the bank. So, as these factors coincided made me bullish for a decent allocation.
Management earnings call indicates that the above metrics are a base and can improve in the coming years. I think too many macro events have come in the way for Federal bank thus far for the market to remain sceptical on the bank.
For some of the technical entries, I have trimmed exposures to Dmart, Kotak, Page, PB Fintech (Stop loss hit).
6 Likes
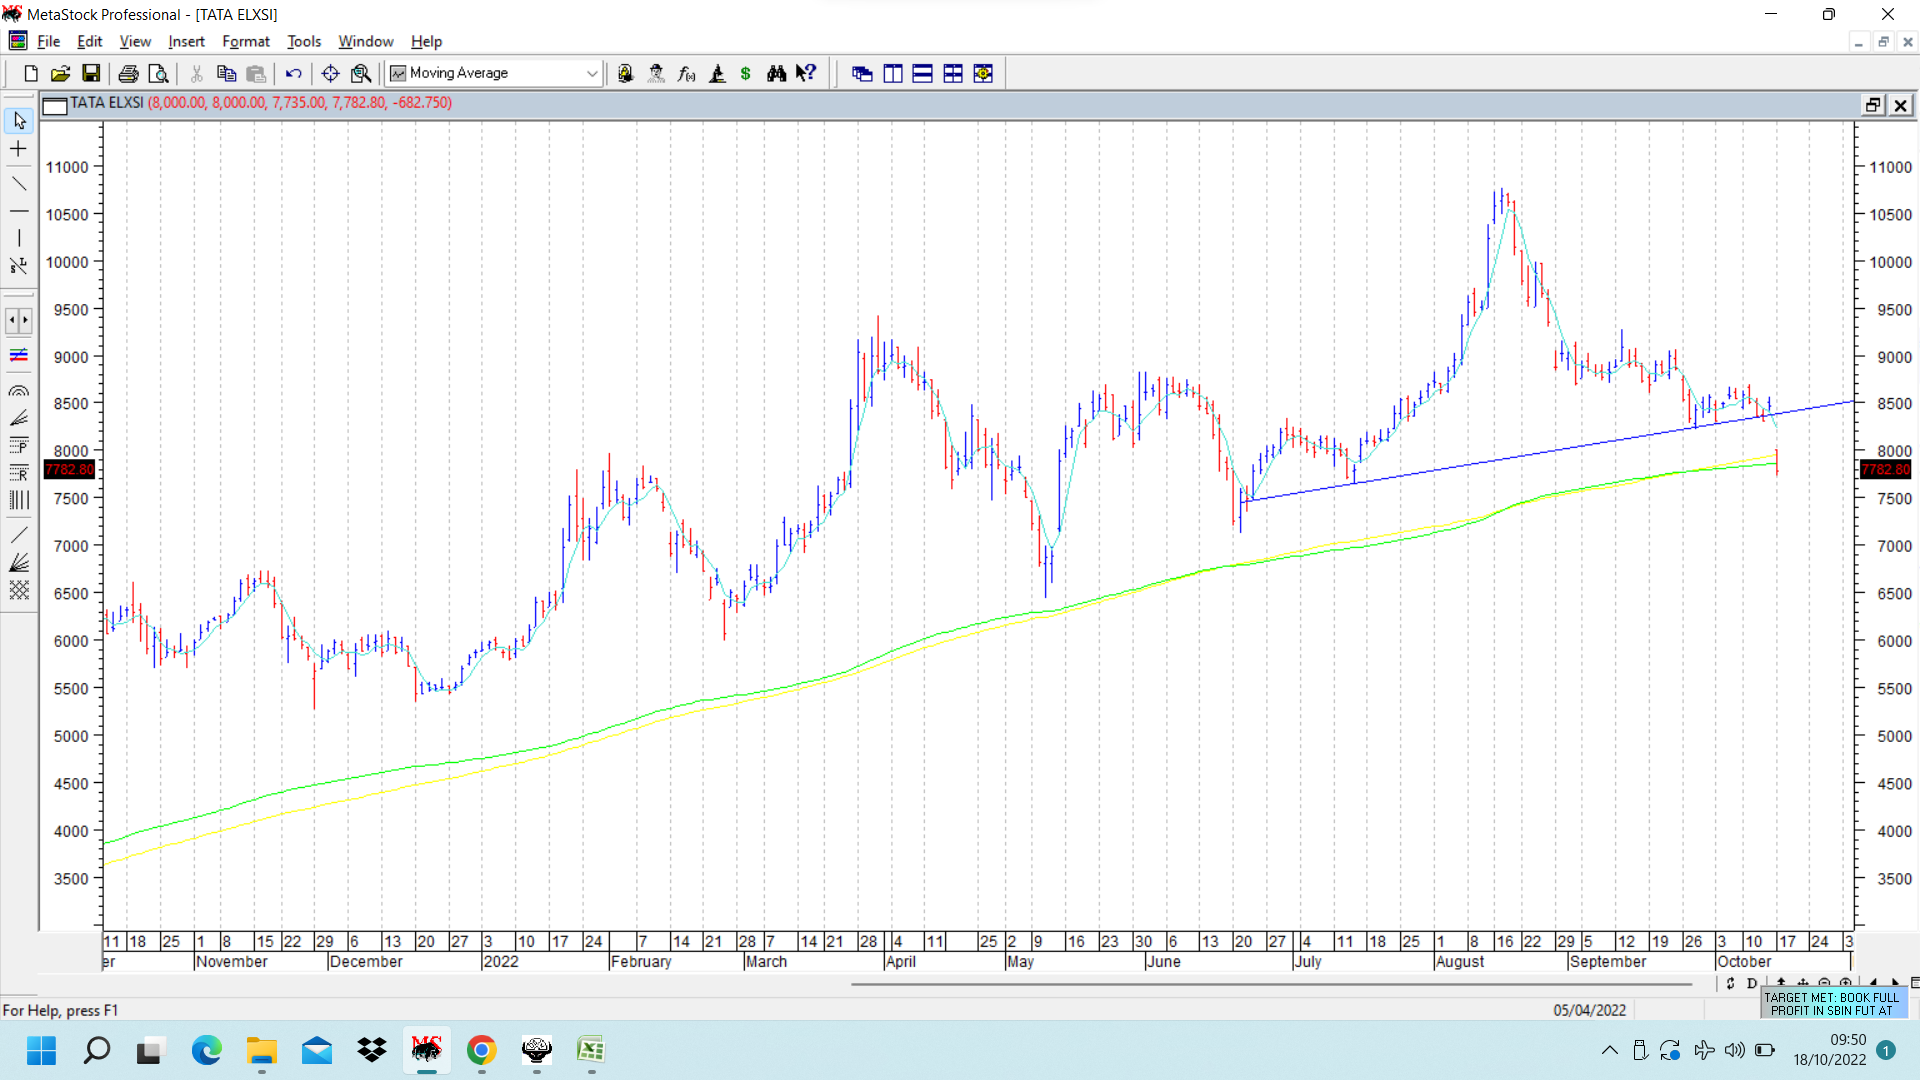
Tata Elxsi has been a market darling with a strong rally from 480, the Covid lows to high of 10700 few weeks back. Post the top of above 10000, it has been showing weakness and yesterday broke below a head and shoulders bearish pattern with a gap down. Its poised to break below its sacrosanct 200 dema too. disc: no positions, but was under watchlist for any topping pattern post the spectacular run up. On fundamental side, valuations seemed too stretched.
19 Likes
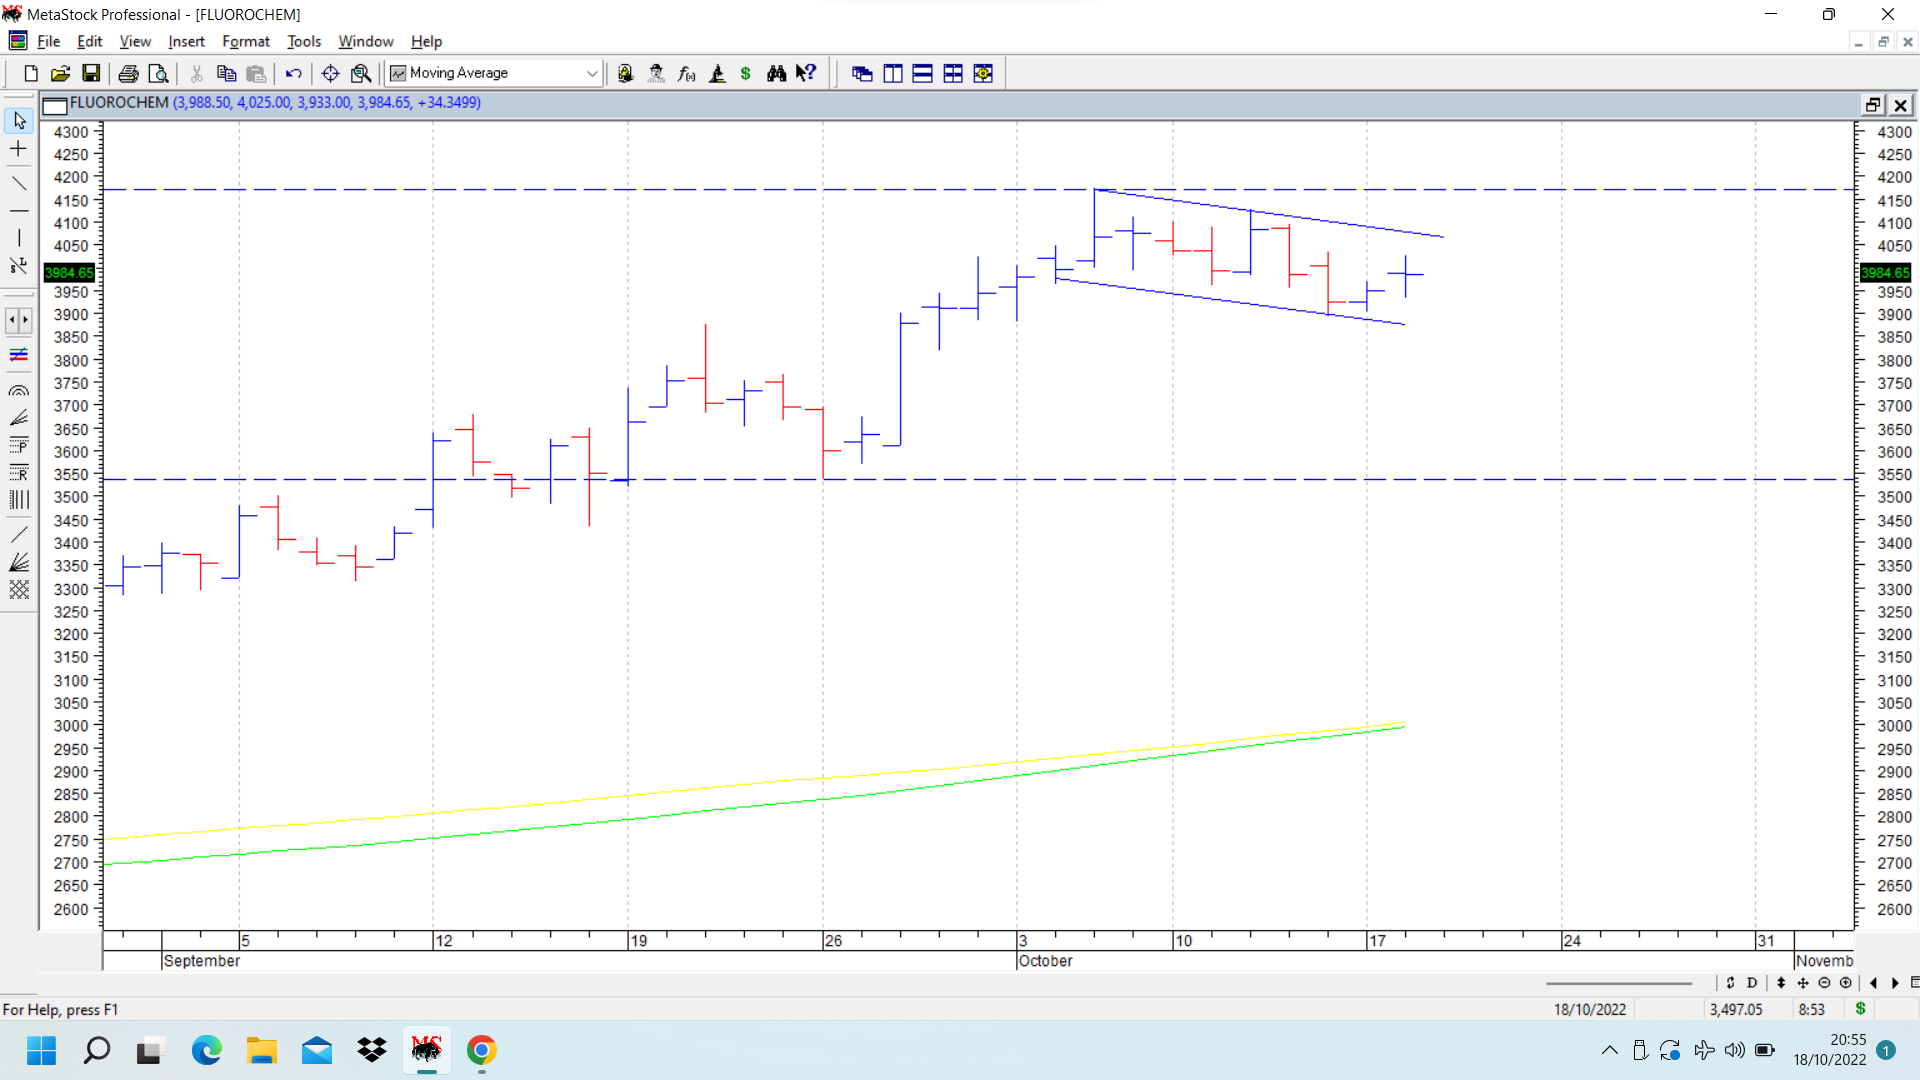
Guj Fluoro daily chart shows a flag like consolidation. Flagpole extends from 3550 to 4150, a range of 600 rs. Breakout above 4050-4100. If breakout happens and pattern plays out then target can be around 4650-4700. (Pattern fails on breach of 3800-3850) disc: invested.
15 Likes
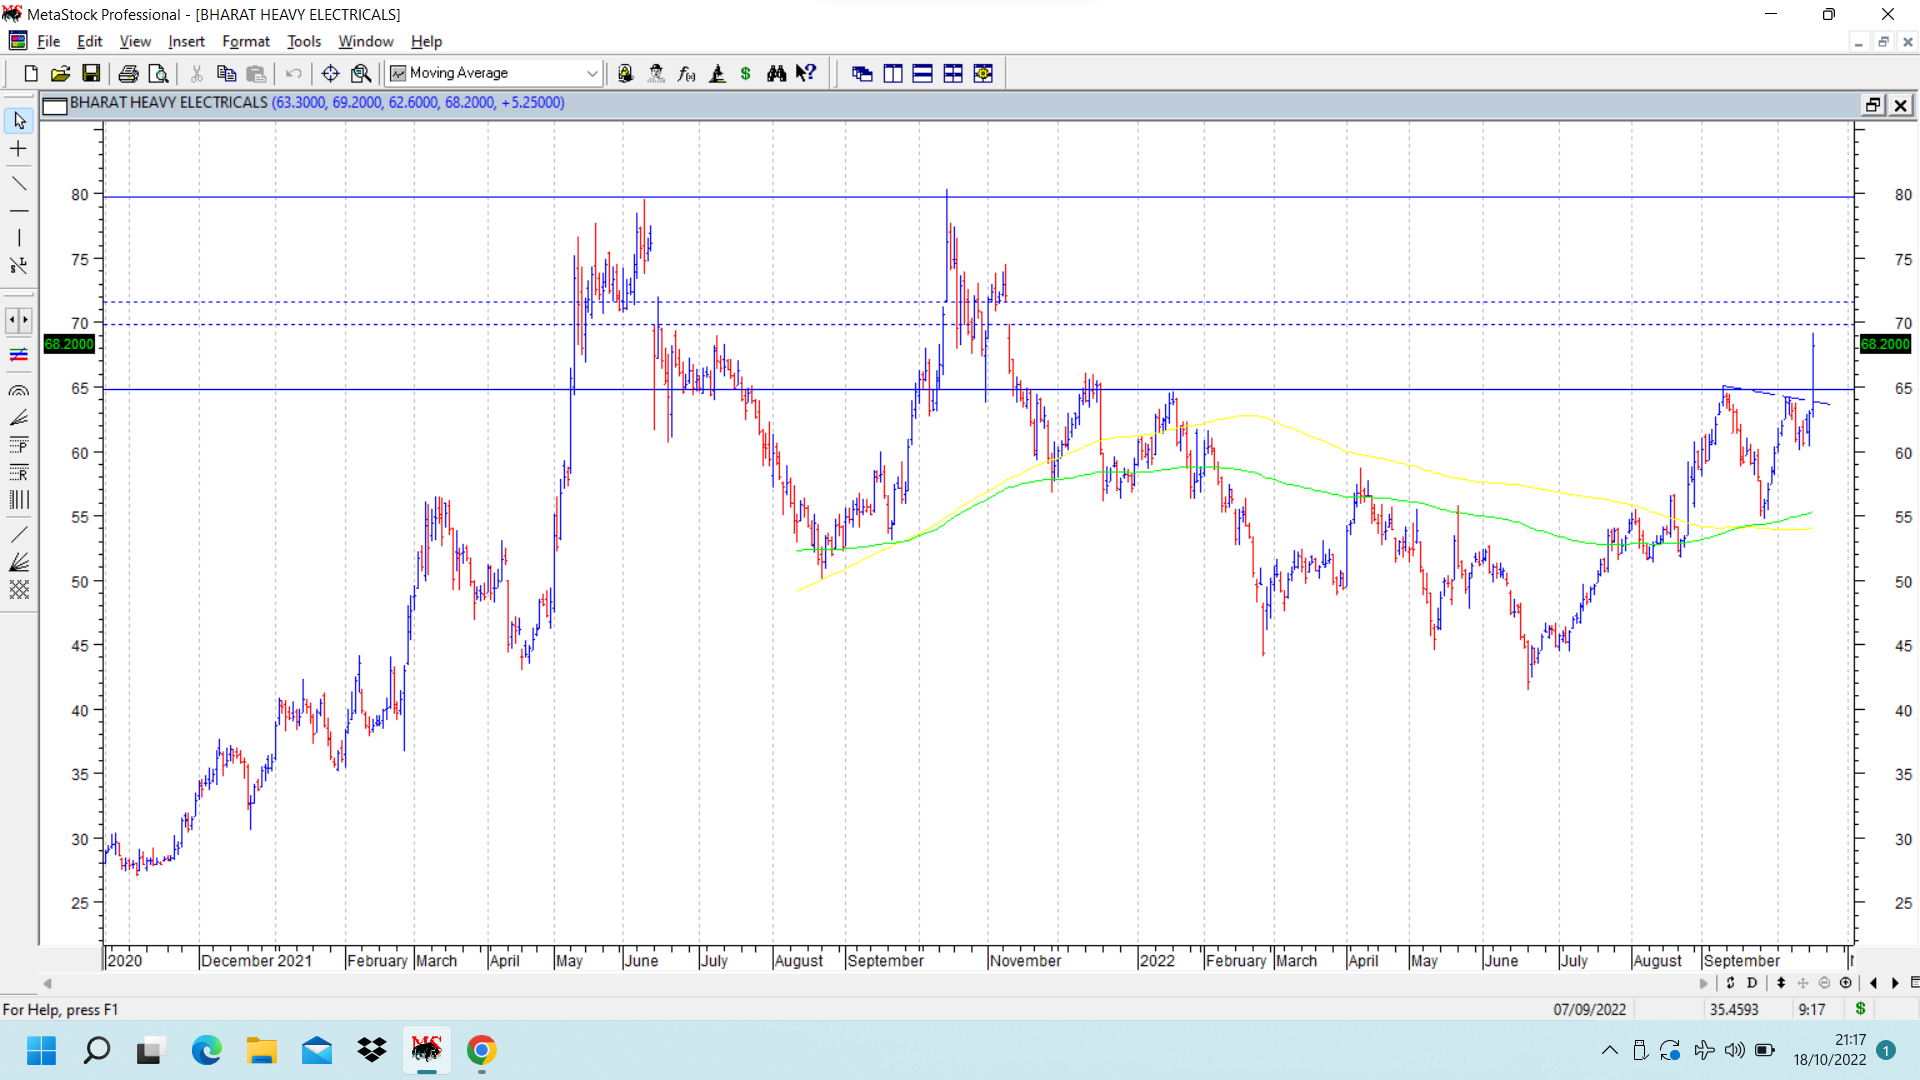
BHEL chart covered earlier. Main theme was that a failed bearish pattern can provide a potentially good upside trade. Today stock price broke above (with huge volumes) a strong resistance of 65, which also is a neckline region for an inverted head and shoulders bullish pattern. If this pattern plays out, target can be 85 plus. Near term the falling gap marked in dotted parallel horizontal lines between 71.60 to 69.85 should be watched for resistance. Above that 85 is a potential resistance. Also note a small cup and handle pattern marked on right side of chart which also happened to be the right shoulder of the aforesaid inverted head and shoulders pattern. disc: invested.
14 Likes
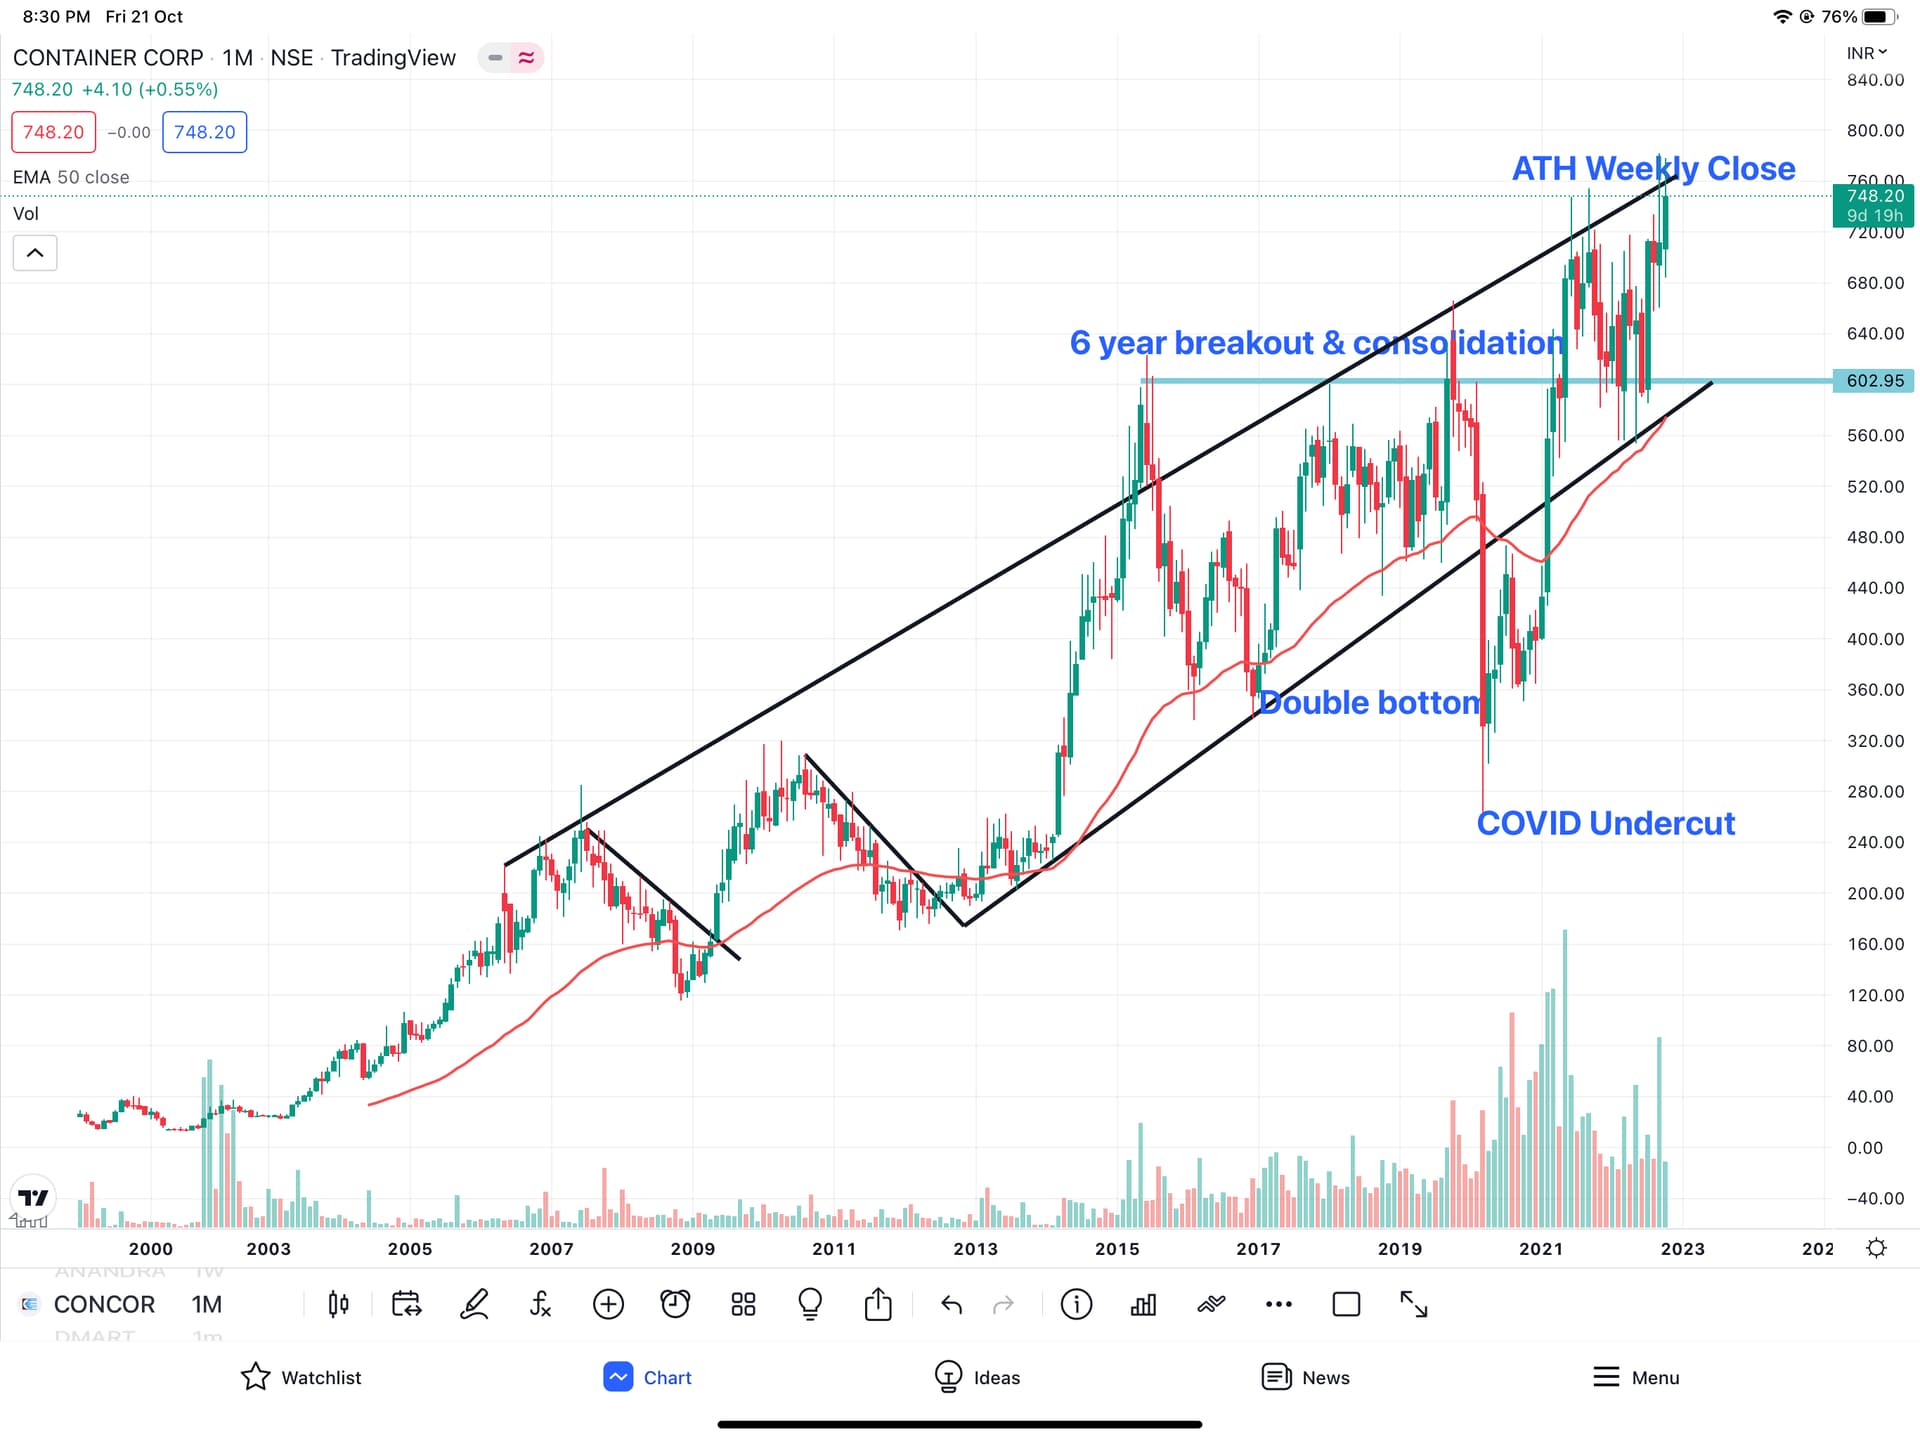
Container Corporation: (CONCOR)
Disclosure: Holding.
Belongs to Logistics sector (Railways):
Fundamentally, poised for 15% growth, 2% dividend yield, no debt, RoE of 15%, large sector.
Logistics sector growth is directly linked to GDP growth, more than any other sector.
Government is the majority owner (it can be either boon or bane) however, IF the privatisation goes through, there’s is a scope for valuation re-rating depending on the new owner. There are speculative articles going around, let me not go into it.
Implementation of dedicated freight corridor & governments policy tailwind towards logistics sector is a positive.
Technical chart: (the chart is a bit busy):
Key points:
- Respected 50 EMA except during COVID pullback.
- Currently at the top end of channel (my observation is, if price breaks out of channel, then it is generally due to valuation re-rating or change in growth acceleration (from say, 10% secular to 15% secular).
- Consolidated for 6 years & broke out with volumes in 2021 and since has been consolidating - very positive price action.
2 Likes
Arvind Fashion - Weekly chart attached 345-350 key resistance levels and close above that opens TGT of 435 and 455. RMG companies with domestic sales are expected to do better with festive demand and all companies from sector may get benefited because of this.
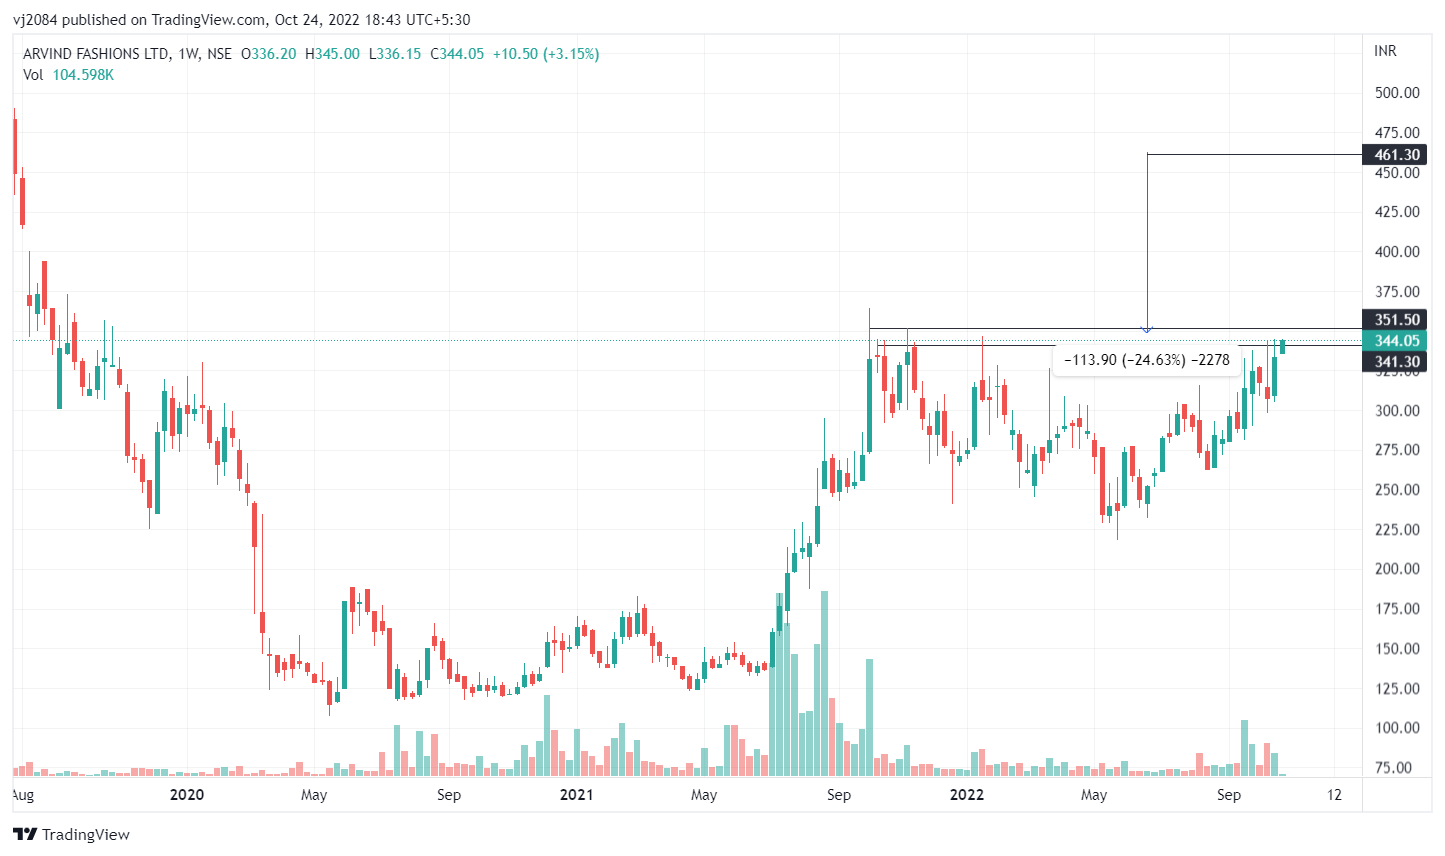
6 Likes
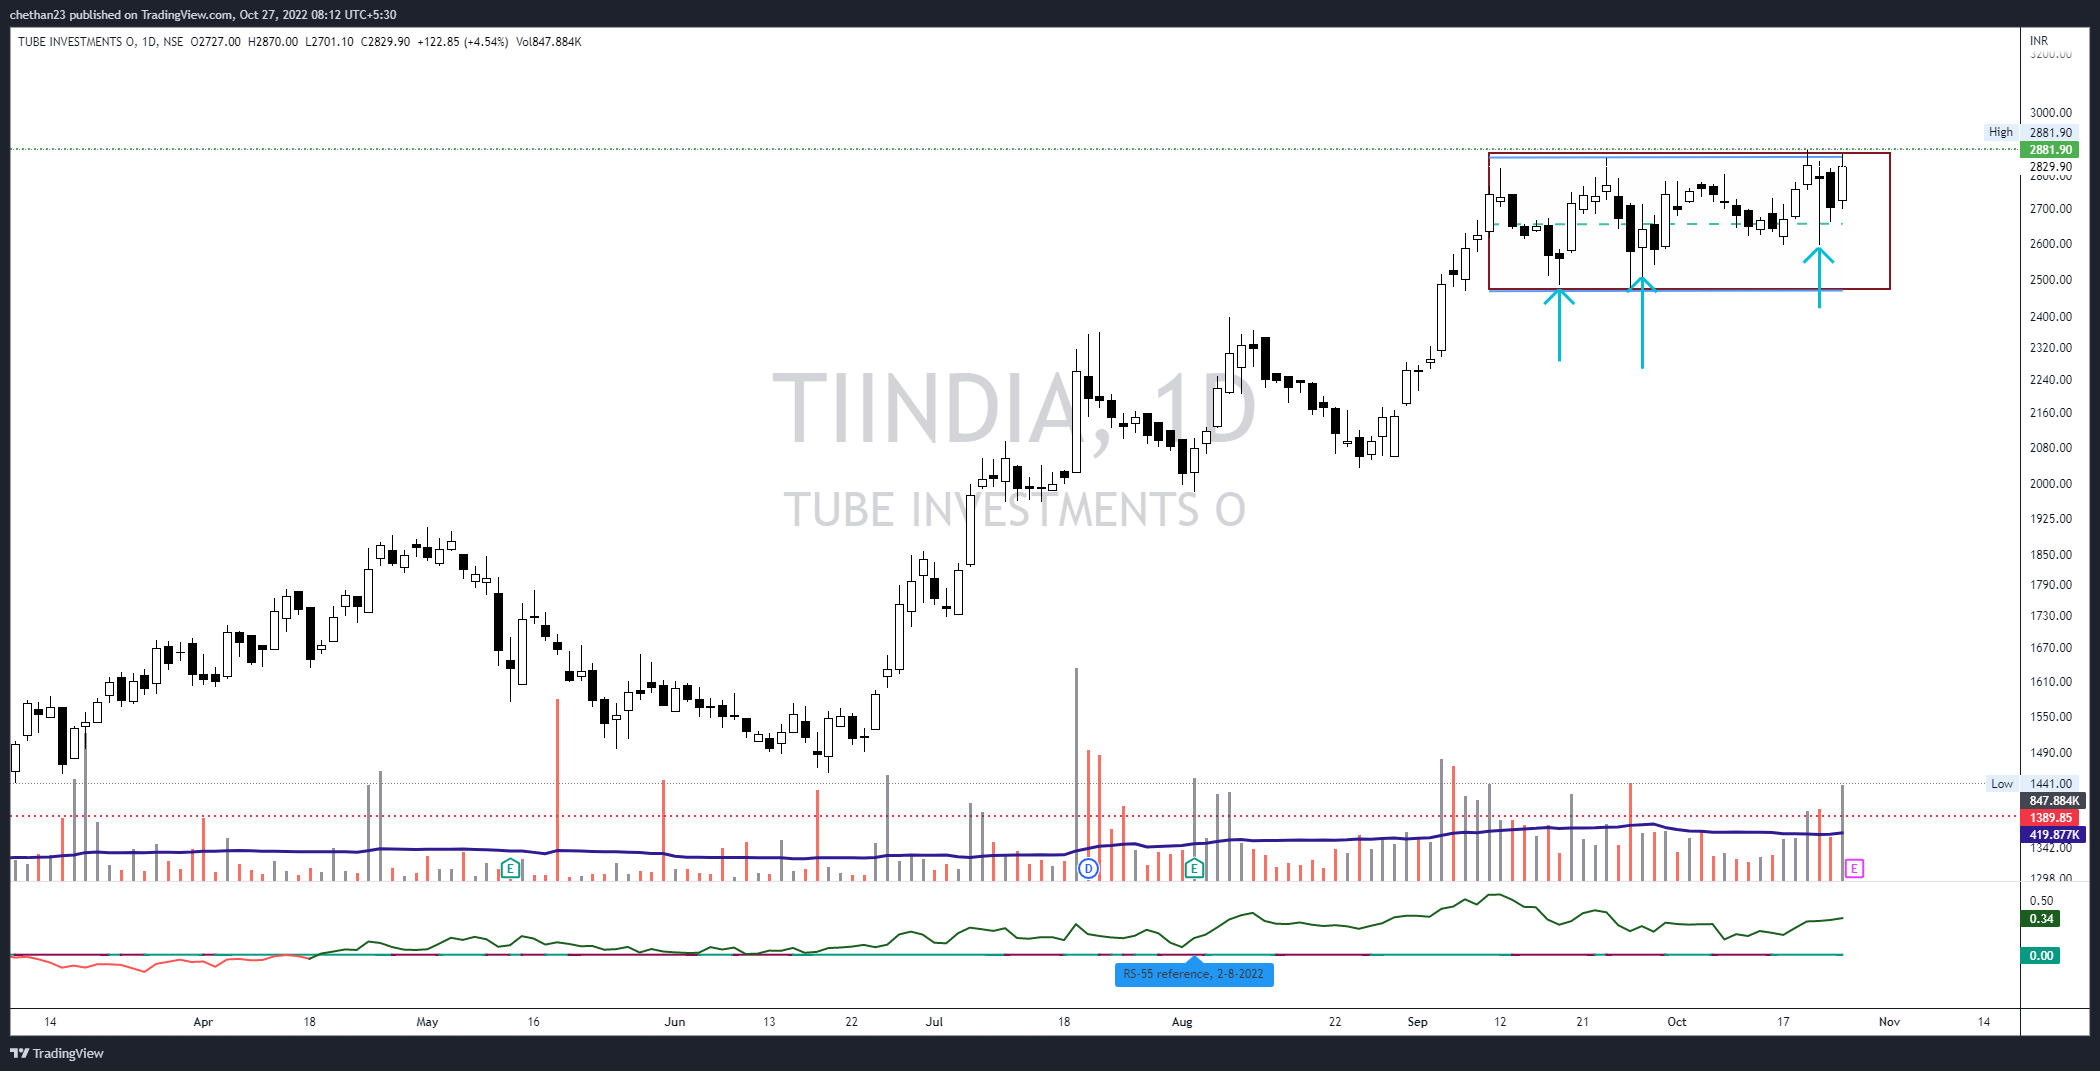
Tube Investment, good horizontal consolidation for over a month now, also we can see many long tail candles (marked with arrow) suggesting buying interest, buy volumes seems to be high
4 Likes
I think KPIT is showing rounding bottom pattern and is near it’s 52week high.
1 Like
Axis Bank has also broken out of it’s multiyear high of 820-830. Yes the volumes are missing but if it sustains the current levels, we can see some nice gains in the short term. Even the RSI is above 60 showing good momentum and 20EMA is above 50EMA.
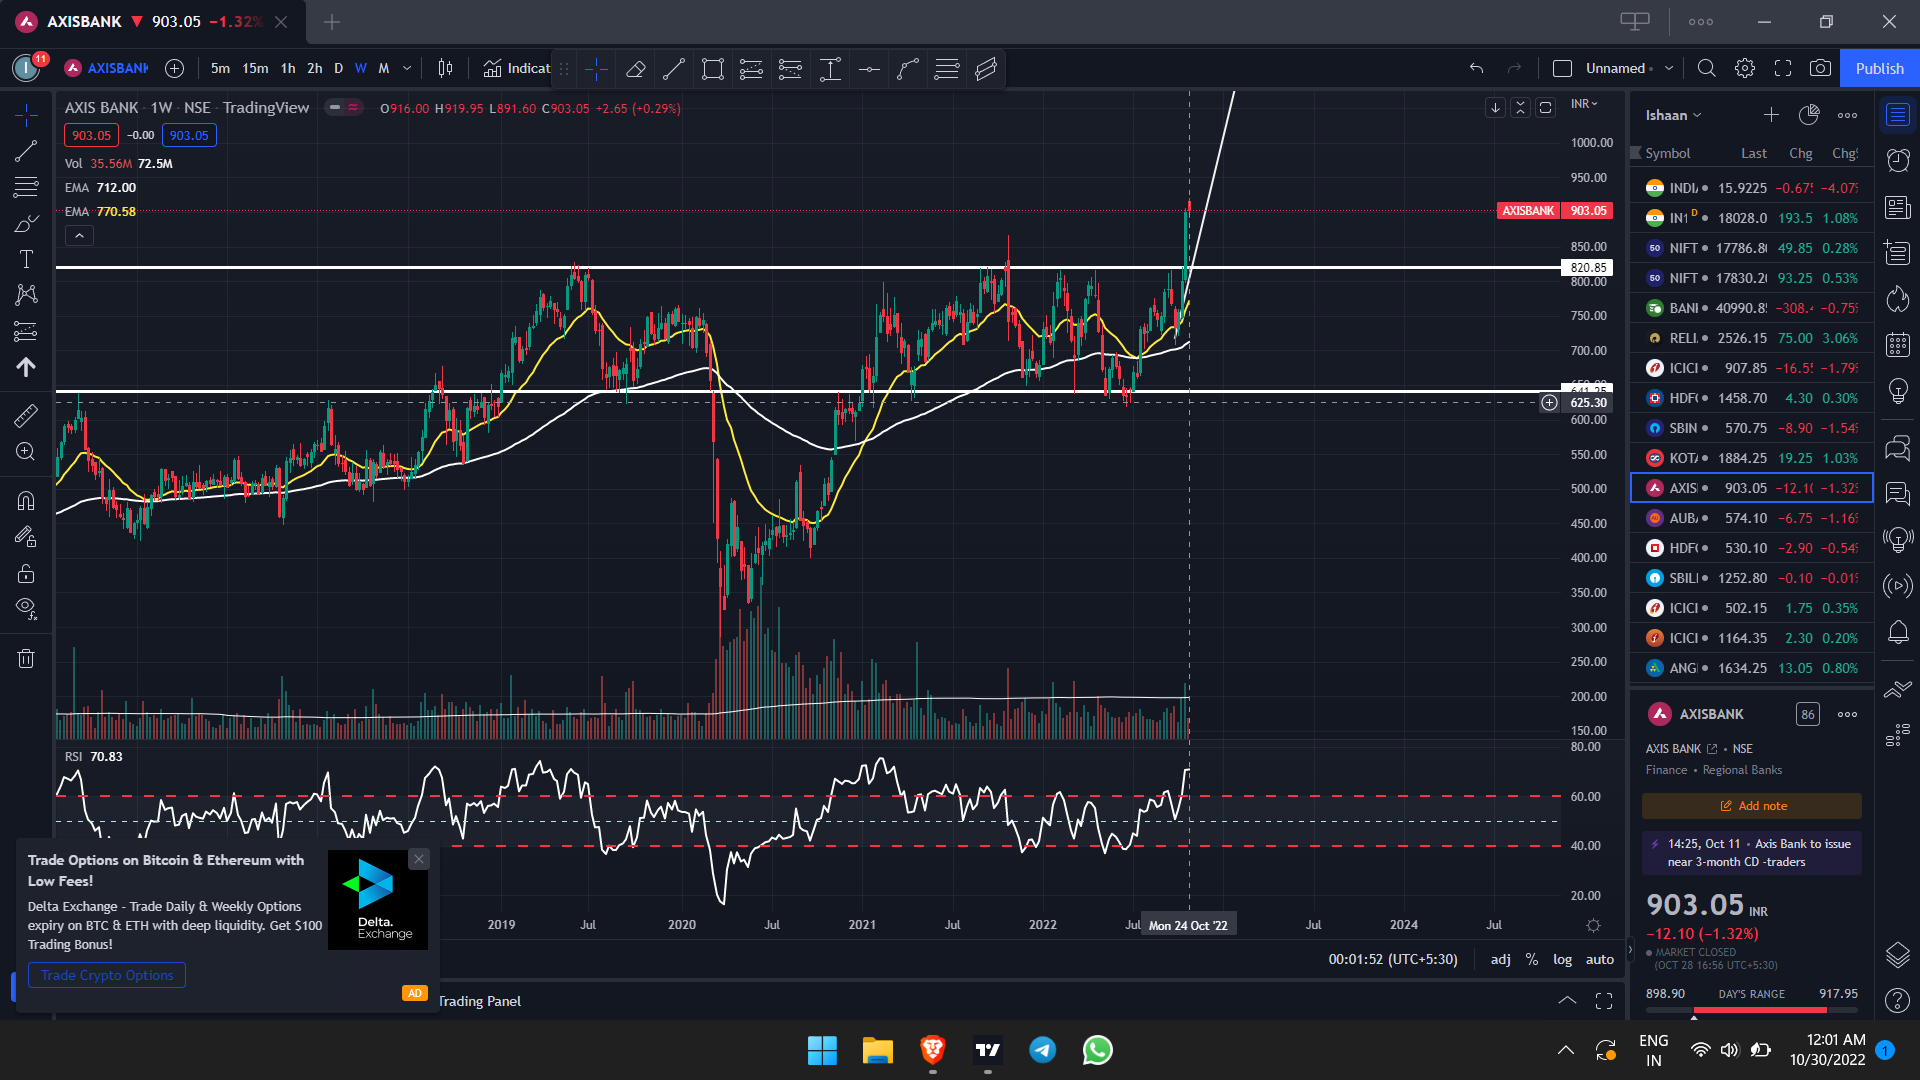
2 Likes
REC Ltd has been a dog of a stock. Its a company owned by PFC, which in turn is owned by the Govt of India. The hallmark of this company has been the very high dividend yield since past many years, more particularly so in last three years. Dividend yield has consistently been above 7% and currently based on past year’s dividend track record is at close to 10% yield. Along with the Sep quarter results, company has declared an interim dividend of Rs 5 per share and the ex dividend date is 9 Nov 2022. cmp 104. Based on earnings of last 12 months its available at less than 3 PE.
Coming to historical PE of the company, barring 2019, where it reached PE of 7, it has always remained at very low valuations. Last 3 years numbers have been consistently good, considering the valuations.
The scenario with current market is about slight change in perception towards govt companies. A lot of PSU banks have rallied hard, defence sector PSU companies have done well, and some others like BHEL seem to be showing promise in terms of price strength. In short, PSU companies seem to be enjoying market fancy albeit in varying degrees based on sectors and individual company.
Companies like REC and PFC have been long ignored if one looks at valuations and dividend yield. Its difficult to figure out what could change in terms of business prospects, but some change in market perception towards these kind of ultra cheap names could provide decent returns with limited downside.
Putting up chart of REC. Stock price on weekly chart shows a rally from Covid lows of 60 to high of 126 in late 2021. In fact level of 126 has been a strong resistance since 2018.
After the swing high of 126, stock price went down and took support close to 61.8% (at 91) retracement level of previous rally from 60 to 126. On short term daily chart it formed a double bottom at 91 and confirmed the pattern by breaking out above 96. Another major double bottom breakout can happen if stock price crosses 109-110, with range of double bottom being from 91 to 109 and if this pattern plays out by breaking above 110, target can be closer to 130, which takes it above strong resistance of 126. Falling channel marked between solid red lines shows last leg of fall and since then level of 91 and 95 (in dotted green lines) shows a double bottom in short term chart. It also shows a higher bottom at 91 as compared to previous bottoms at 60 and 68. The structure in weekly chart shows a higher bottom, higher top pattern till now and a break above 126 would signify a significant change in trend.
In the immediate near term, stock will go ex dividend by 5 Rs and we need to see how stock price reacts on going ex dividend.
disc: token position based on chart structure. A break above 126 if and when it happens could be a time to seriously consider higher allocation.

23 Likes
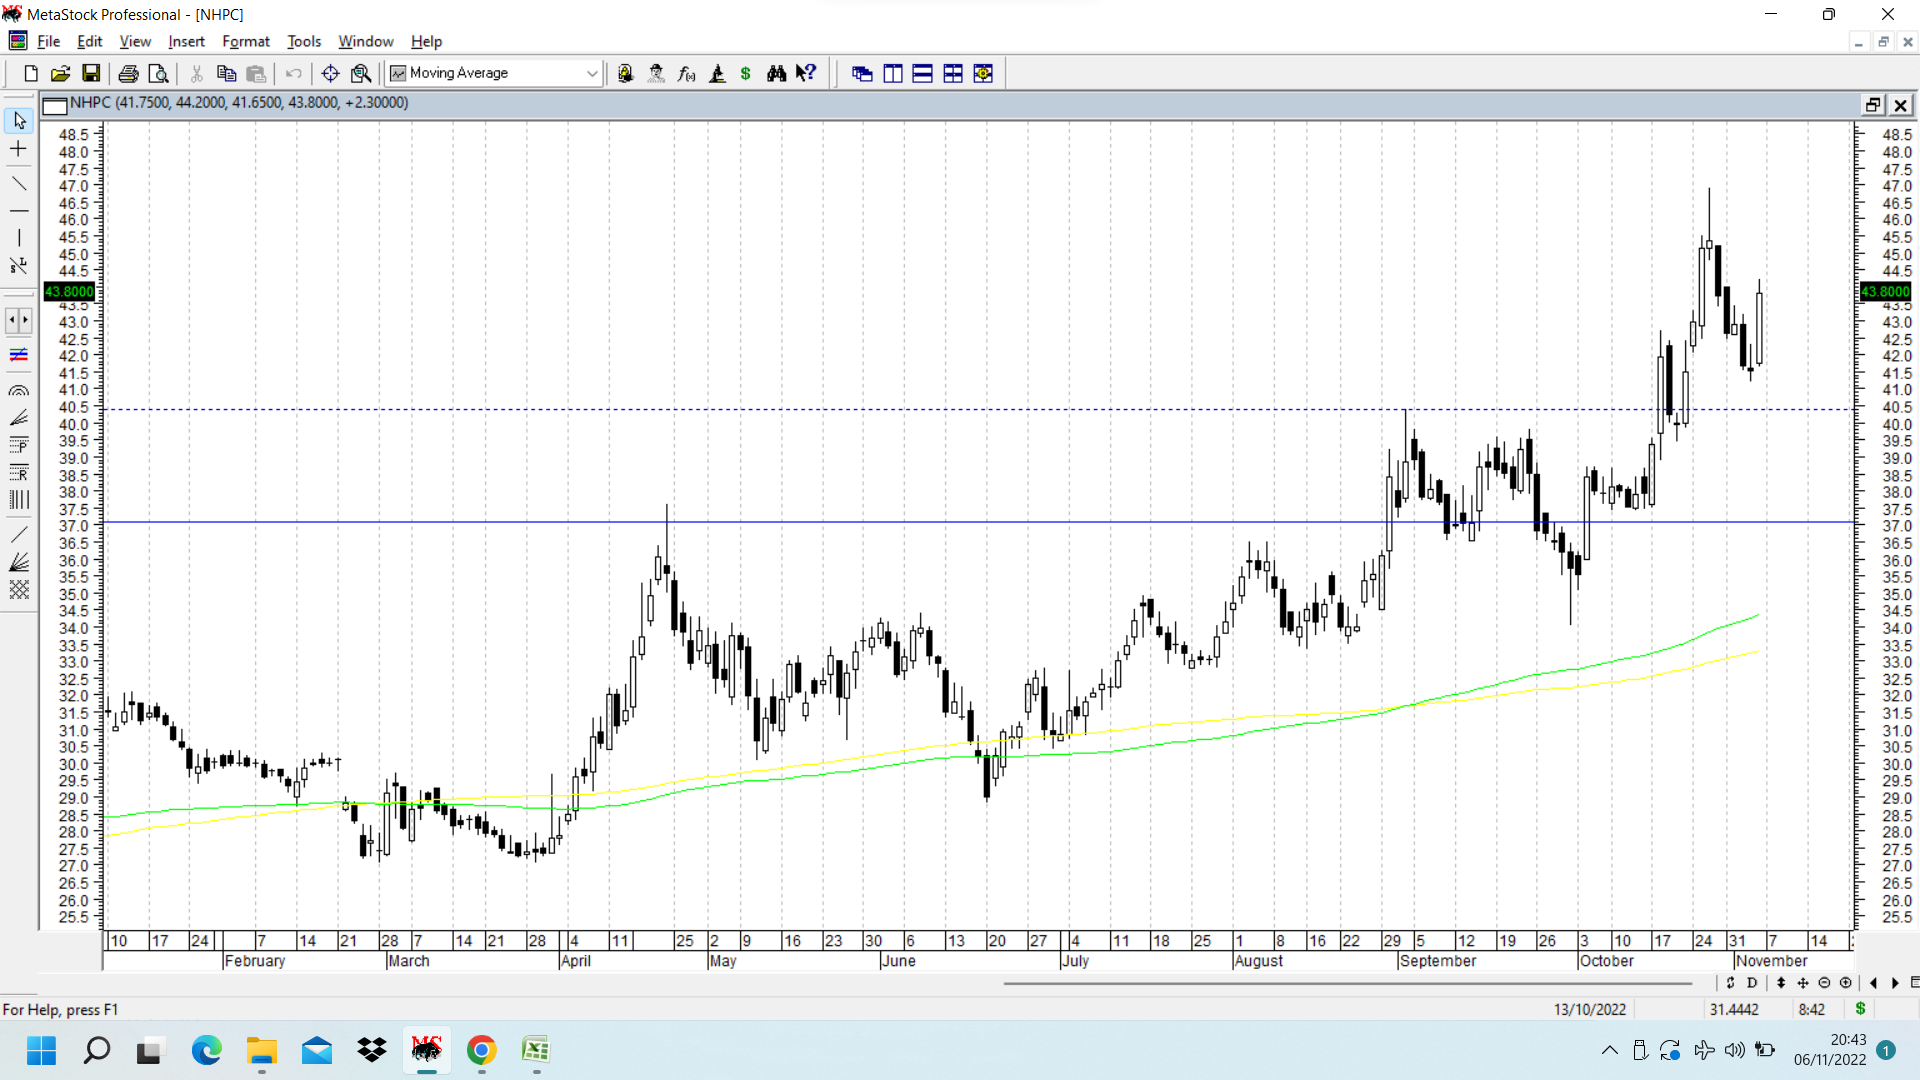
NHPC had been covered previously on this thread as a stock which broke out above previous major resistance at 37 and then all time high at 42. Stock price hit a fresh all time high of close to 47 and reacted and went down to retest previous major resistance at 41-42. On daily charts it has formed a morning star pattern on candlesticks if one sees the last 3 daily candlesticks. disc: invested as disclosed before.
14 Likes
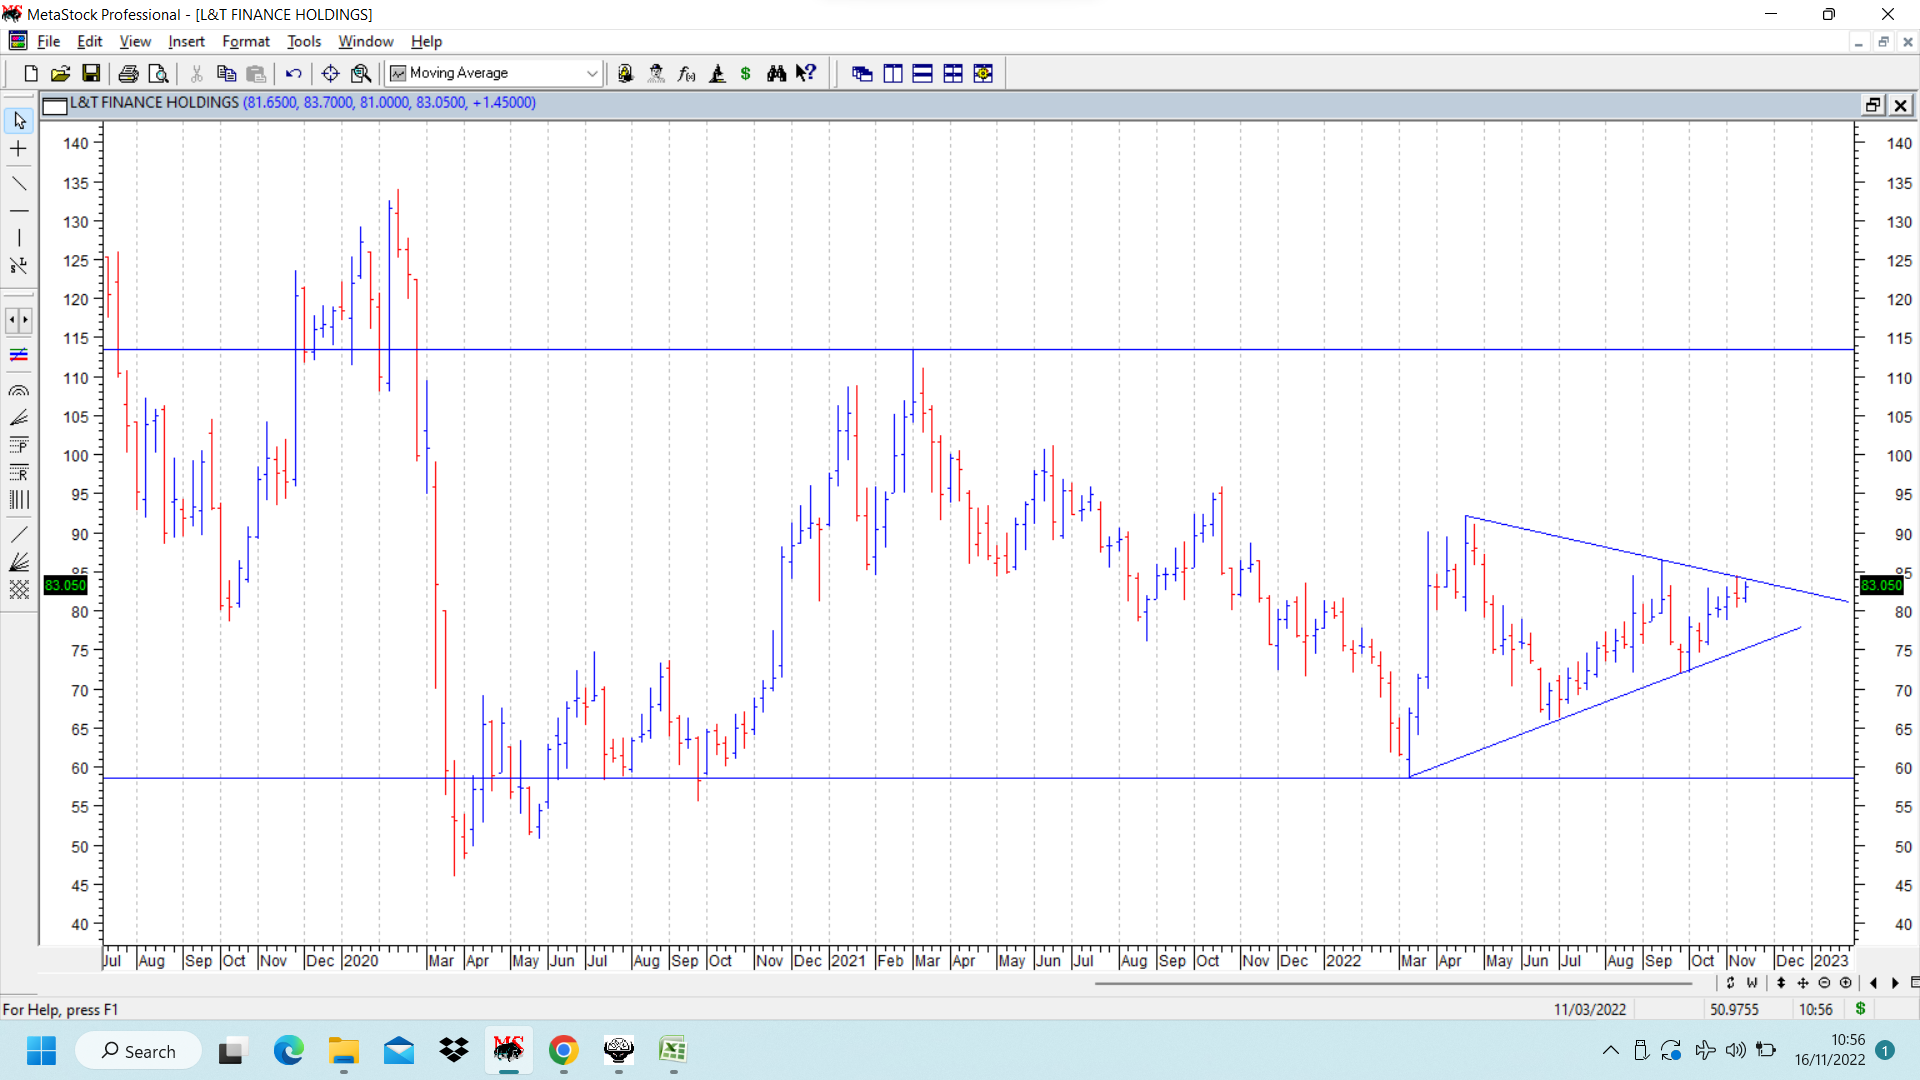
L&T finance holding chart put up below. It has formed a double bottom at 58-59. Confirmation of the double bottom breakout would happen on break out above 113. CMP 83. If that breakout happens in the future, target can be 167. At present consolidating within a symmetrical triangle as marked on chart. A breakout from that will happen on breakout and close above 84-85.
Fundamentally it has posted decent results for q2 FY 23, and management has articulated its Vision (Lakshya 26 ) 2026, wherein they aim for retail loan book of 80%, and class leading ROA and asset quality. As of now they seem to be making progress on that path. Currently available at close to book value. If going ahead, they can start going closer towards their stated targets for 2026, this can be rerated from 1 times book to higher multples.
Another important event in q3 fy 23 would be receiving the funds from divestment of MF business to the tune of 425 million USD and in a rising interest rate scenario would be good for the company.
disc; invested based on techno funda picture. (not a buy/sell recommendation. )
19 Likes