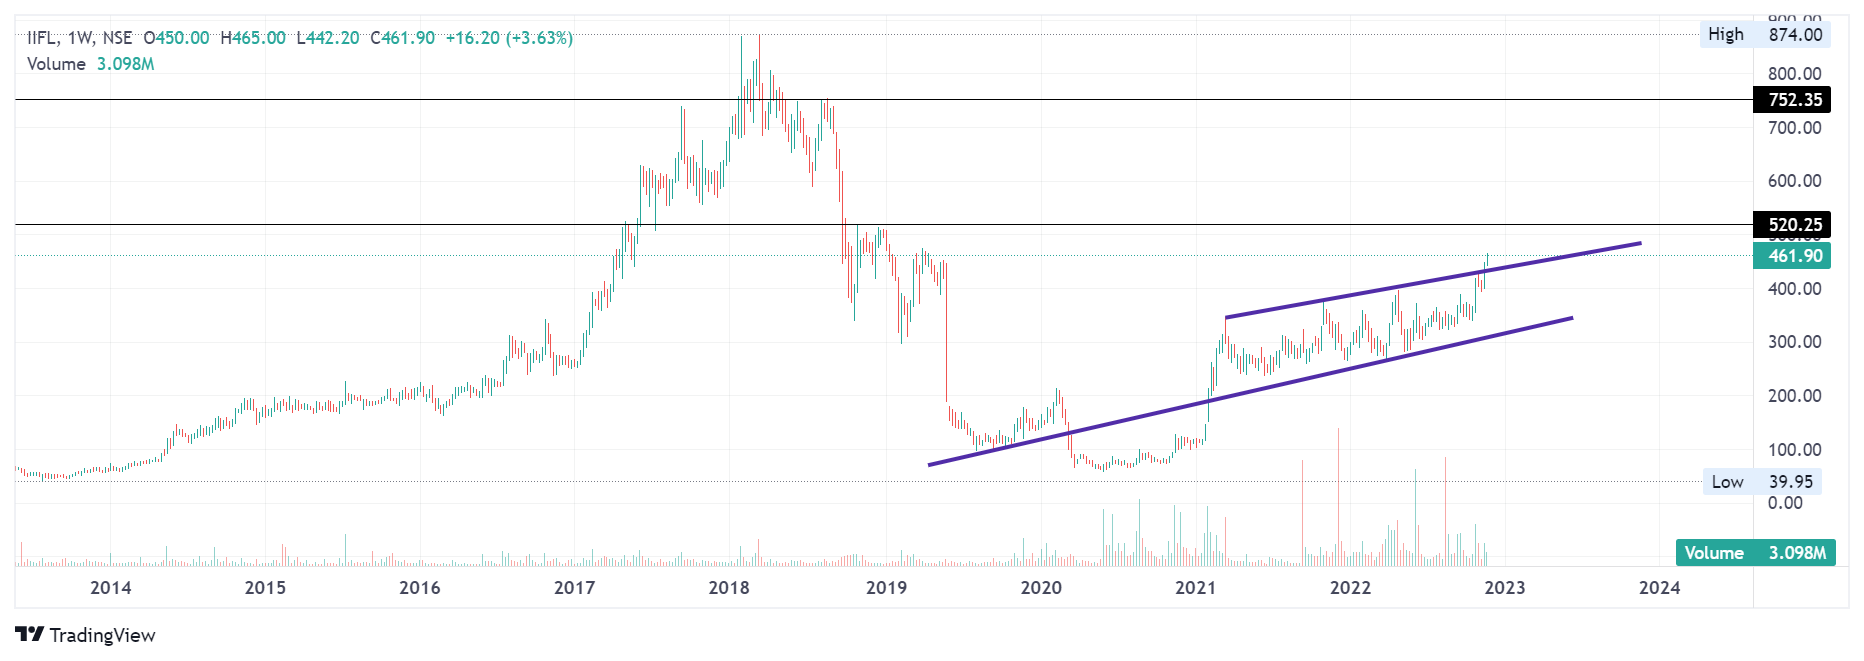
IIFL Finance chart attached below. It has recently broken out above the trend line and is currently trading at its 52 week high (CMP~462Rs.) 520 is the next resistance. If it touches 520, then comes down to retest the upper trend line and then breaks out above 520, next target can be 750.
Fundamentally, its numbers have been improving since last few quarters. GNPA 2.42%, ROE 20, ROA 2.74%, with revenue and profits at all time high. Current P/B = 2.1 with median P/B = 1.7.
Fundamental risk - Margins are at all time peak, how much higher they can go remains to see.
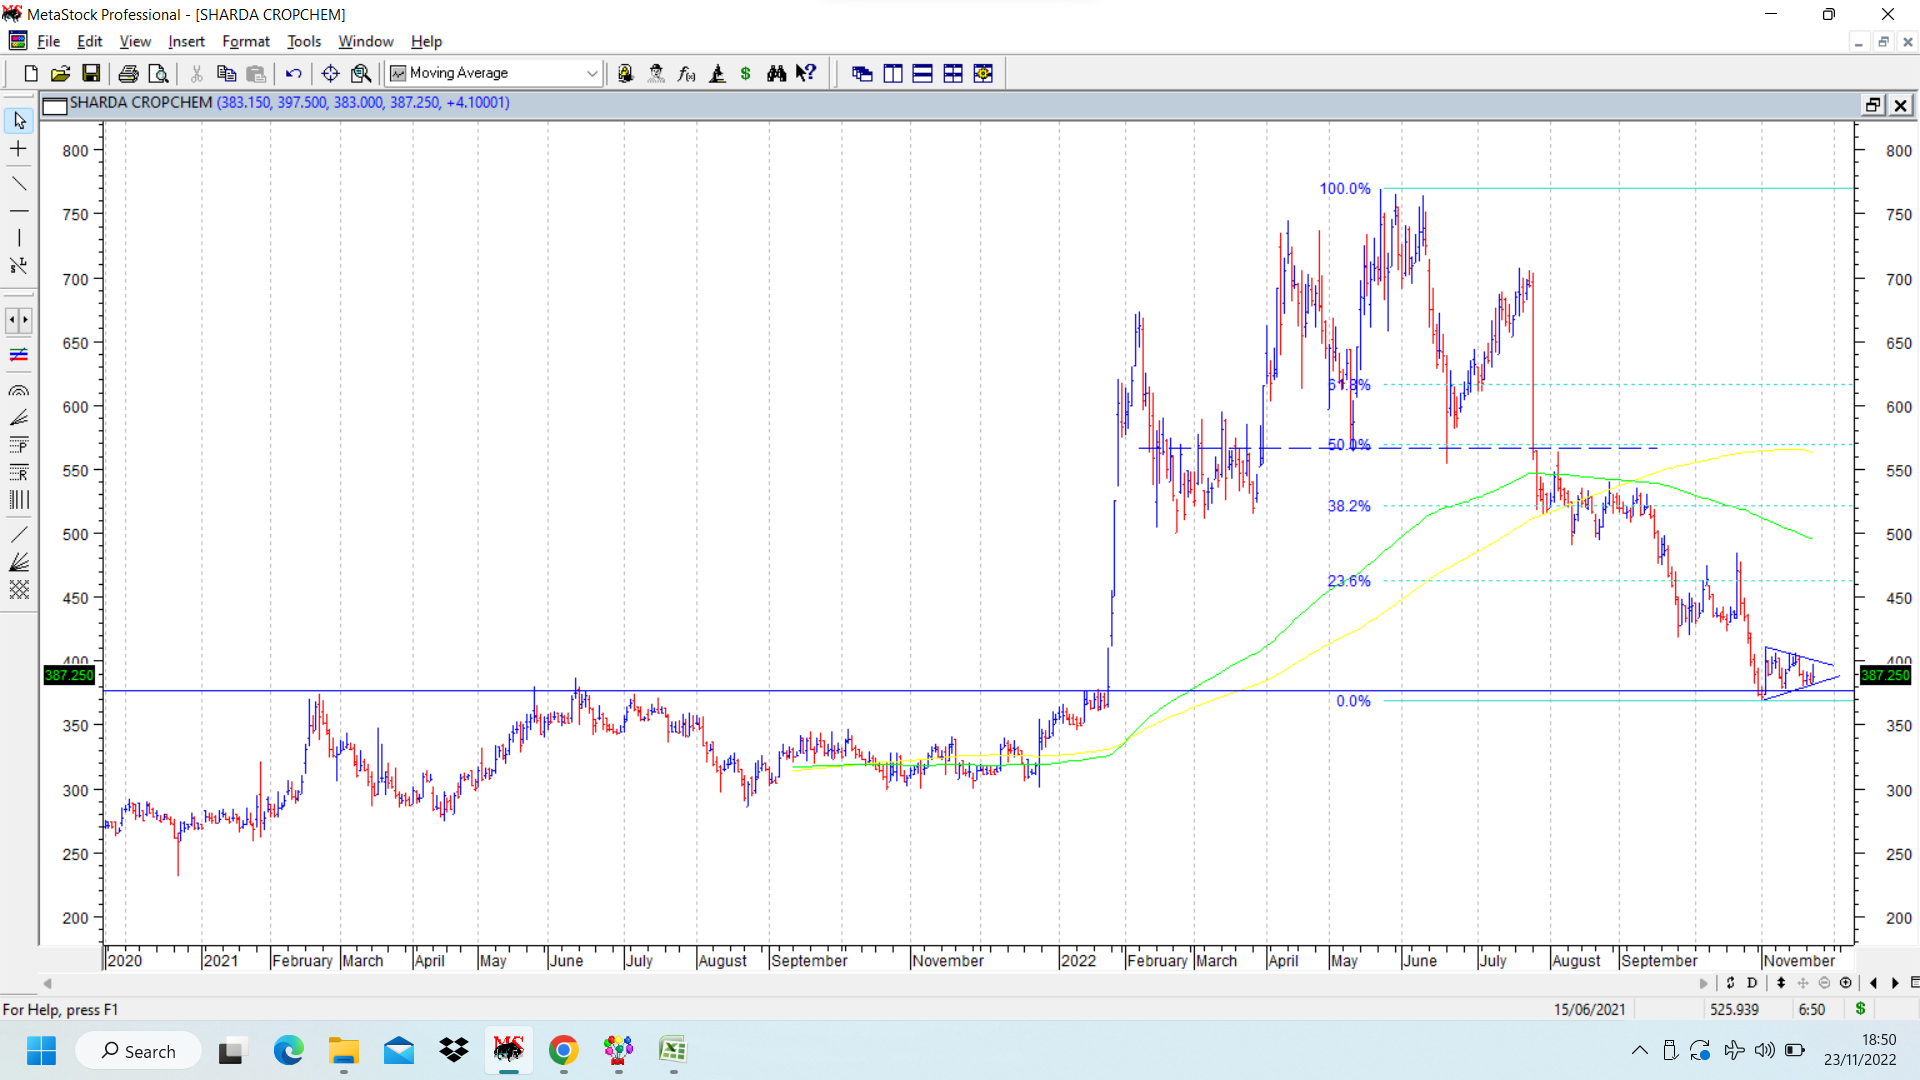
Sharda crop chart was earlier discussed because of its bearish head and shoulders breakdown (marked in dotted navy blue lines at 550-560) . Since then it has had a sharp fall and now come to crucial support levels 370-380, which was previously a major resistance in 3 instances as shown on the attached daily chart. The fall seems to be arrested as of now, and stock price is trying to consolidate in a triangular pattern. If and when it breaks out of the consolidation, above 395-400, it can provide a tradeable bounce. The resistances on the way up (if a counter trend bounce does come about) are marked on chart by putting up Fibonacci retracement levels of the fall (shown in dotted sky blue). disc: under watchlist. No positions.
Neuland chart was covered on Oct 1 2022 and above observations were quoted. Since then stock price managed to cross the crucial resistance of 1470 (after some brief consolidation around that level ) and it gave a sharp rally to post swing high of 2002. Major resistance was seen at levels of 1860 where previously there was strong resistance. Currently stock price is undergoing consolidation and we need to see how it behaves post this consolidation. Its important to keep watching daily charts to see any signs of a major trend change on daily time frame. On weekly its already in an uptrend and is consolidating.
Shown in attached chart is support zone (in dotted green lines) mentioned in previous post which was in region of 970-1300 and that did provide support for consolidation. And upper boundary of consolidation is marked in solid navy blue line at 1470. Above that, major resistance is shown in dotted red line at 1860. Till now everything has played out according to technicals.
For me it was a way to look at how to play for bounces in stocks which have corrected sharply. These bounces may be dead cat counter trend bounces, or the real deal meaning, a major trend change. Key learning here was not to waste time by getting in at or near bottom and face the frustrating time of consolidation. Ideal time is to get in at the time of breakout from consolidation ranges… Most important factor to watch is the volumes at the time of breakout. This kind of learnings will provide an important weapon in the arsenal of technical analysis because everyone nowadays is going in for breakouts, so playing pullbacks could be the less crowded trade.
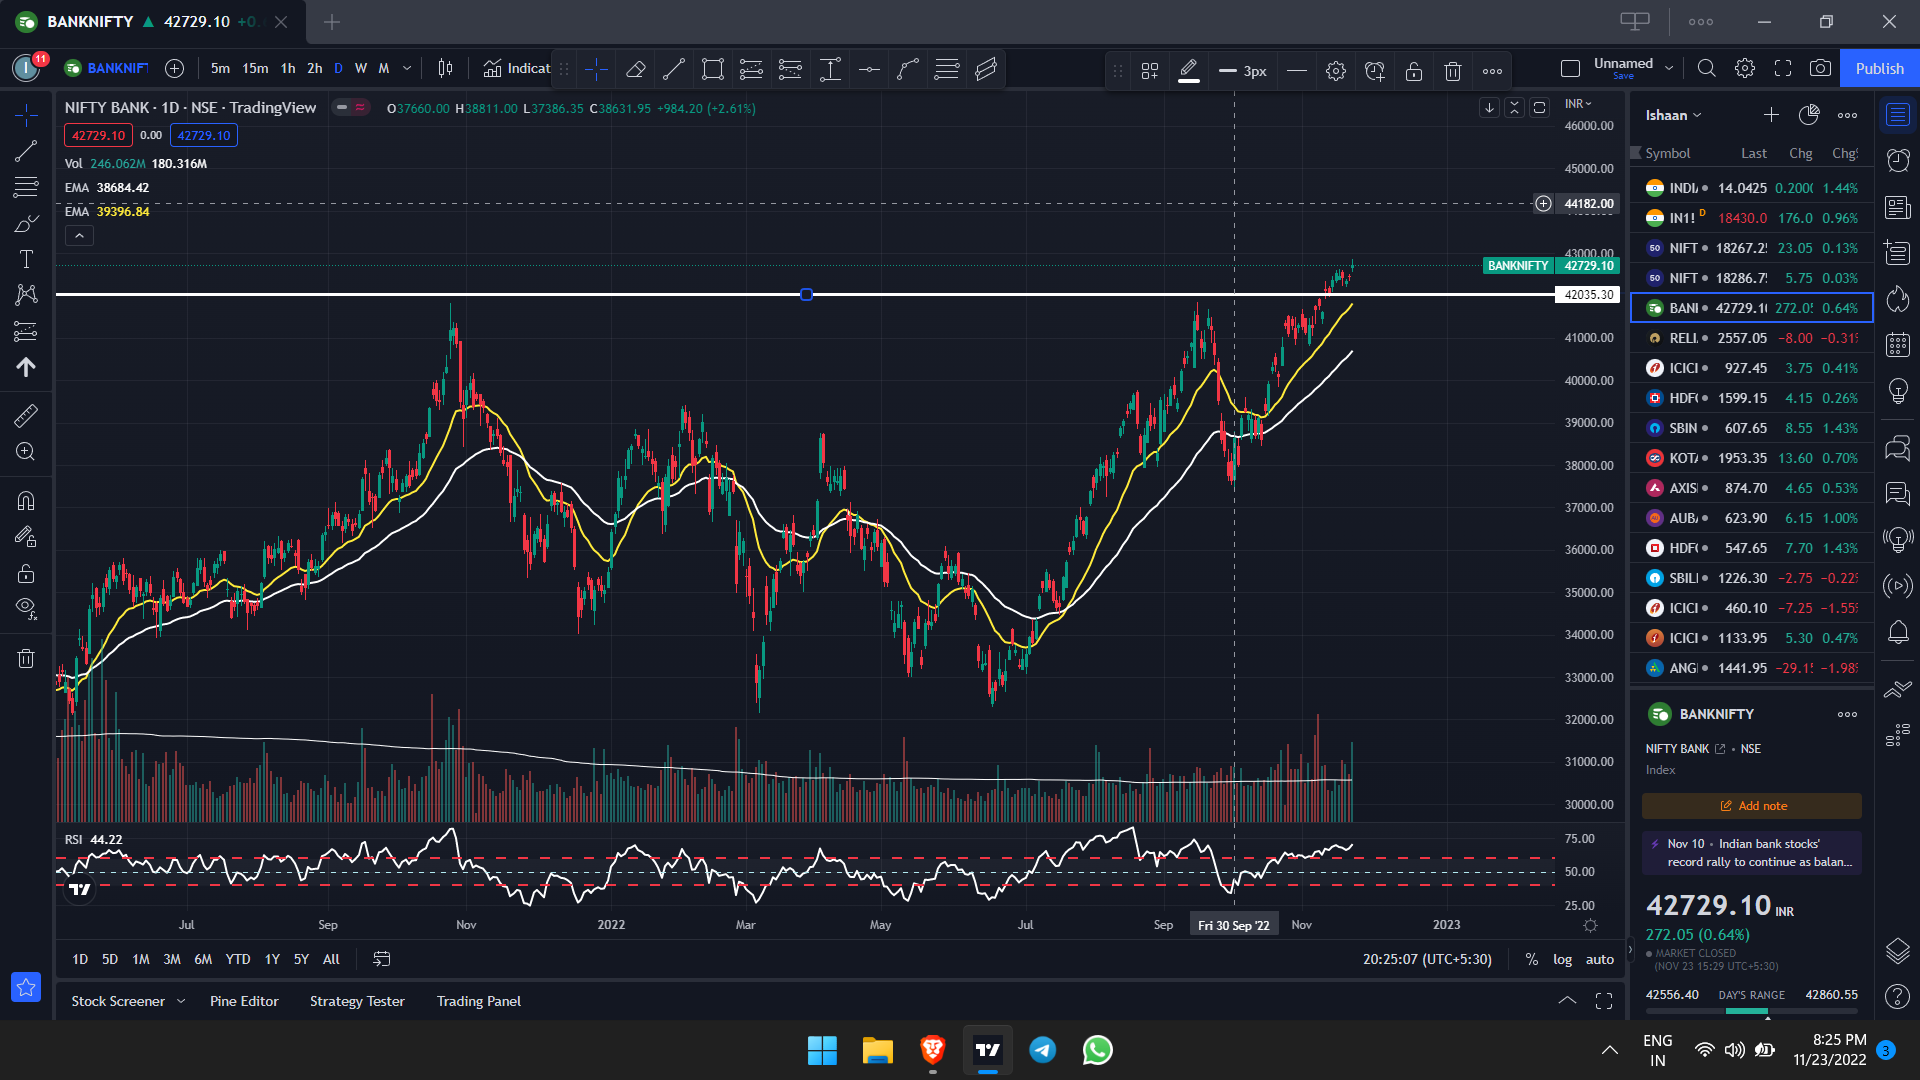
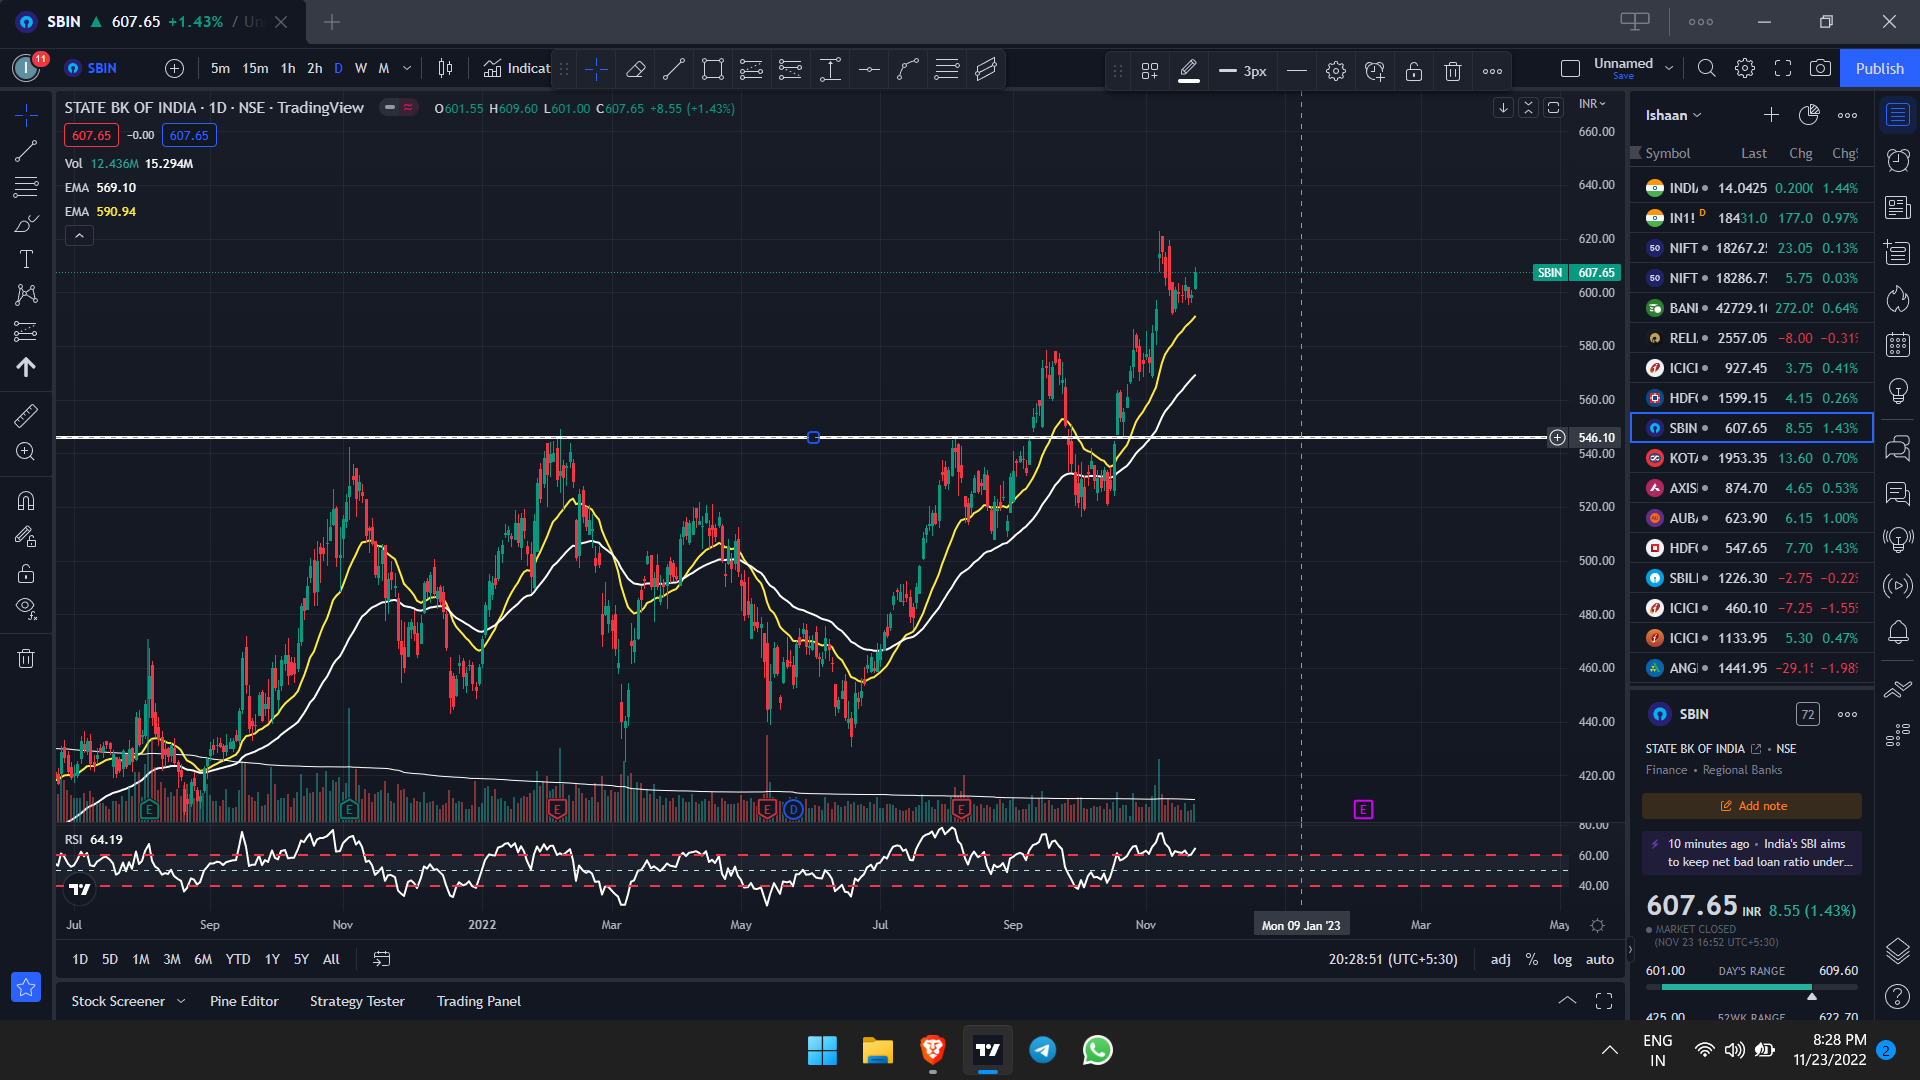
It is not a stock as such but the whole Bank nifty. One can see how Banking Stocks are at ATHs. Following are the charts of the same. Some are near their highs, while some are creating new highs every week.
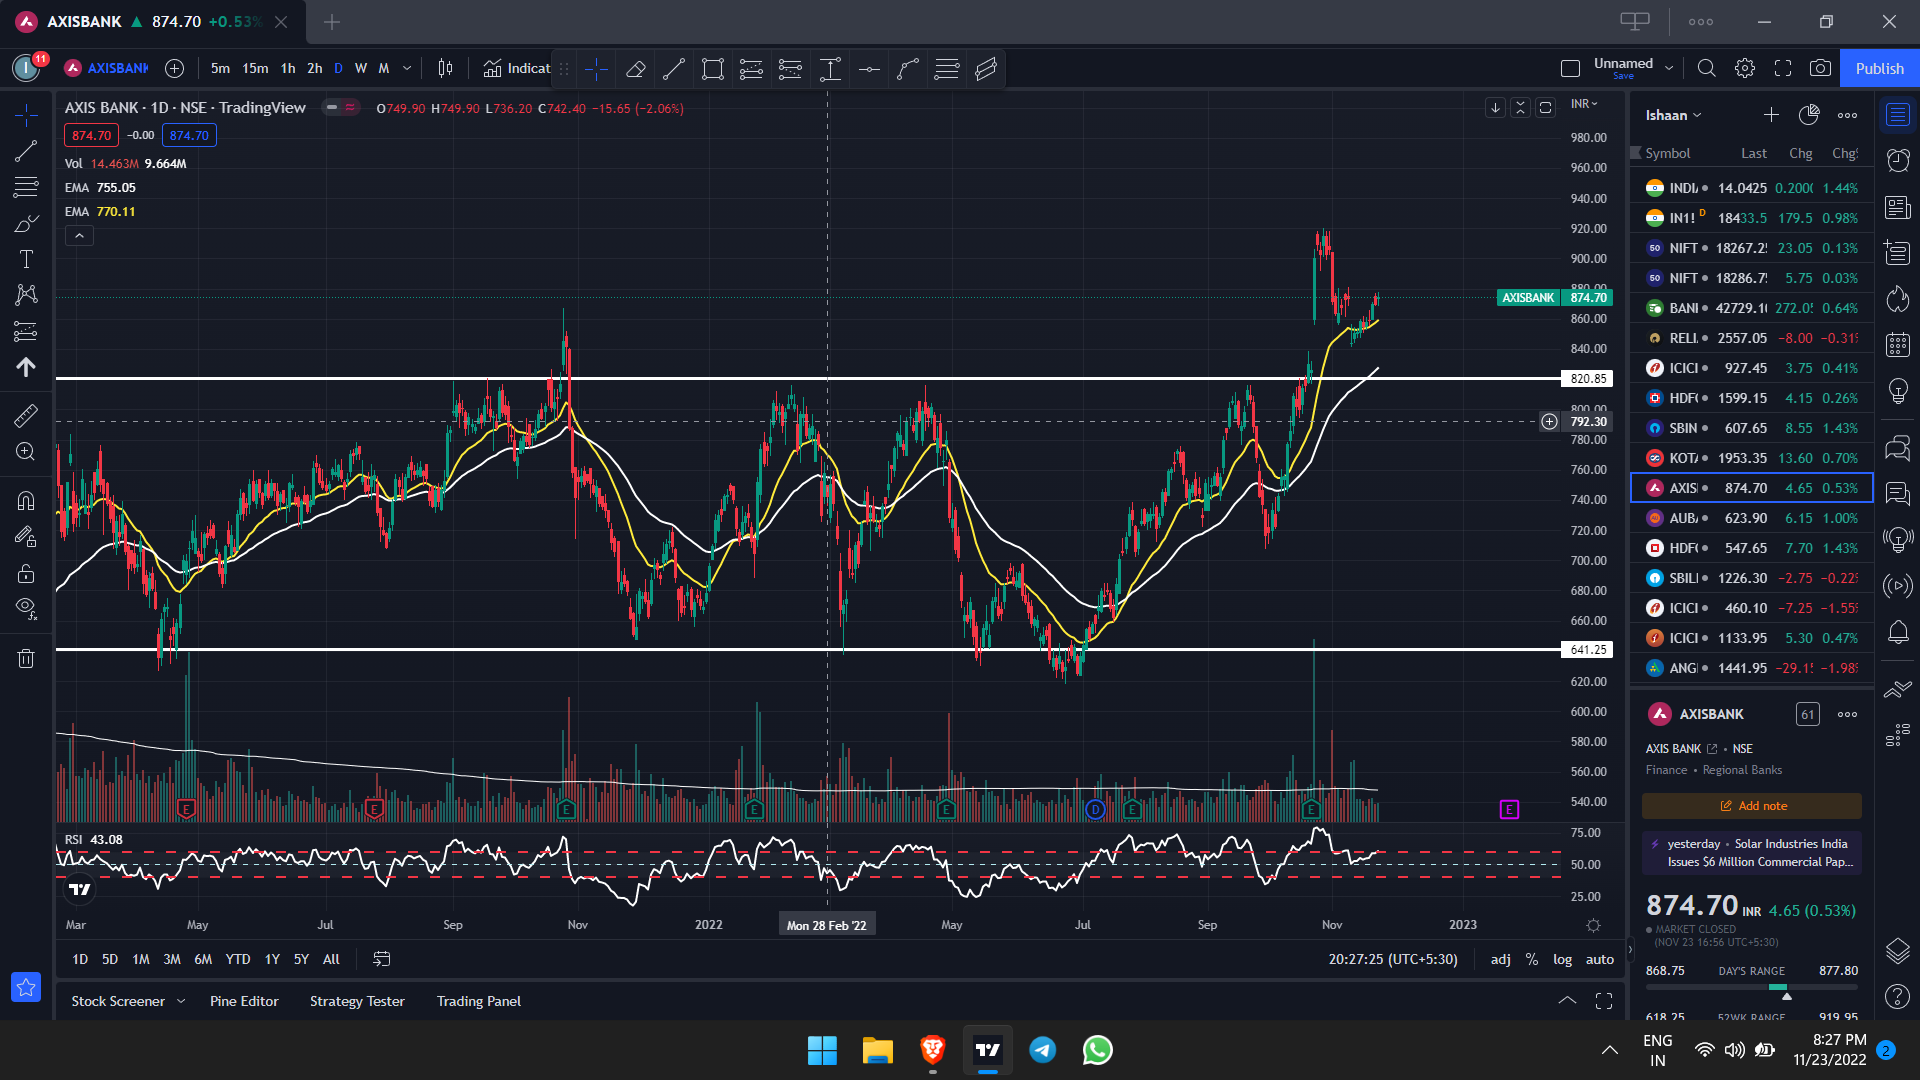
AXIS BANK
It broke out of a the channel and is now retesting the previous level. One can see the bounceback from 20EMA which confirms sustenance.
HDFC BANK
After the news of merger, it made a temporary high but got sold into really quickly. Now it has gained back the momentum. It may take a while to cross the upper resistance but eventually it will ride the 50EMA to new highs.
KOTAK BANK
Same is the case with Kotak. It has been consolidating for long. It broke out last year but did not sustain since volumes were very low. A breakout with decent volumes can sustain the breakout.
NCC daily chart shows a breakout from a cup and handle (slightly unusual shape) above 76 and then consolidating in a triangular pattern with shrinking volumes. Today it has attempted a breakout from this short term consolidation with much higher volumes as compared to past few days… If pattern plays out, target can be 96-97 (shown in dotted blue horizontal line) . Important to note that on the left side of chart, between two horizontal dotted red lines, there was prolonged consolidation before the stock fell down. This region of 70-86 should be watched out for resistance. disc: invested as a trading bet.
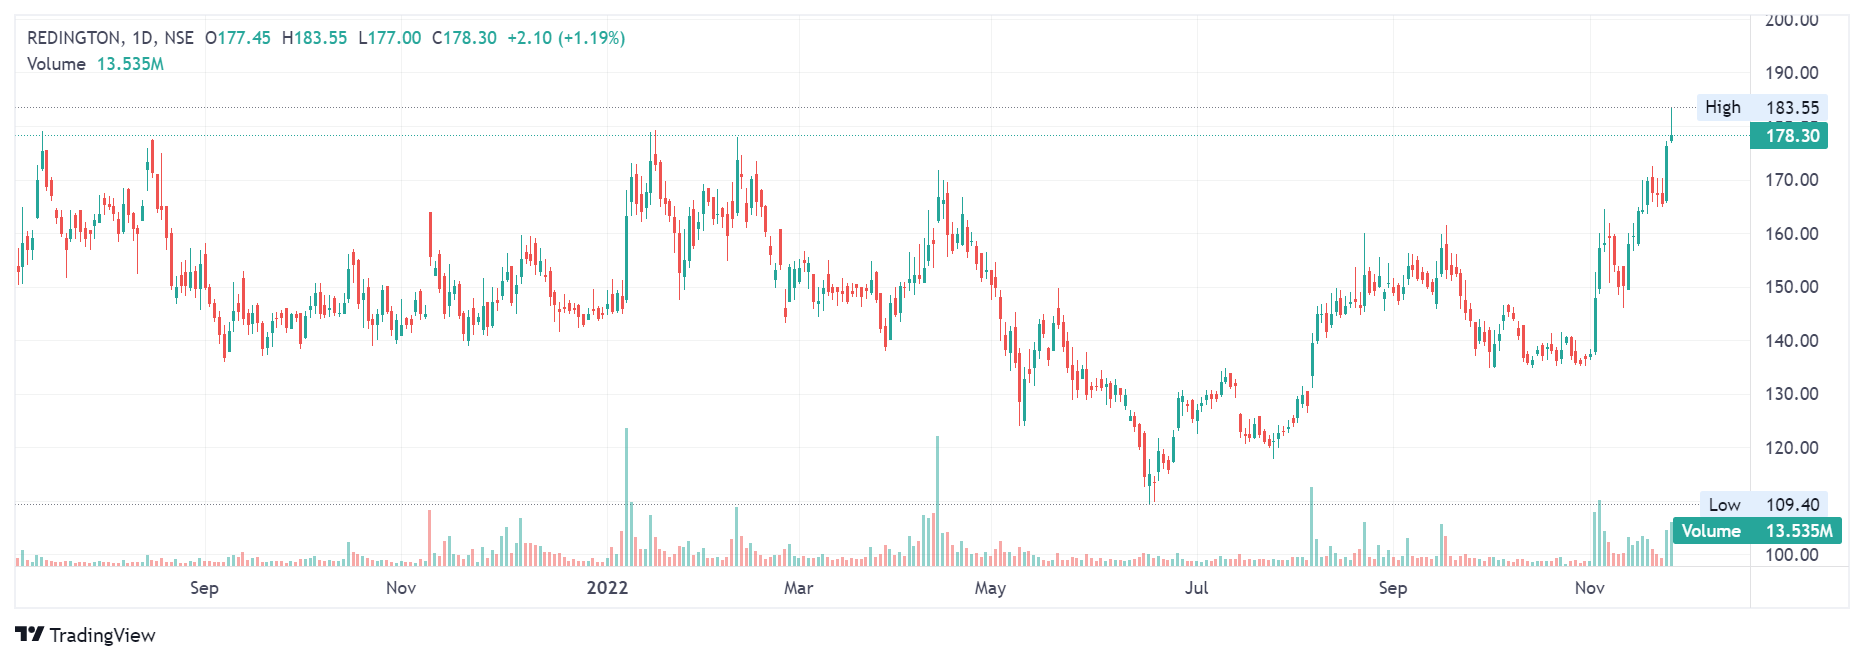
Redington India - Daily
Today, Redington breached it’s all time high to record a new high with decent volumes. However, it closed with a long upper wick (with length of wick more than thrice of that of the body) forming a shooting star pattern. It is an indicator of uptrend reversal.
Confirmation - Next candle’s high should be below the high of shooting start and also it should close below the close of shooting star. Then the trend reversal could be possible.
Fundamentals - Redington recorded their highest ever revenue last quarter. They have been recording higher revenues every single year. With increasing contribution from high margin segments (cloud & services) it is well poised for a strong growth. Also, third quarter has been traditionally their best quarter. Should the price sustain above 172 levels until the third quarter results, results could be a great trigger for a nice breakout above ATH.
The 52 week high strategy is mainly for those wanting to invest for the medium to long term. For those who want to invest for short term, the lower time frame charts like 3,6 months chart also will do well. It doesn’t matter how much time period you are considering. Basic idea is that the stock has to cross a crucial set of resistances on the way up. These have in the past been supply zones for the stock’s upward journey and once these are cleared the further road ahead till the next road block is usually easy.
The whole idea of this thread is to grasp the idea of strong breakouts. One can modify investment styles based on this basic premise.
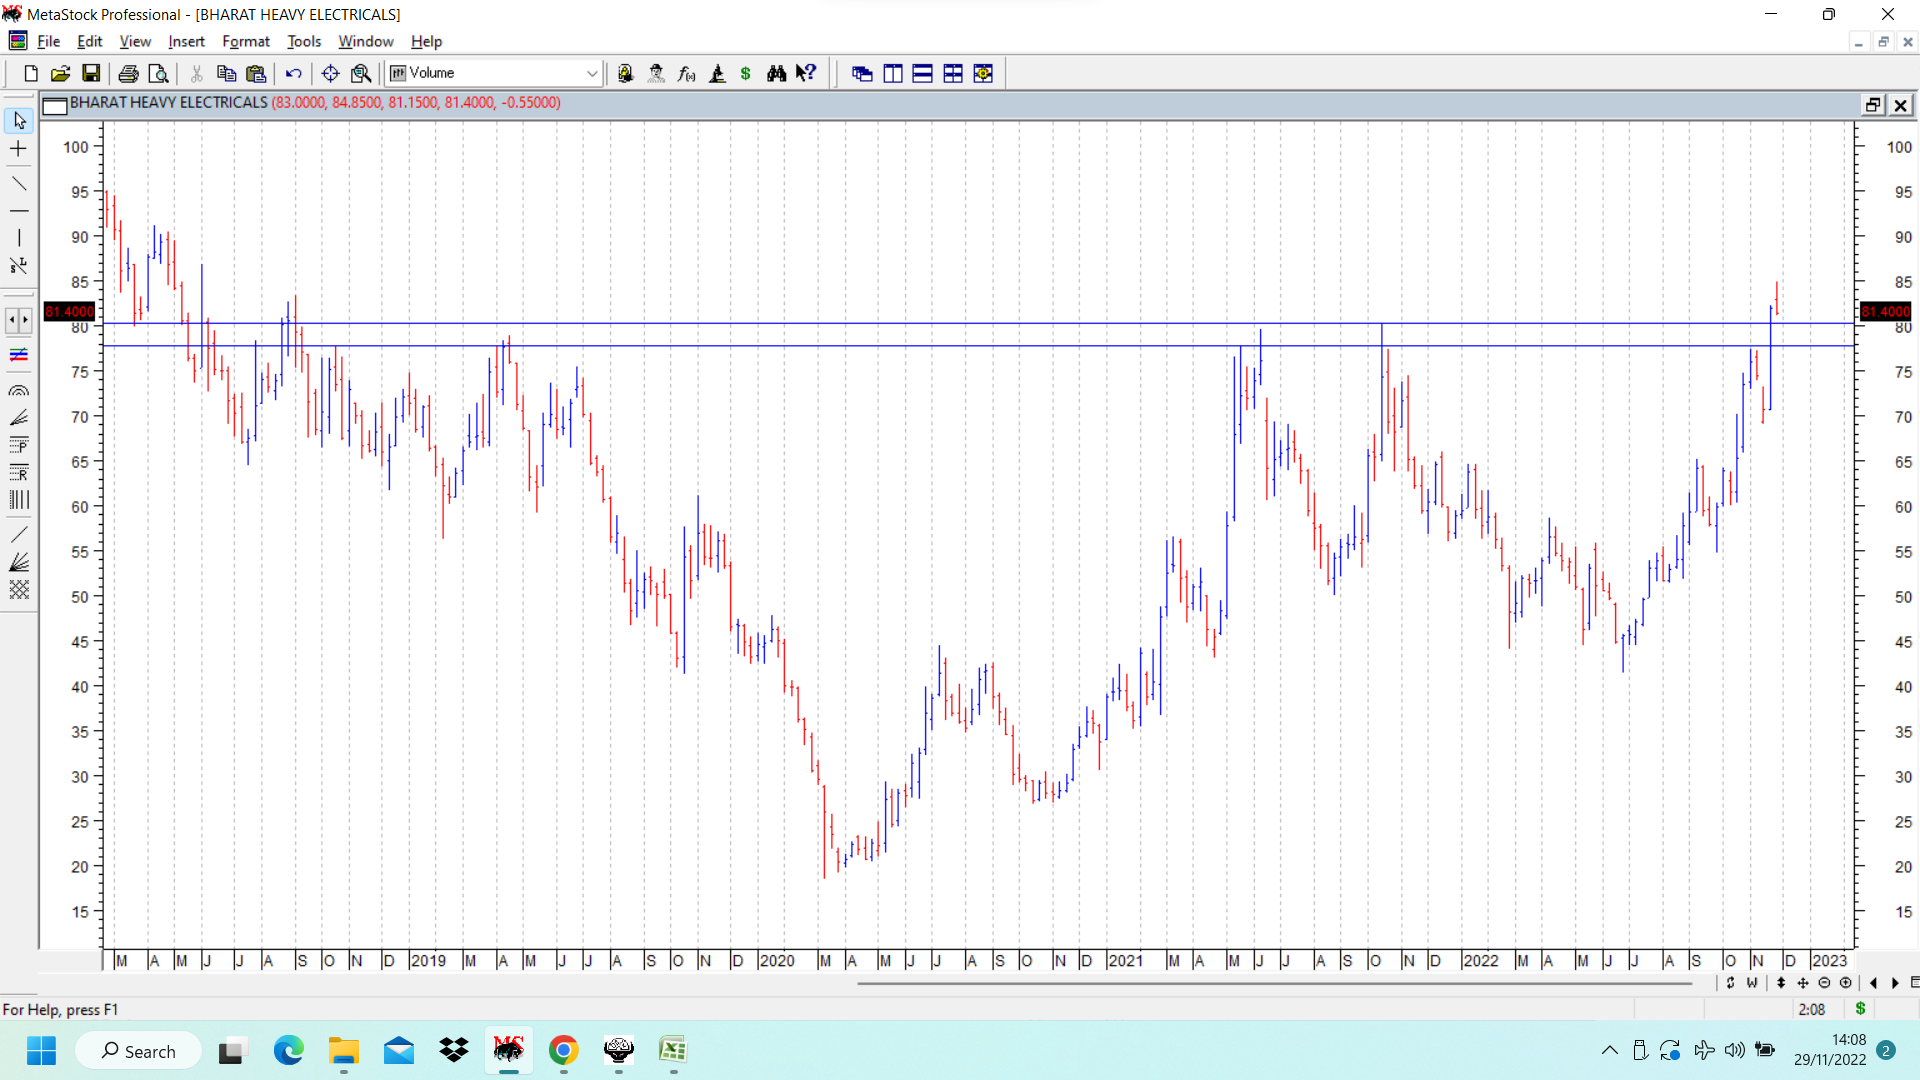
BHEL chart was discussed in Sep 2022 under the above post. Since then stock price has shown good move from levels of 60 to currently above 80. Now once the major resistance of 80 (4 year high) is cleared, there could be some consolidation in price. The previous resistance zone of 77-80 should be watched for support on declines and then on signs of reversal from consolidation, one can consider buying.
In the attached chart the previous resistance zone is marked by two horizontal blue lines.
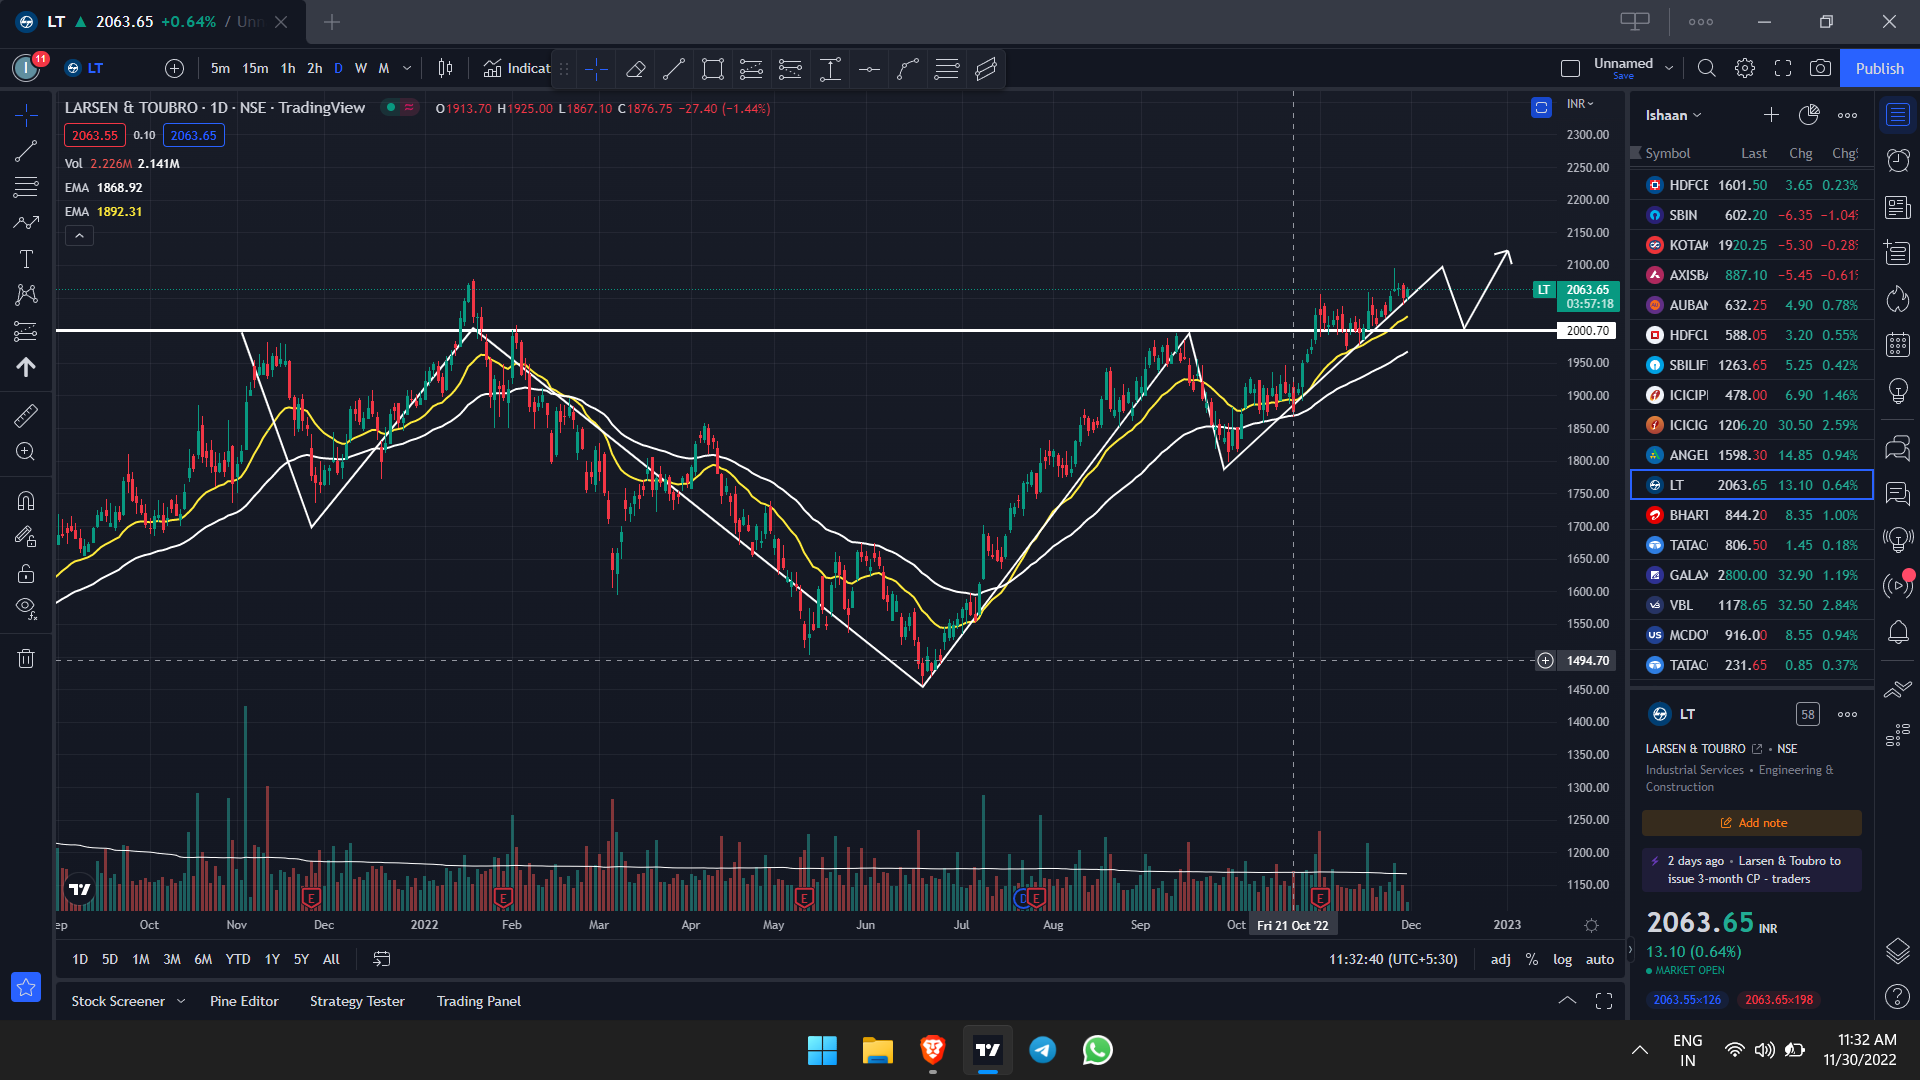
This is the chart of Larsen and Toubro. Last year it made a high above 2000 but couldn’t sustain it and corrected. Now it has formed a Inverse Head-n-Shoulder pattern and is comfortably trading over the 2000 level. according to the charts the target price should be 2500 for next 1 year but being conservative one can expect 2200 levels shortly. It is currently trading at 2060 levels. Considering the upcoming budget and healthy tax collections run rate going forward, we can see increased capital spending by the government, which has always been positive for LnT. Also their Middle East business looks very promising.
In early September I had done some analysis on REC and PFC and had taken positions. Sharing observations, I had then.
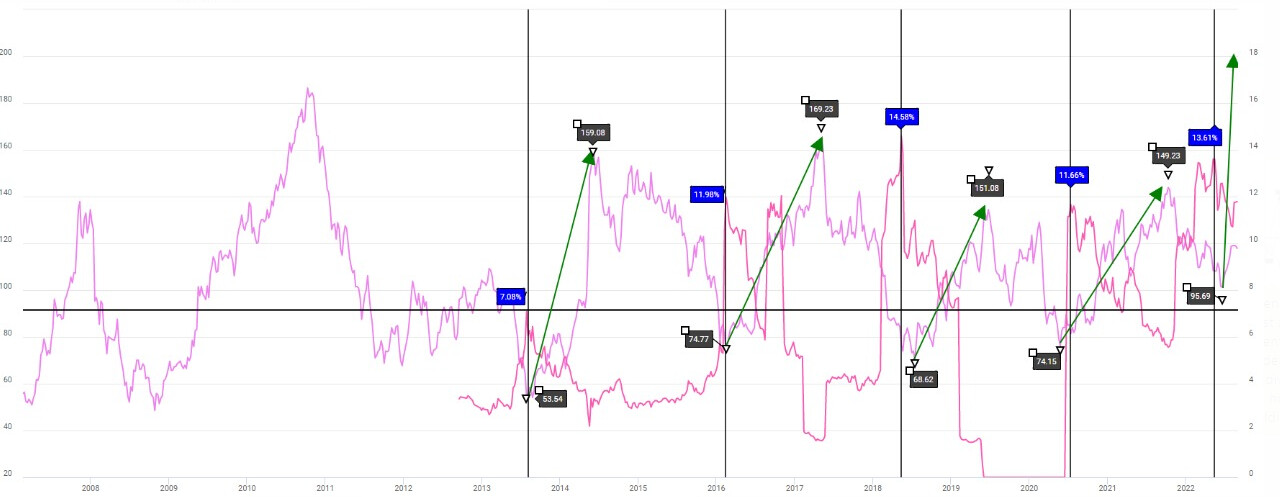
PFC Div Yield and Price Co-relation. Div Yield highlighted in blue and stock price in black.
Whenever PFC’s dividend yield has crossed 7%, the stock has given at least a 2 bagger return in around 1 year. There is a small but gradual increase in FII holdings too.
There is a similar trend in REC too and this pattern keeps getting repeated every few years.
The above pattern can also be co-related on technical charts.
There was a flag pattern BO too on NCC weekly charts. Potential retest of that and Cup and Handle today.
Flag pattern targets too in range of 96-97.
Strangely Tradingview shows data only from 2011 and not before. But if one looks at long term charts from around 2003 then the trendline drawn from 2007-2008 top comes at around 97. Weekly/monthly close above 97 can potentially signal a major trend change.
Negative news of IT raids today, if selling gets absorbed and stock moves up then would be a good sign.
Has always deceived this one. Hoping it’s different this time
Can you put up the name of the company whose charts and details you have put up? Cannot find it on charts or on write up…
Same goes for other people who put up charts. Please mention name of company in question in write up as often its difficult to get it from chart esp if image is cropped.
Done Hitesh Bhai. I had replied to your post of NCC, so assumed that it’s understood that it would be NCC. But agree, somebody looking just at my post might not be able to understand it.
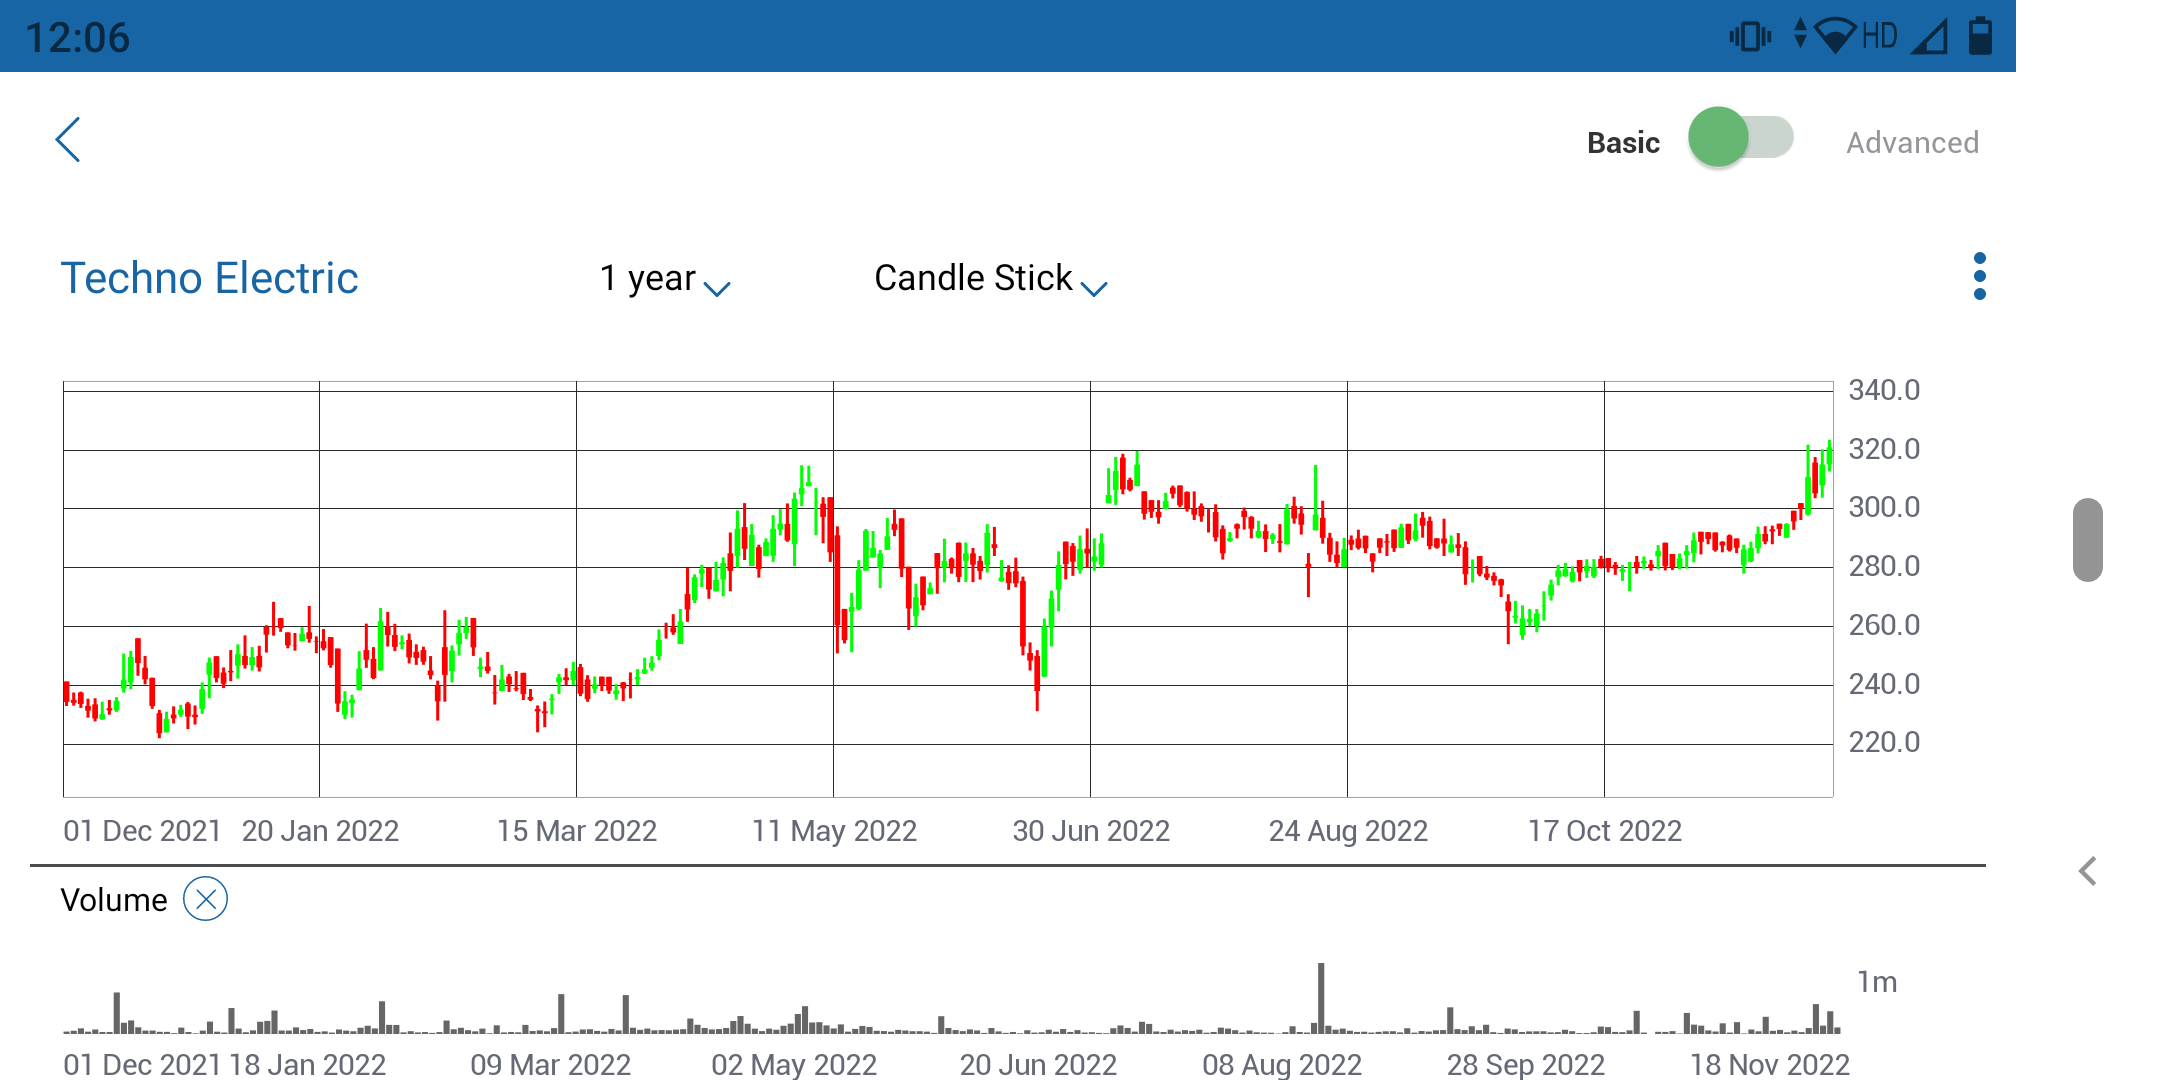
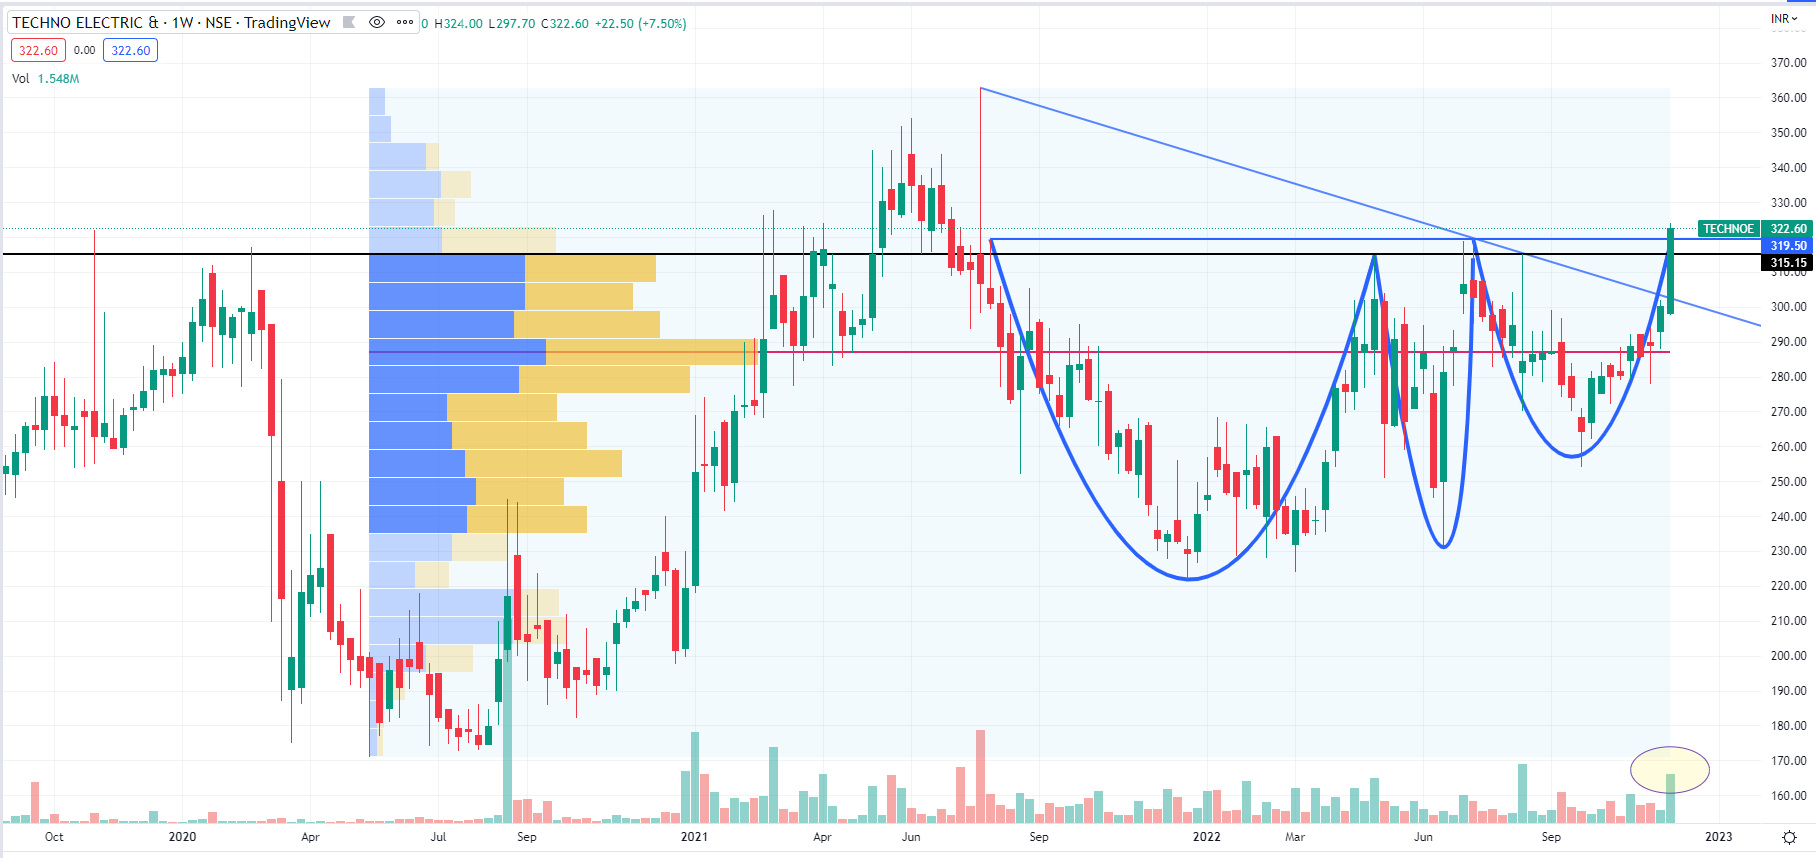
Very good closing today. Finally crossed hurdle of 320 on weekly closing with good volumes.
There is a VCP breakout too on weekly charts and it has also closed above its volume profile node since March2020 lows.
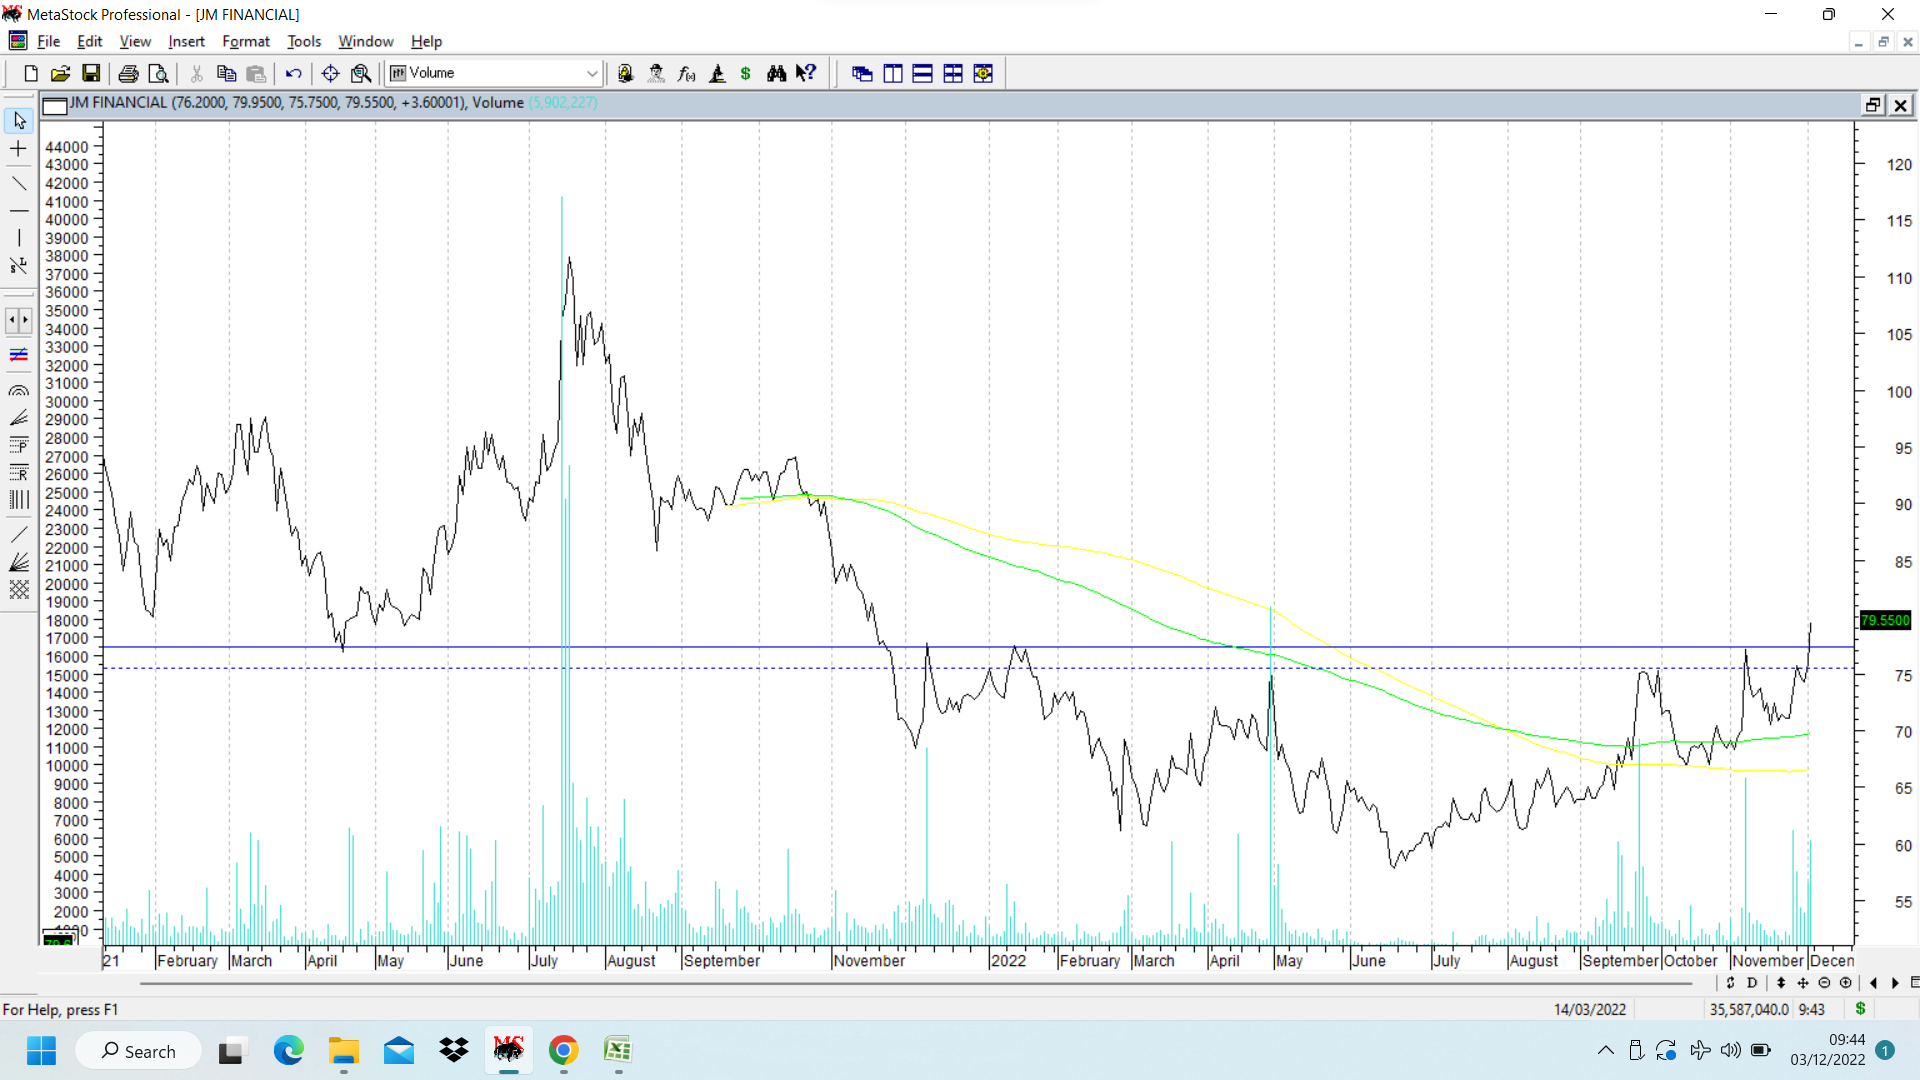
JM financial closed at 79.5 this week. It closed above 52 weeks high this week. In the daily line chart put up below, previous strong resistances are marked at 75.5 and 77.5, which were crossed this week.
The overall pattern is of a rounding bottom pattern and the recent move has taken out important pivots. This usually indicates a change in trend. These kind of patterns offer early entry into a stock’s upward journey. One can look at similar chart patterns in Aegis, Pricol etc. when these were in their early stage rallies. In case of JM financial, near term pattern target is top of rounding bottom which is 111.
The smaller NBFCs like LT finance (covered earlier), AB Capital, JM financial etc all seem to have started their upmoves and this could be the space to watch. disc: invested as a techno funda bet.
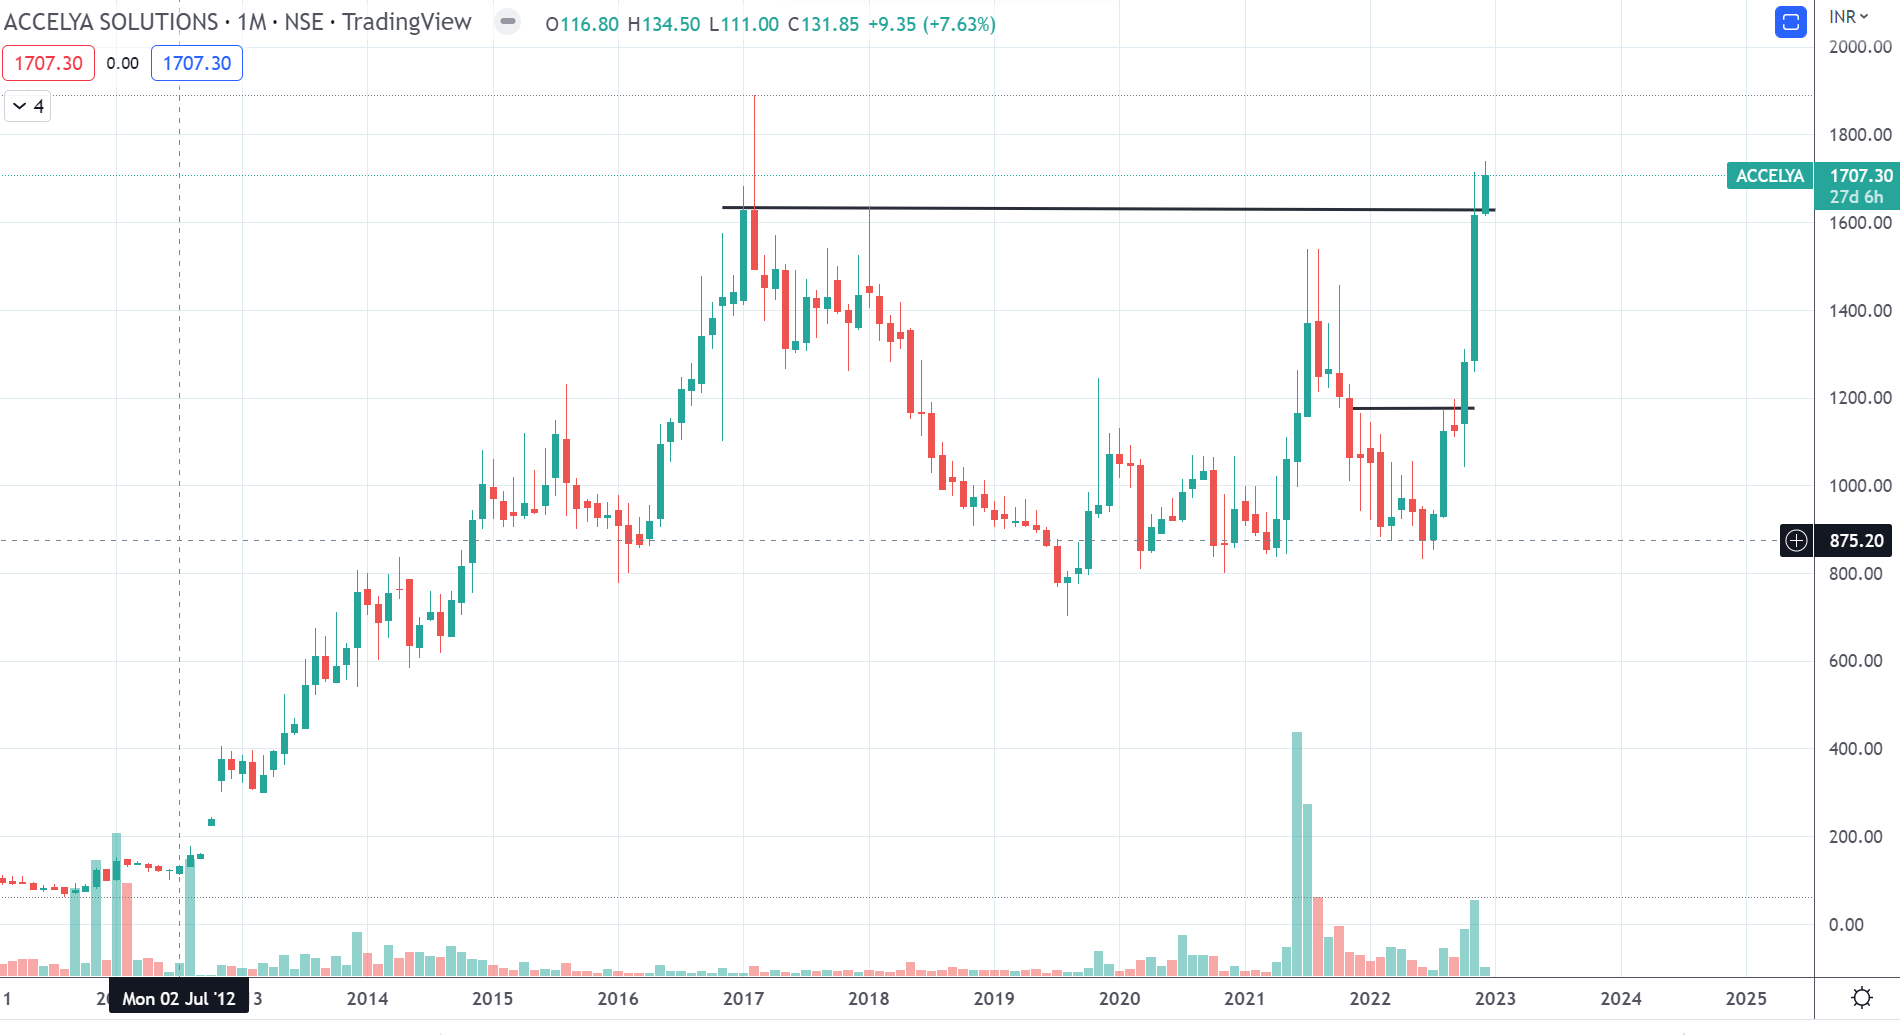
Accelya monthly - Recent Qtrly numbers have been encouraging and closer to past peak profits though global air traffic is yet to reach pre corona levels - it was taken over by renowned PE firm Vista(perennial fund) right b4 corona - Last month major additions in global Sr leadership. market opportunity size has doubled with acquisitions done in 2020. Its products are core to Airlines worldwide both in terms of cost efficiency & revenue management as well as demand side post recent acquisitions.
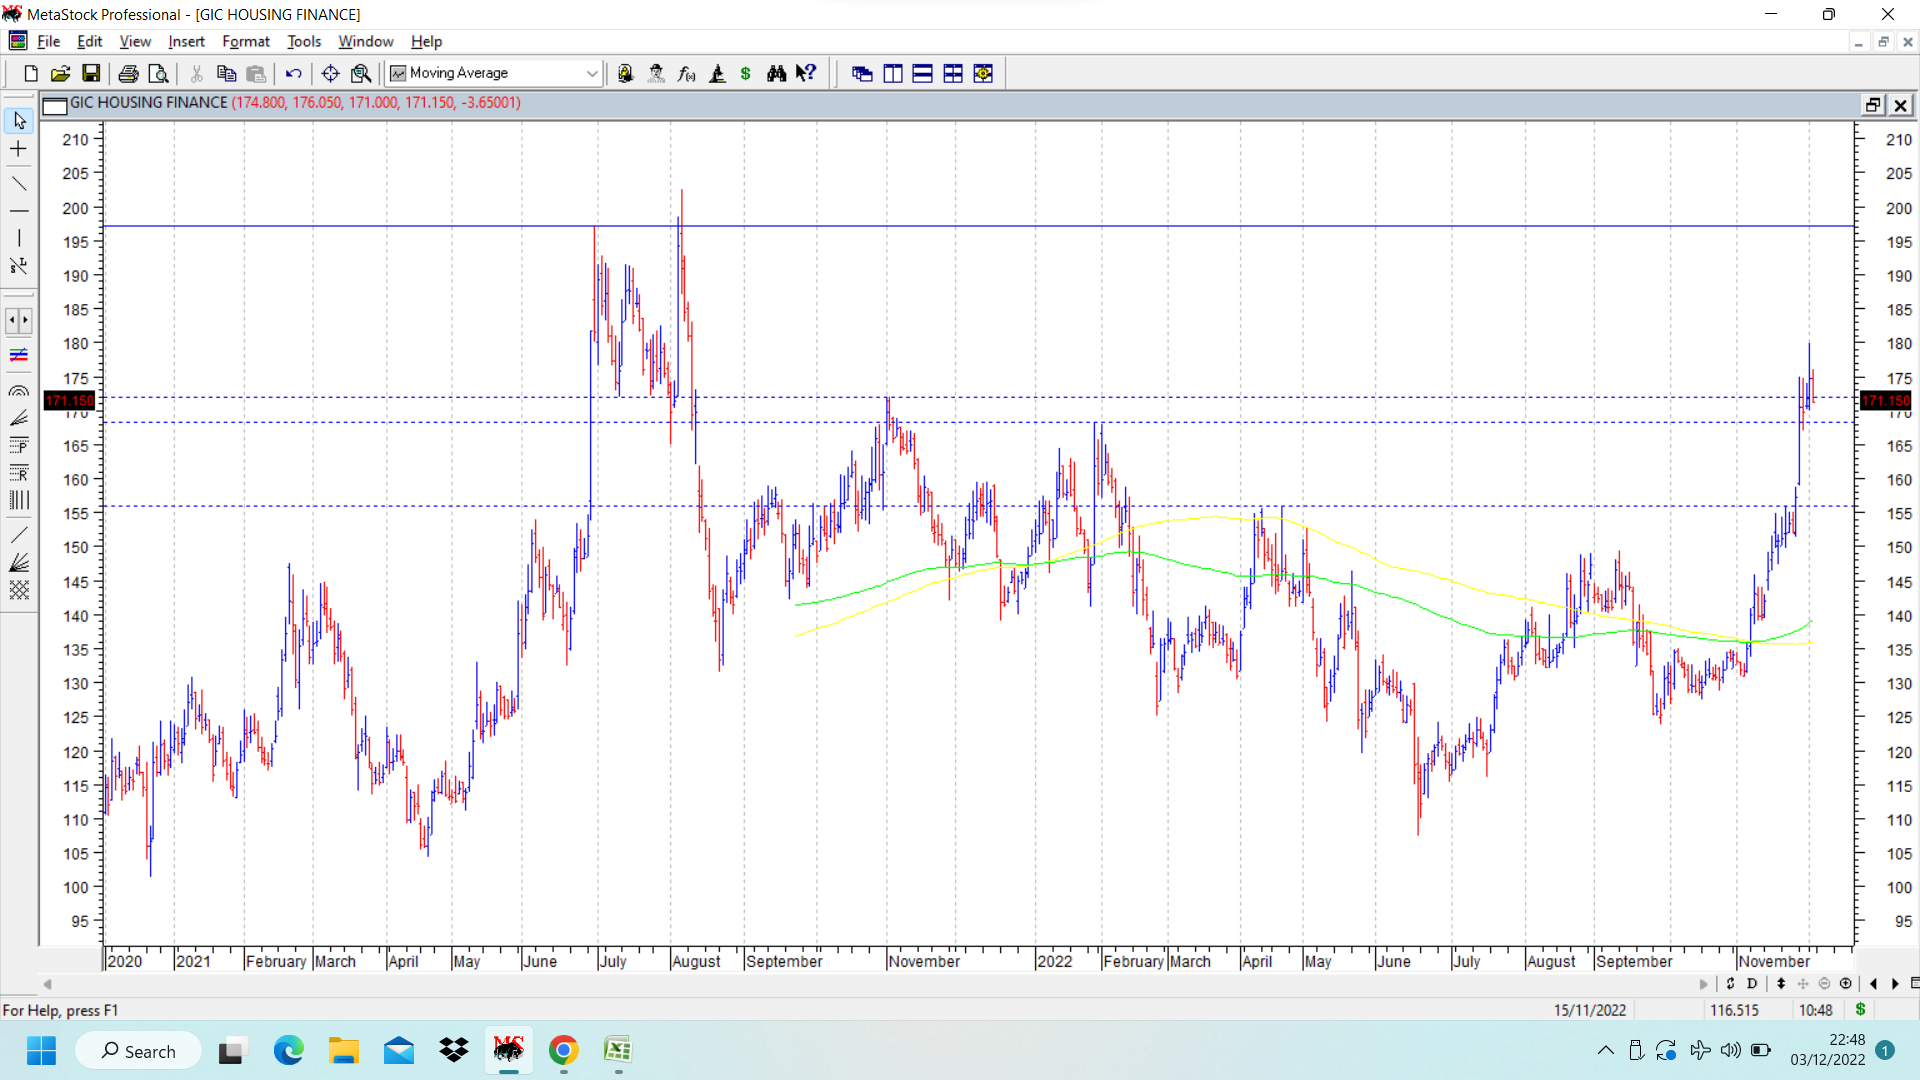
GIC housing chart put up shows the stock price crossing 52 week high at 172 and consolidating at and around that level. Major resistance was at 168-172 which now seems to be seen for support. Before that, level of 156 was another important resistance. Going ahead, the levels of 200-202 is another major resistance. Above that it will be crossing 2 year highs, if it manages to reach there. As of now important resistances and strong congestion zones crossed.
Fundamentally looks cheap. Book value at 294. So at 0.6 times book value. And TTM EPS at 40, so 5 PE… Makes it a good candidate for the catch up theme of this rally where a lot of neglected undervalued plays are giving good returns.