
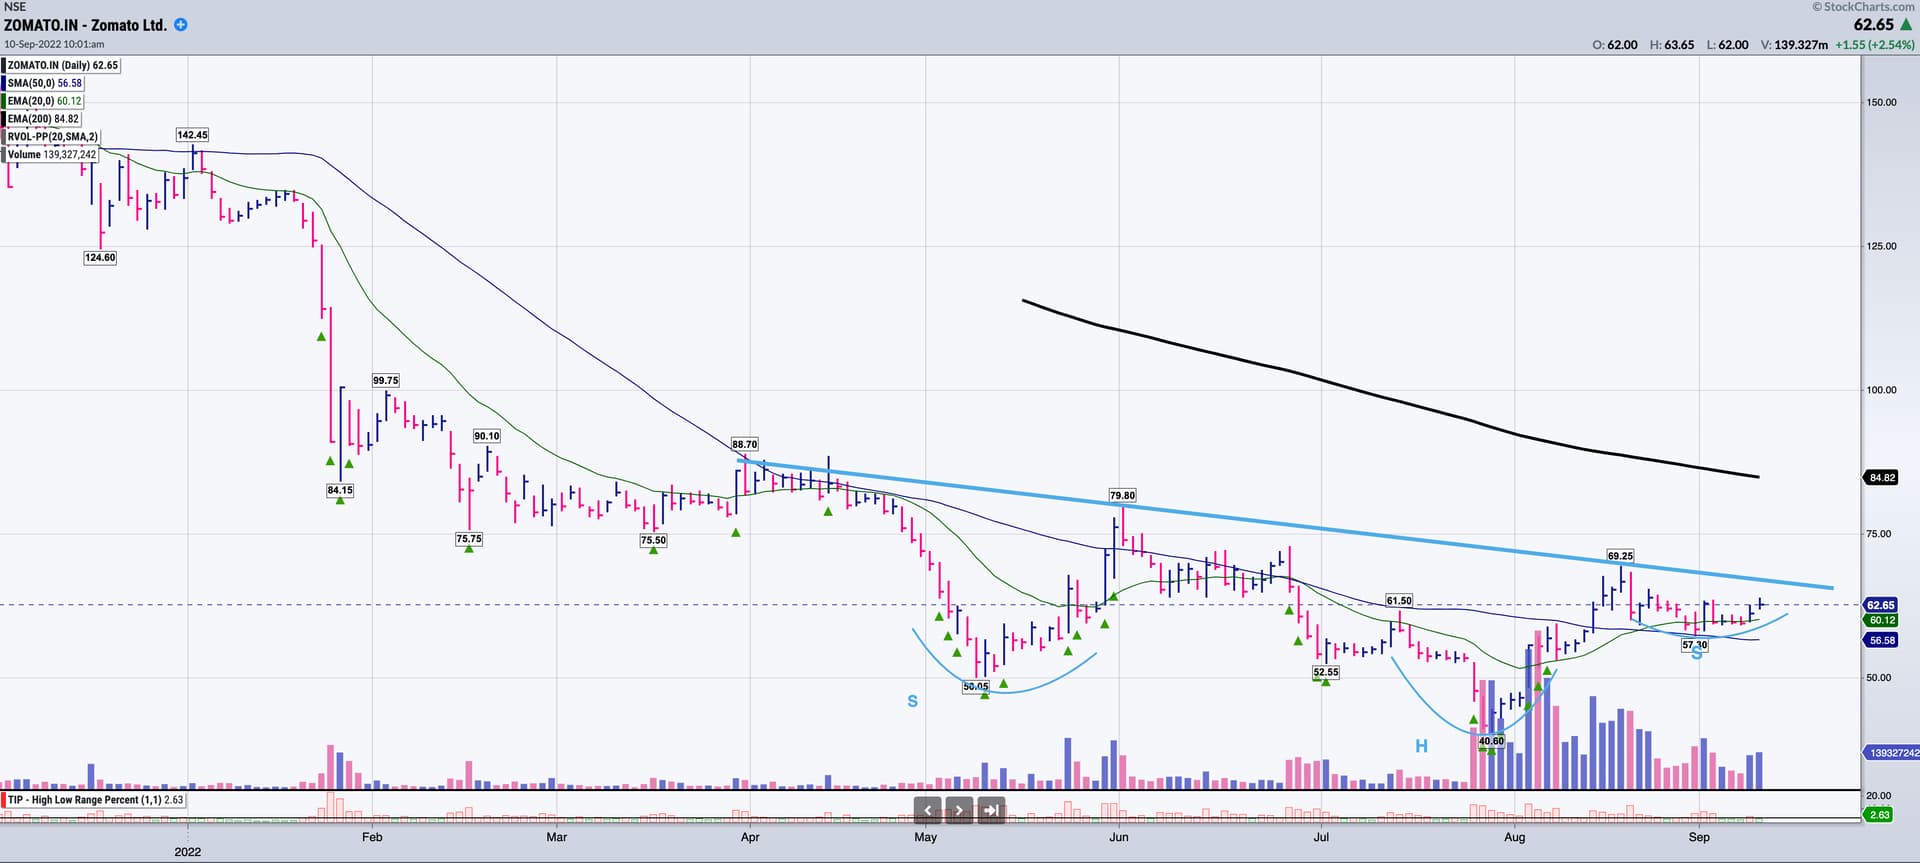
Zomato is forming the Inverse Head and Shoulders pattern which is a reversal pattern.Stock has been in downtrend from 9-10 months.It hit the all time low of 40(block deal news) in august and recovered quickly with good accumulation. Trend can be reversed once it breaks the neckline of 64-66.I have entered around 59 in the anticipation of pattern to play in short time.
1 Like
Unless the entire market falls and stages a V shaped recovery, as it happened in March 2020, you will rarely see stocks sharply rebounding after making a bottom. Usually these stocks will spend a good amount of time forming a base. There is a reason why this thread is about stocks making 52 week high or all time high as these stocks have already been through base formation and are likely to give significant move up in a short amount of time. Another good thing about breakout stocks is that they have well defined risk - you should exit and cut your losses if breakout fails. No such thing in bottom fishing.
8 Likes

Max health, Weekly chart, flag pattern and price near near break out point, price was in range between 410 and 330 for about a year now and this is third attempt to break above 415.,
4 Likes
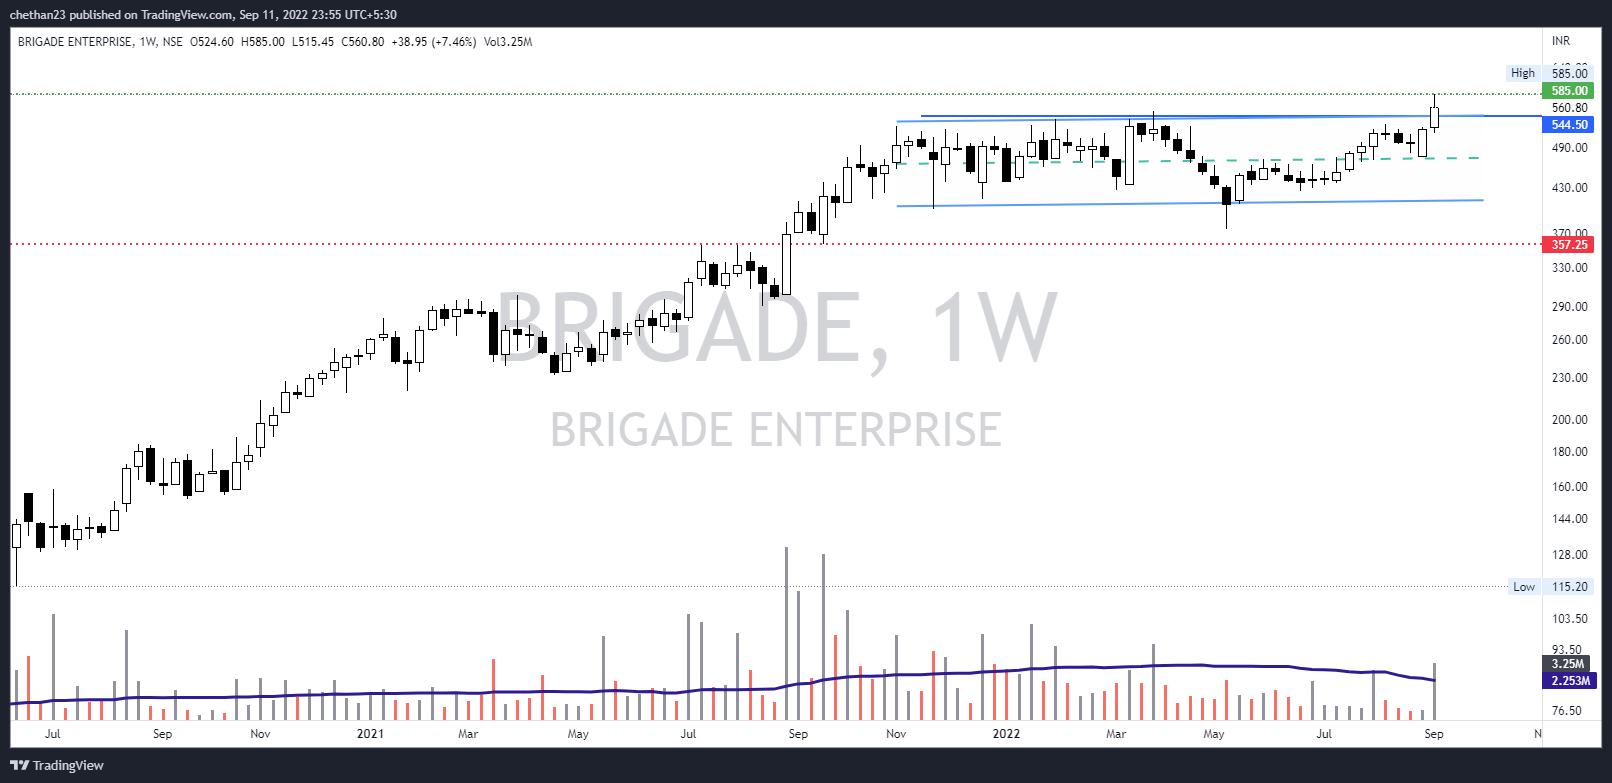
Brigade Enterprises, we can see NSE reality sector is showing some strength off late and Brigade is one of the strongest stock in this sector, price has broken out of 10 month consolidation
1 Like
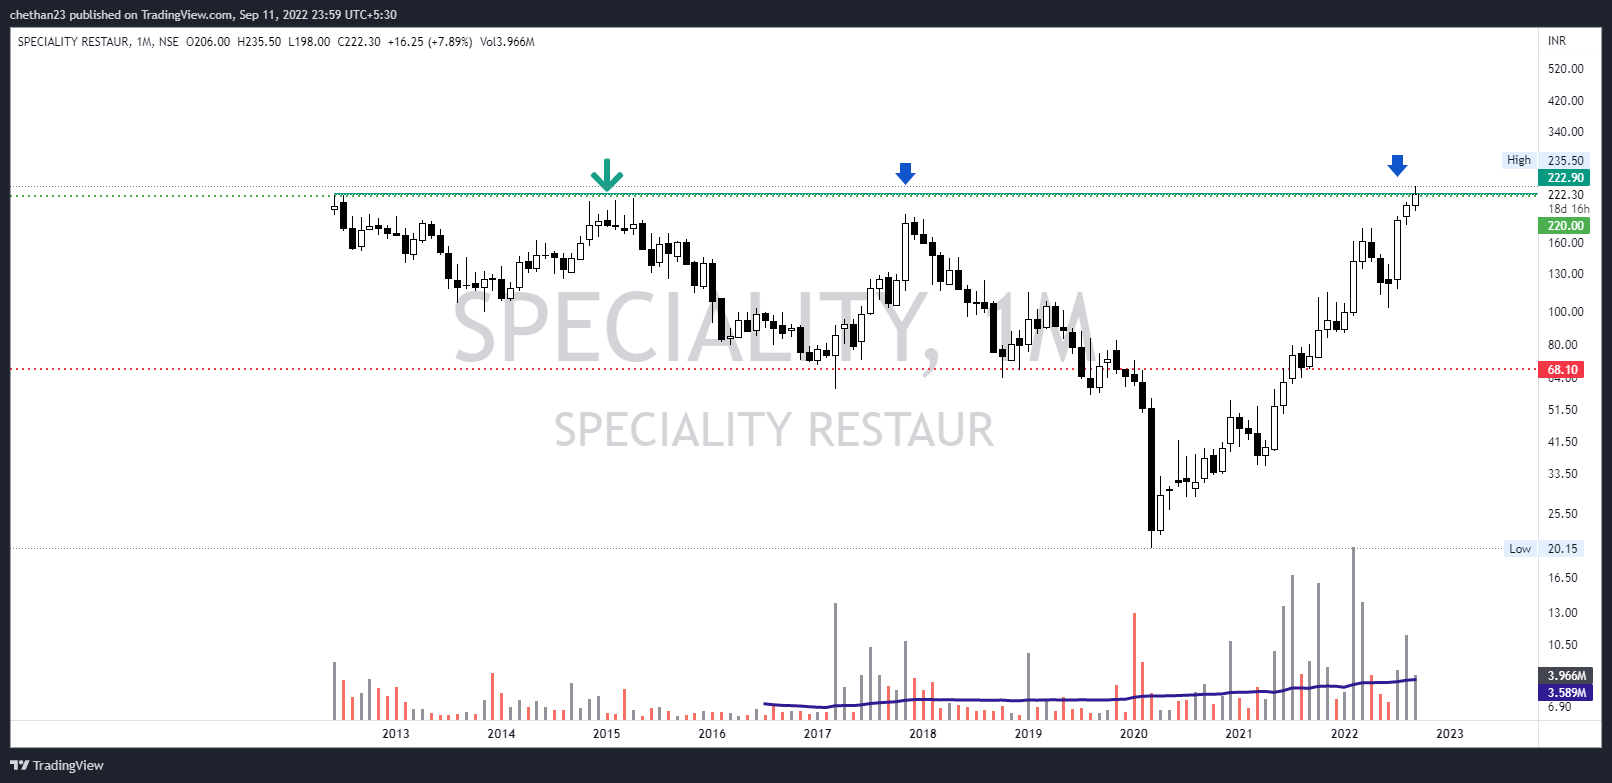
Speciality Restaurant, Monthly chart, price near 10 year break out, earlier it has attempted twice at this price this level, stock had corrected over 90% , from low of March 2020 it has show strength. Volumes are substantial compared to previous year during up move.
2 Likes
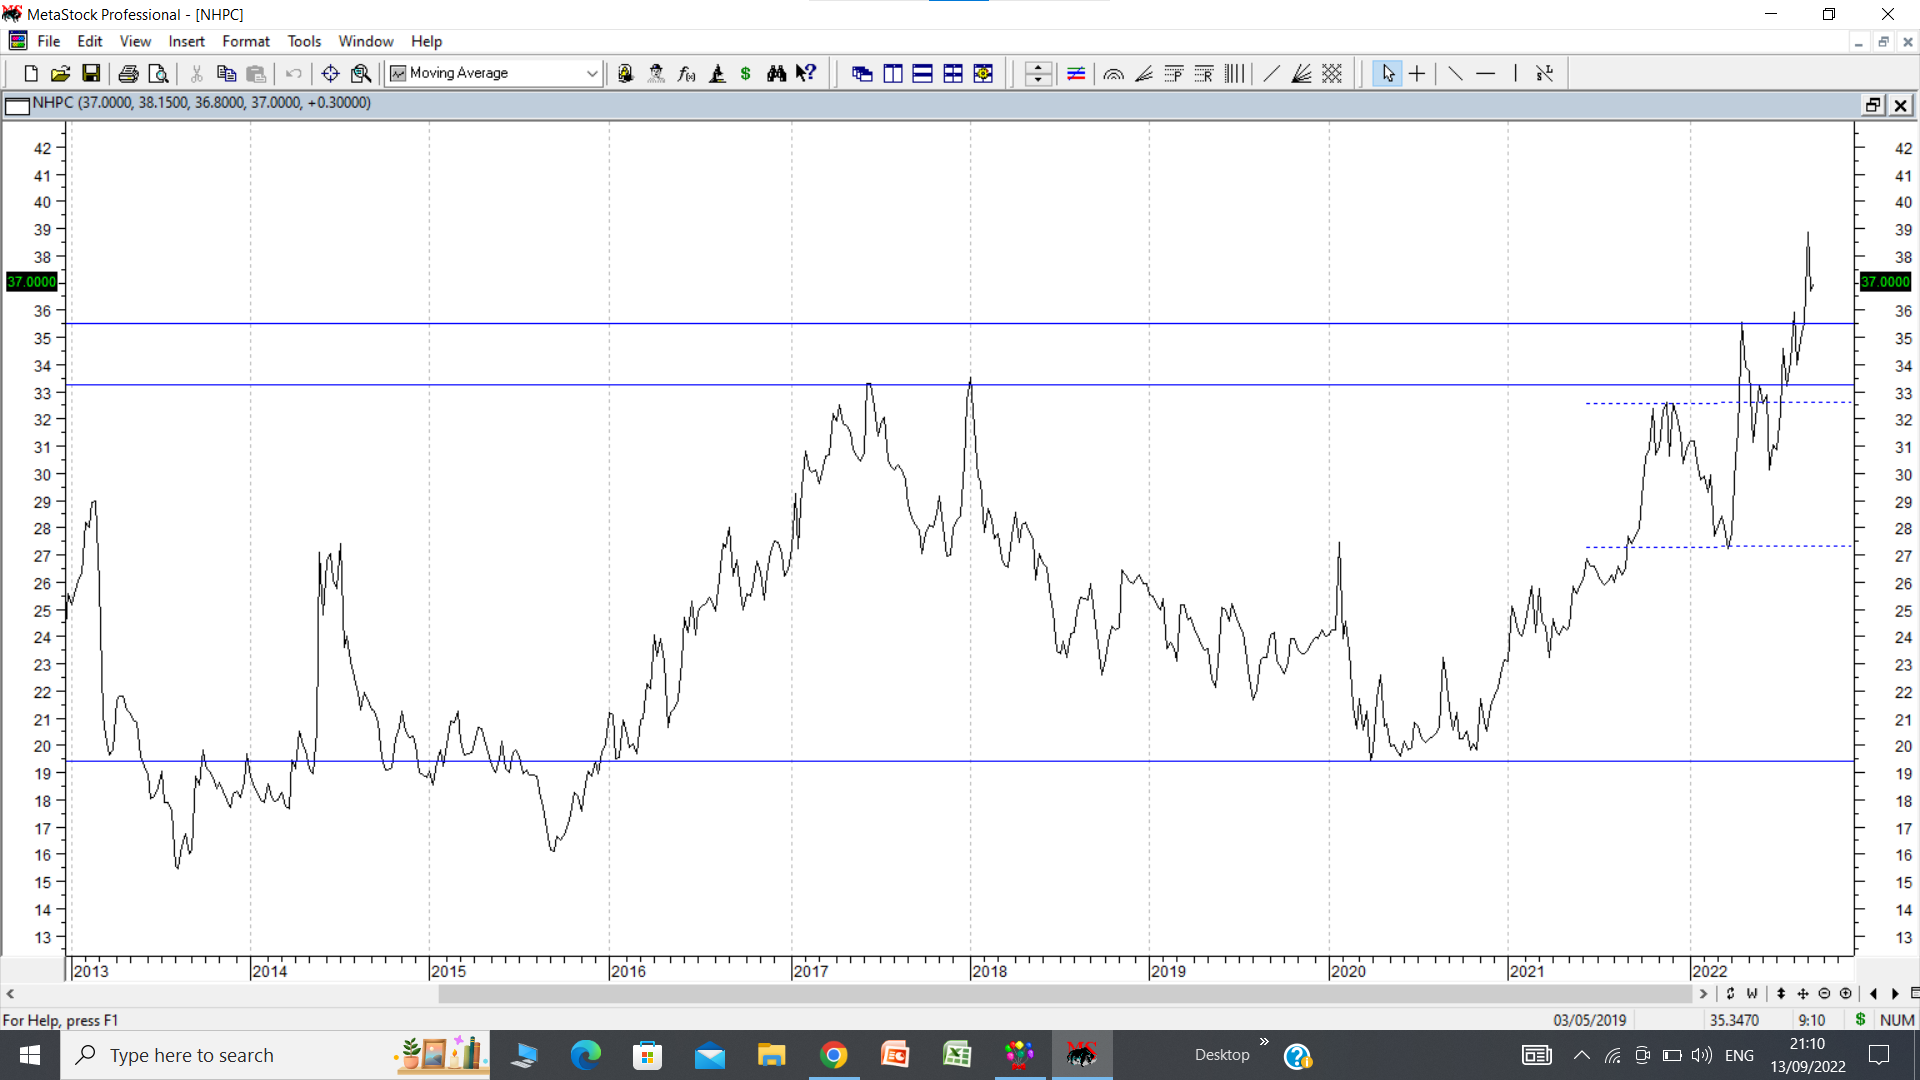
NHPC update. cmp 37 (for ease of viewing patterns described below, line chart has been posted)
Stock price broke out above previous all time high of 36.60 posted back in 2009 and recently went on to post a fresh all time high of 40.40 in August 2022. Since then it has corrected and has been testing the previous ATH region of 36.60 ( plus or minus rupee)
The chart posted below shows very good consolidation between price of 27.50 to 32.50 from August 2021 to April 2022, nearly 8 months (marked in dotted blue lines). In overall medium to long term time frame this zone qualifies as tight consolidation within a 6 rupee price band. Post this consolidation, price went up and hit a high of 37.60 (intraday basis) in April 2022. It again went down and retested the consolidation zone mentioned above to post a higher bottom at 30 and took off to post fresh all time high of 40.40…
The above consolidation of nealry 8 months looks like a good launchpad/springboard for an upward move.
A retest of previous strong resistance often offers good entry point.
The other interesting aspect of this chart is the double bottom formed in 2016 and 2020 at 19.40 levels and intervening peak at 33.50 which was successfully taken out in the recent upmoves. ( marked in solid blue lines) This is a double bottom breakout with potential targets of 47, if pattern plays out.
disc: invested as disclosed before, added more near current levels.
16 Likes
Dear @hitesh2710 Hiteshji,
Techno electric never went past 320 levels and for the last 3 months hovering around 280-310 range like down trending channel. How do you see this when you look at technically.
Are you still tracking it or invested in it ?
Thank you.
KRBL CMP 365…
Nice rounding bottom formation and consolidated for couple of years and rice sector is heating up…Today have breakout with huge volumes…Retest can be very good opportunity to enter. Pakistan floods can work in favour as it is the other major exporter of basmati rice.

1 Like
Even from a fundamental perspective, the Q1 results of Speciality restaurants were very encouraging. They have closed their loss making outlets and converted them into cloud kitchens. Management intends to go slow wrt further expansion. They are unlikely to repeat the mistakes of the past.
If the Q1 performance sustains over the next 3 Qtrs ( Q1 NP was Rs 15 cr ), it may end up with a net profit of Rs 60 cr for FY 23. That sounds like a very good deal for a retail chain trading at a mkt cap of less than 1200 cr.
Just my 2 cents !!!
7 Likes
Thank you Ranvir, for looking from fundamental perspective, I had not looked fundamentals, my logic here was even though stock had corrected 90% but as you to recover this it has to move almost over 1000%and speciality has done that in about 2 yrs suggesting some kind of turn out story and stock strength, as you suggested we need to look at the financial for next quarter. Thank you once again.
Request to exclude other income from NP as it is not sustainable income. Here is the notes from Q1 results:
“Other income during the quarter 30th June, 2022 includes an amount of Rs. 767.60 Lakhs from the Goods and Service Tax Department towards refund of reversal
of Cenvat credit under rule 6(3) of Cenvat Credit Rules, 2004 pertaining to the period April, 2016 to June, 2017”
Excluding other income and 25% tax , PAT would have been between 6-7 cr in Q1.
3 Likes

Fortis Healthcare - CMP 307
It has been trading in range for close to 12 months and firm close above 315 should confirm breakout of range. Recent price action and today’s volume suggests that it should cross hurdle soon.
Fundamentally hospital sector is performing well and same is trending in quarterly results. Fortis has been performing well on operating parameters and holds major stake in diagnostic chain SRL. There has been change in promoter post 2018 and majority held by institutional investors (31.1%). Legal litigation outcome and approval on name change is pending which shall clear dis-association with promoters
2 Likes
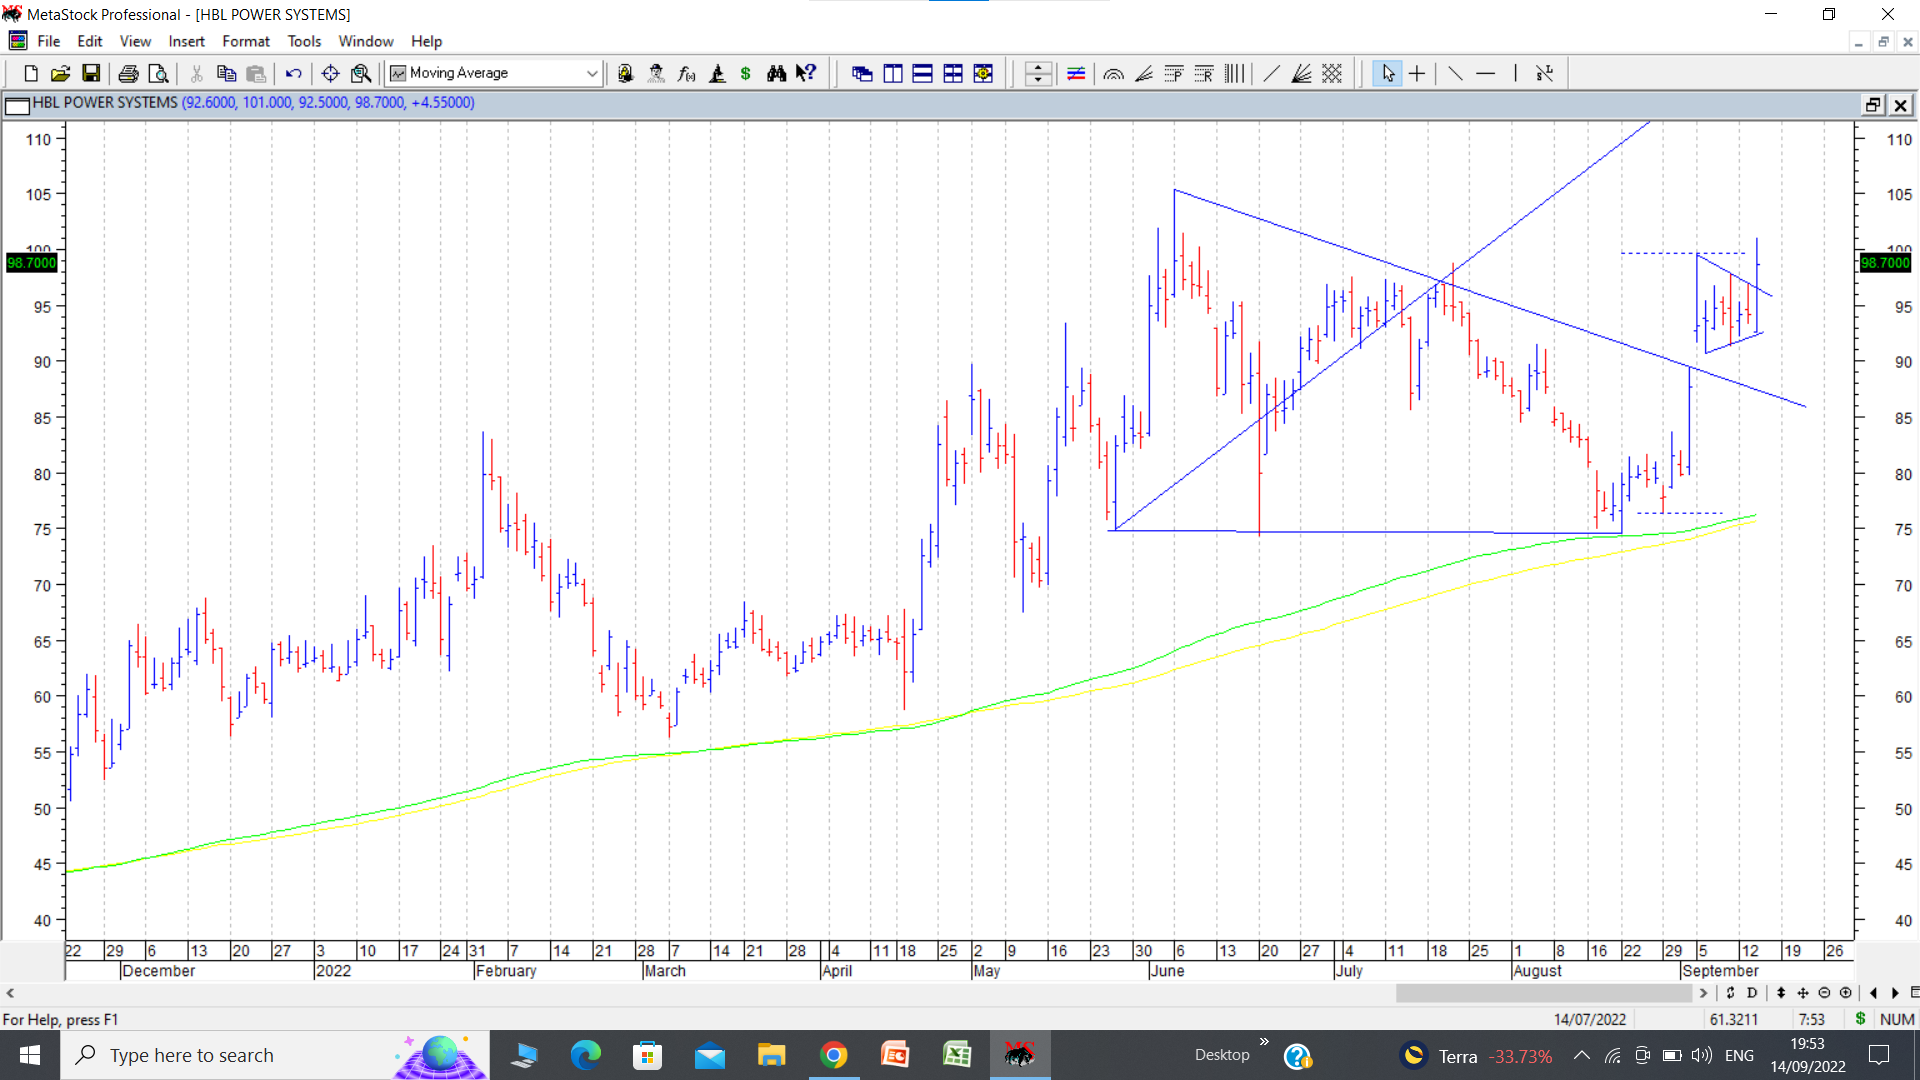
HBL Power today broke out of a small flag pattern. The flagpole extends from 76 to 99, and is marked in dotted lines. Breakout point is 97. Today breakout was accompanied with huge volumes which is a pre requisite for a flag breakout… (A flag is usually a cooling off period wherein after a sharp rise, stock price takes a pause to gather steam for further upmoves. Volumes shrink considerably during flag formation and need to increase comparatively on day of breakout. ) In case of HBL, stock price was suffering a lot of selling pressure after having declined from its swing high (which was a fresh all time high of 105) It took support at its 200 dema (marked in green line) and moved up to face further selling pressure close to 80. But with the news of fresh order wins followed by an annual report where there were bullish tones along with all the details of the business, stock price gapped up on 5 th September with a gap up area between 89.50 and 91.55.
The above mentioned gap also was above breakout from a triangular consolidation, taking the form of a Wolfe Wave.
Taking into consideration the pattern targets of both the Wolfe Wave and the flag breakout, if pattern plays out, targets can be in the range of 120-130. cmp 98-99.
disc: invested as disclosed before on my portfolio thread.
25 Likes
Quick question Dr. Patel… Flag pattern is understood, but how is this fitting into Wolfe wave pattern? I am asking because I could not see the two parellel lines that need to be breached in a Wolfe Wave - if you can please drop a line to explain, that will help me understand this. Thanks in advance.
I do not know what the need for parallel lines are in a Wolfe Wave. Basically WW consists of 5 waves which can be contained within a triangle or a falling channel etc. You should google and read about Wolfe Wave.
5 Likes
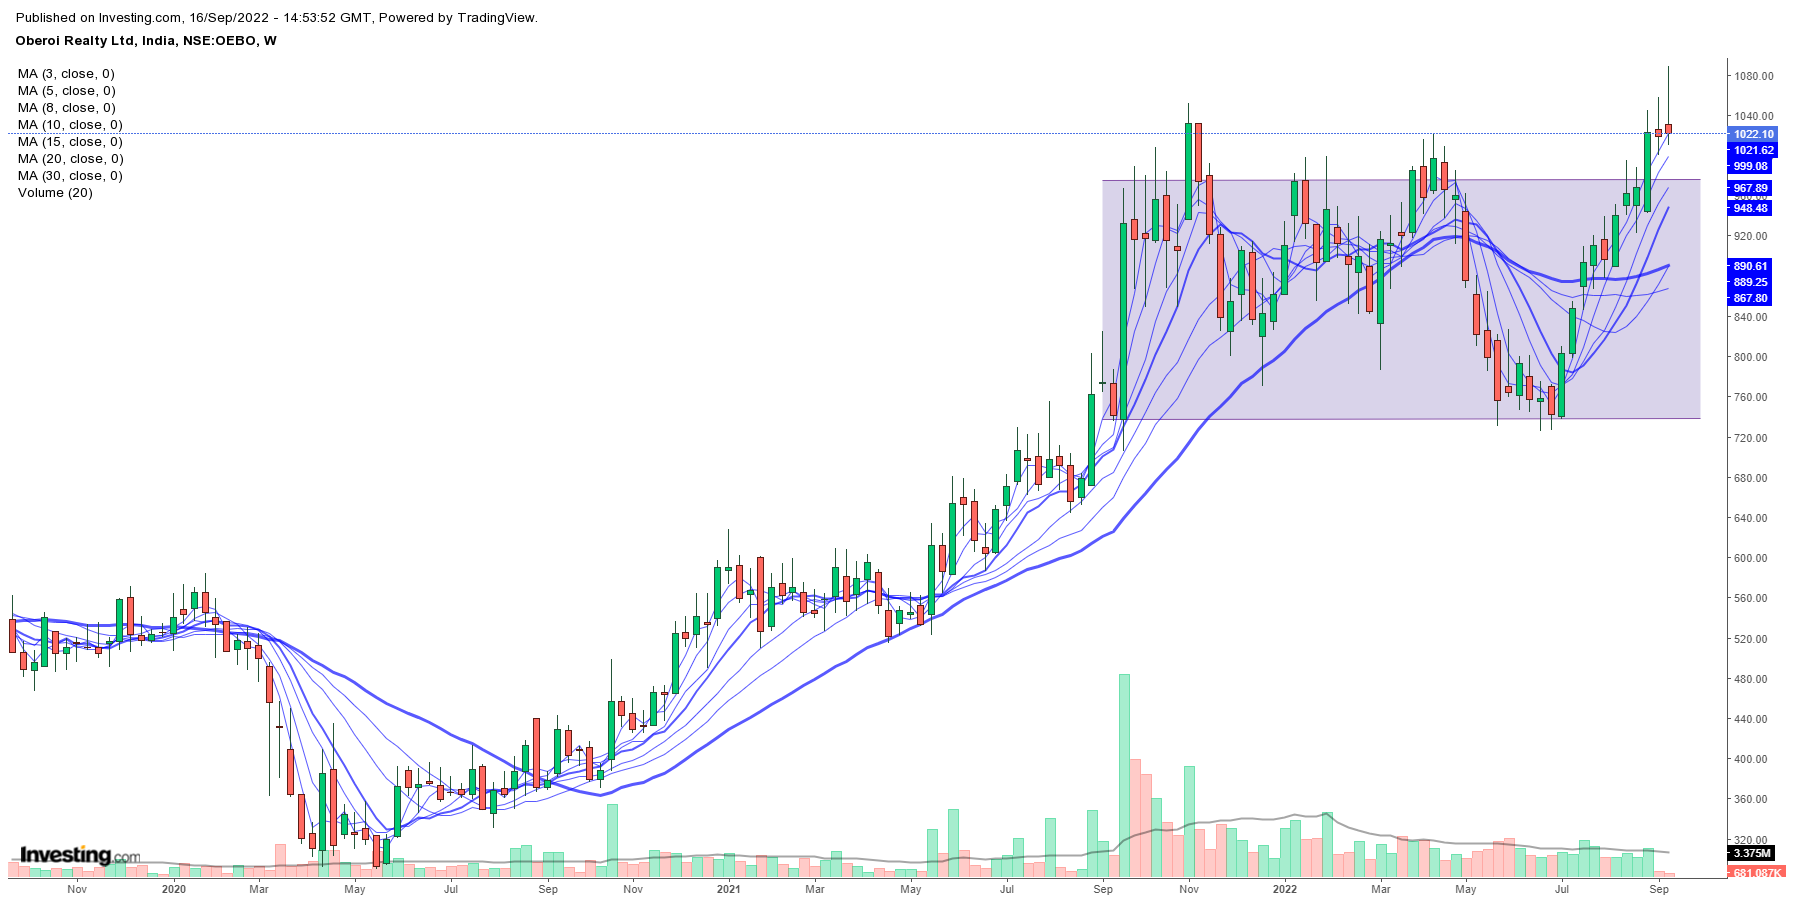
Oberoi Realty Ltd, Weekly | Rationale:
- Established Brand and Reputation | Conservative and independent thinking mindset promoter in the industry full of cowboys
- Sale commencement for Oasis (Worli): Three Sixty West | OC received in Q1 | 129 units with revenue potential of 4000 Cr.
- Upcoming Launches - New towers in existing projects at Goregaon and Borivali; Thane Project (Land Size 60 acres, expected to launch 10msf)
- Anticipated completion of Investment properties in this FY- Commerz -III and Sky City Mall (Borivali)
- Price oscillated in a rectangular band for a year. The closing price of the last 3 weeks sustained above the trading band.
Disc- Invested at the current price based on fundamentals and chart setup
3 Likes
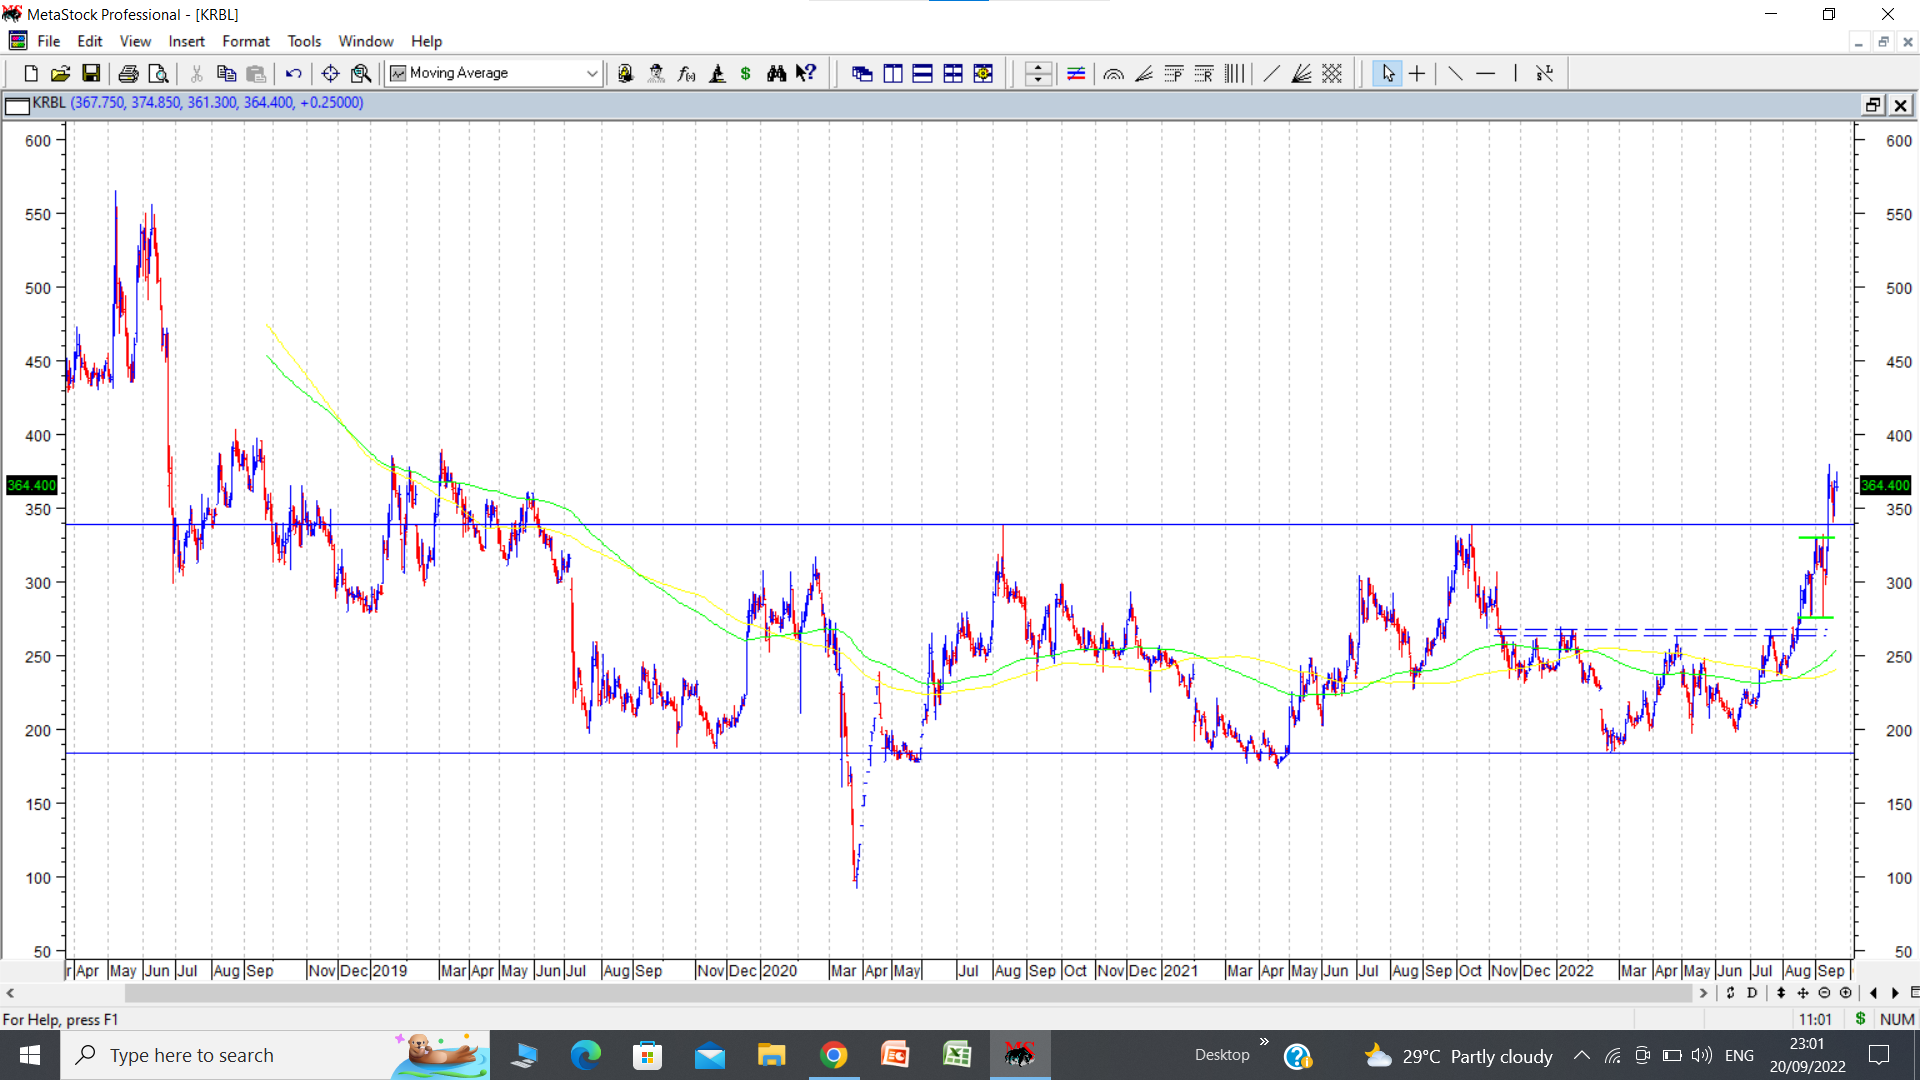
KRBL stock price has crossed an important resistance zone of 340 which was also its 3 year high level. There were strong volumes when stock price crossed this level recently. Posting below the chart of KRBL.
The upper horizontal blue line represents a 3 year high resistance line at 340.
Soild green thick lines represent a double bottom formed (consolidation before attempting 3 year high) between 276 to 330, wherein it spent nearly 17 trading sessions before breakout on the upside.
Two dotted blue lines represent an early stage breakout above strong resistance zone of 263-268, where one could have attempted to pick the stock early.
The range of the horizontal consolidation (barring a short shakeout kind of dip to 92 in the sharp March 2020 correction) was from 180 to 340, which is 160 Rs. Adding this 160 to the breakout level of 340 gives us a working target of 500 which we can keep at the back of our mind.
Fundamentally Pakistan which was a major exporter of basmati rice has suffered severe floods leading to disruption of supply and thus opens up more space for lucrative export markets of middle east and Iran etc for players like KRBL.
disc: invested as a techno funda bet recently post breakout.
35 Likes
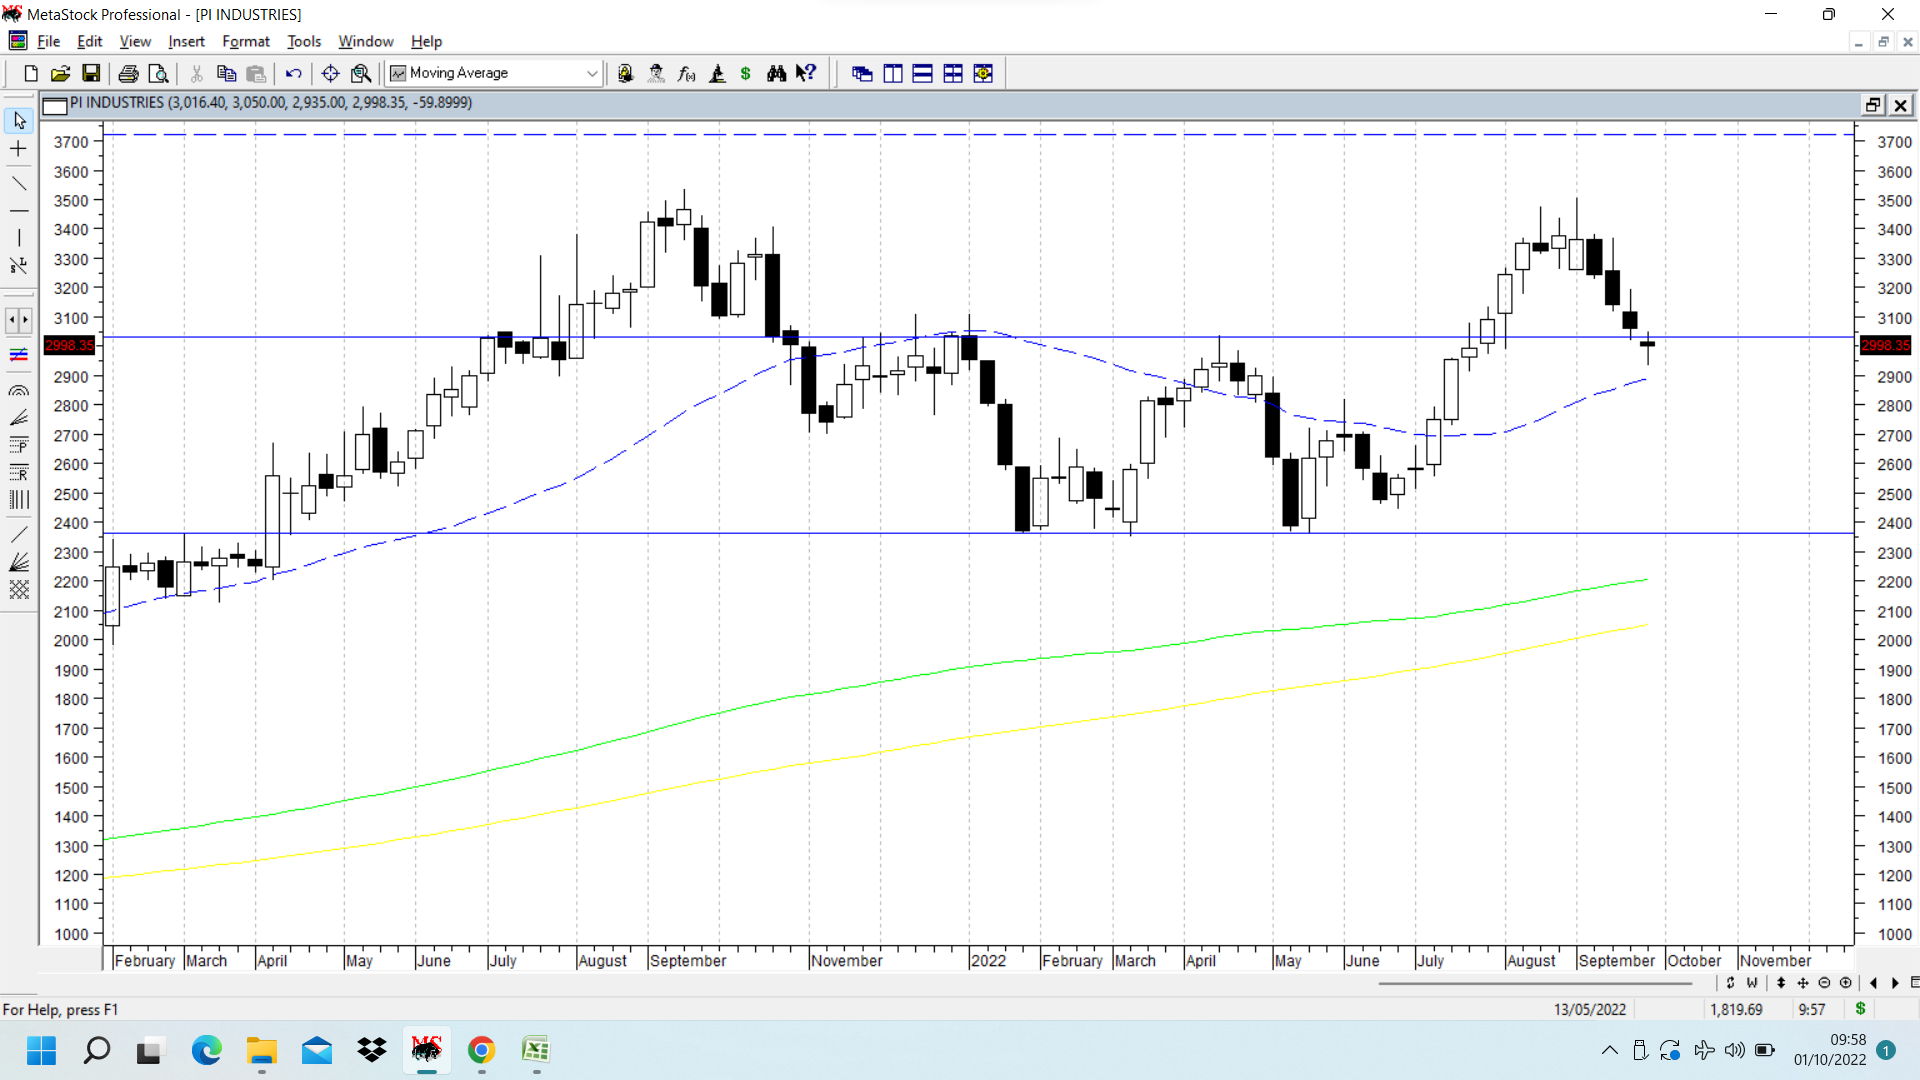
PI Inds is a leader in agrochem space with a proven business model over the years. It has been a big wealth creator in the past. Recently it formed a double bottom pattern at a level of 2350-60 and the intervening peak was at 3035. Stock price broke past that level and went up to post a swing high of 3500 before it started to correct. Currently it is at 3000, having posted a swing low of 2935 this week and the weekly candlestick shows a spinning top candlestick. (small real body with bigger wicks, indicating indecision). This indecision comes after having fallen for 4 weeks and having retraced 50% of its entire previous rally. The fall as of now also seems to have halted above the 30 week moving average on weekly charts, marked by dotted blue lines and which is seen rising, ( or 200 dema on daily charts).
After a breakout from any major pattern, a retest of the breakout zone is a possibility and often gives a chance for those left behind at the time of breakout to take a position, with appropriate stop losses. Here the pattern target is around 3700 (marked in dotted lines), cmp 3000, and a notional stop loss can be kept below recent swing low of 2935, according to one’s own risk profile. disc: no position… Posted only for academic purpose as it looks like a clean double bottom pattern with a retest going on.
22 Likes
Neuland labs was previously covered in another thread when it was undergoing its fall… It achieved its pattern target of 1000 and has been consolidating above that. Now it seems to be forming interesting confluence of patterns as shown in the following daily line chart.
First is obvious double bottom pattern with bottoms near 1000 and intervening peak near 1420. If and when it clears 1420 and pattern confirmation happens, pattern target can be 1800.
Secondly it has broken out of a small cup and handle pattern shown on right side of chart, with breakout above 1265, marked in dotted line. Pattern target for this pattern is 1470, (above the level needed to confirm a double bottom breakout)
Thirdly a symmetrical triangle breakout, marked on the chart, and a retest of both the breakouts, i.e from symmetrical triangle and cup and handle. Friday close was a good close, above 200 dema marked in fluorescent green.
disc: no positions… In watchlist. Posted for academic purpose as I have been following Neuland charts since a long time.

17 Likes
Sir- as per our analysis it is still to come out of woods.
It can be a risky trade but don;t see any structural uptrend.
Short term - 1790 is major resistance. If it crosses that then 61.8% Fibo level is another critical level.
On the other hand if market crashes ( that is what we are expecting) then it can go down very deep.
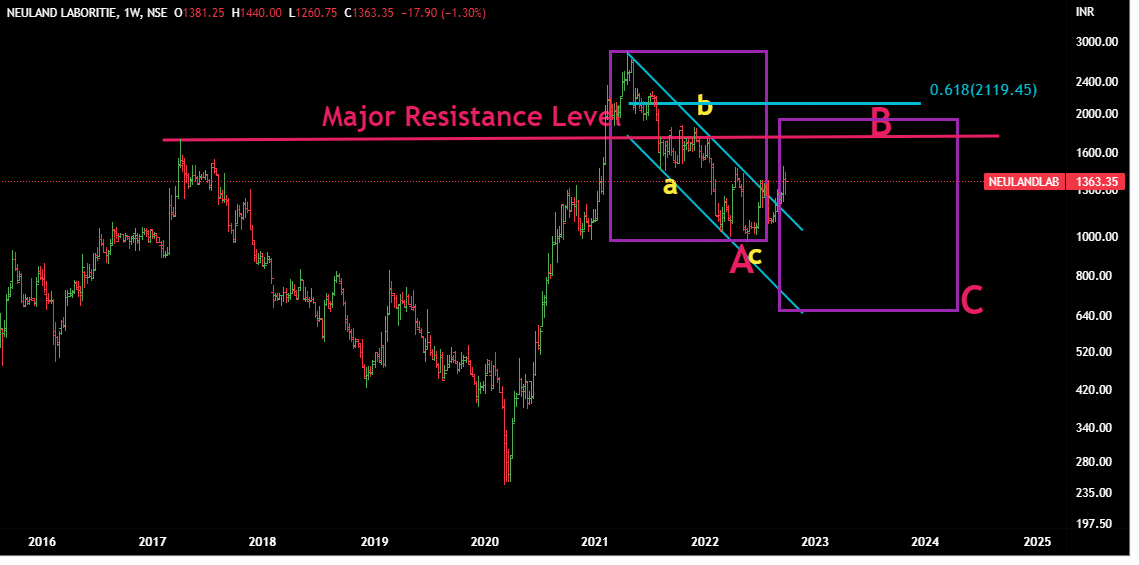
Disclaimer : This is just a probability study. Can go wrong.
2 Likes