
@diffsoft can we expect the sheet for Q2? Many thanks
I hope to publish it today after balance results are out. Note that my figures was at large variance with Bloomberg figures for Nifty EPS last quarter and likely to be at variance with Bloomberg this quarter as well.
I tried to figure out why but even as the raw data was the same (and I had adjusted for some results) I could not get deeper access into detailed computations by Bloomberg for Niifty. With that caveat, I will share it.
2 Likes
Folks,
Attached is the Nifty trailing 12 month PE (weighted) as at November 14, 2018. With the caveat mentioned previously, here are some findings. Nifty PE Q2 FY19 for valuepickr.xlsx (124.8 KB)
-
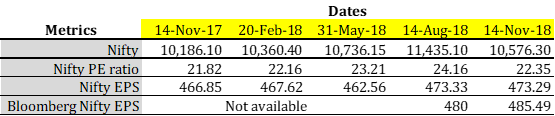
My computation shows TTM Nifty PE at 24.03 on Nov 14, 2018 vs 26.07 3 months ago. Nifty fell by 7.5% even as EPS grew by 1.2%
-
Nifty EPS is at 440.08 end of Sept quarter vs 438.57 end of June quarter as per my computations.
-
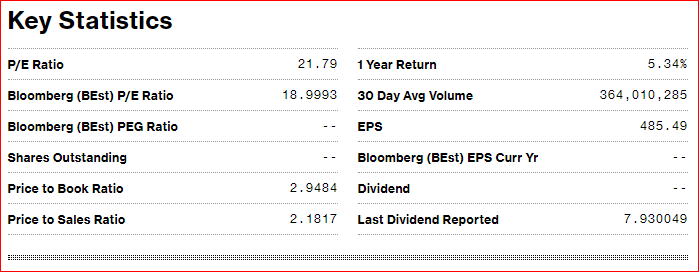
Bloomberg shows a Nifty EPS of 485.49 (up from 480 end of last quarter). So while my EPS continues to vary from Bloomberg’s, the growth in EPS seems to be the same. To repeat, while Bloomberg’s raw data matches mine (except for minor yet necessary manual overrides), their EPS is higher than mine and this is not resolved. A snap of their EPS is shown below, please ignore other figures.
-
Nifty earnings continue to remain tepid, for more than 5 years now, and infact so are corporate earnings as reported by Business Standard a few days ago.
Any help in reconciling Bloomberg figures with mine will be most helpful. There are some hypothesis llike they adjust for exceptional items etc, but that was not enough.
I would be glad to answer any queries on the computation.
18 Likes
Thank you for NIfty PE data. What could be the reasons for variance between corporate earnings and GDP growth over many years? I expected that over long period these should mirror each other
Is it because new series of computing GDP giving higher growth rate than old series ? What percentage of corporate earnings relate to overall GDP ?
Expert views please
1 Like
I have struggled with this as well and have nothing very insightful to answer that specific question. Though the GDP statistic surely exaggerates in the new series, and that has a role to play, it does not explain, in my view, the widening gap.
GDP, which is in effect ‘grossing up’ of all economy activity in a country that leads to products and services in a certain period, is measured in 3 ways, all theoretically adding up to the same number - the Production, Expenditure and Income approach.
The Production approach, which is what is widely relied upon in India measures produce of various industries. The Expenditure approach looks at spends (capital and revenue), is less accurate in India and has an adjusting figure called Discrepancies which now accounts for a large part of the change in GDP on the Expenditure side. The Income approach, which is the sum of all net incomes earned is not used in India. This is where corporate earnings would come in, and when added with all other income should get us the GDP. Now when we compare corporate earnings with GDP we are comparing a ‘population’ measure from Income approach with the statistic derived from a sample that is based on the Production approach. To some degree we are comparing two different things, but not to a great degree.
Incidentally and interestingly, capital gains is not considered in GDP computation because there is no economic activity, say when you buy an already built house from someone else.
What I observed over the years was that because corporate earnings form such a small part of GDP, variations in one may not equally strongly and immediately result in variation in another. Generally the top line of a firm or, better still, top line of an industry may show a stronger relationship than earnings, although earnings is what will add to GDP.
Of most relevance is that very often we are tempted to get carried away by the GDP growth potential and think that our portfolio companies are thus automatically entitled to have great earnings. I have heard this argument from from the first day of my job in Tata Steel in 1991 (per capita steel consumption is just about 40 kg vs ~ 400 odd kg in the US). Fast forward 26 years to 2017 we are still at per capita consumption of 60 kgs and US per capita has peaked and is in decline. Hindsight bias of contemporary successful companies further entrenches this view. It is quite impossible to see HDFC Bank earnings not growing less than 15%, and 15% growth extrapolated to infinity discounted at less than 15% is infinity.
I like to think of GDP as the economic surplus of all entities in a country, corporates being one, and a small one. And in a market economy the biggest appropriator of that potential surplus is the consumer. It is not the corporate. If anything an increasingly competitive & market oriented economy reduces earnings power of a corporate and transfers it to the consumer / customer. And so it has been when you look at numbers of pre and post liberalization of companies that were leaders in their industry then. Thus extrapolation a GDP runway to earnings runway for companies is not so straightforward and could get misleading.
5 Likes
Have you tried weighting the PAT as on beginning of quarter? i.e. in current case using June end weights instead of Oct end?
Since we are speaking of earnings of July to Sep, what is the logic to use the weights at end of Oct?
Ideally shouldn’t it be the weights when we begin? I am not aware of the Bloomberg methodology, but in my opinion, the beginning weights would generate the PAT for the quarter, not current.
2 Likes
Reasons:
- A lot of GDP activities are happening outside listed space today compared to 10 years back. Electronics(Mobiles), Digital(Internet companies), Consumers(Choclates), Autos.
- Profits have been depressed due to heightened competitive intensity and regulatory issues for listed space. That is reflected by modest P/B but high P/E.e.g. Telecom, Corp banks, Engineering goods, Pharma
- A lot of GDP growth is happening in SME sector due to better access to capital. Quoting Aditya Puri "Organised sector growth will be limited globally. I have a different view and I may be wrong. Self-employment has created jobs, which is being ignored. Under Parivartan (an HDFC Bank initiative) we have provided livelihood to 8 million families. GDP is growing not by magic.
Read more at:
//economictimes.indiatimes.com/articleshow/66628947.cms?utm_source=contentofinterest&utm_medium=text&utm_campaign=cppst
I haven’t. Wouldn’t that be EPS of the past Nifty instead of the current? Whenever we look at Nifty PE we would like to know its current valuation and not its past. Current valuation of Nifty would be current PE, which means constituents and their weights at the last possible date, which is the closest past month end. For instance Lupin was present in the June constituent but replaced with JSW Steel end of Sept.
The idea is to get the current valuation of Nifty, which on a PE basis will be current Price divided by current Earnings. Current Price is available on a tic by tic basis, but current Earnings is not available as frequently as Price, so you have to take the most recent Earnings, which is the quarter gone by.
1 Like
Assume a scenario of 2 stocks in Index, A & B
A- Mkt cap 500 earns 25 ending with market cap 525
B- Mkt cap 100 earns 10 ending with market cap 110
Using weights at beginning
(500/600)*25+(100/600)*10=22.5
Using weights at end
(525/635)*25+(110/635)*10=22.4
Which one is correct?
Will you say index has earned 35/600 or 35/635?
The EPS is for a period, it is not for present. The price is present. So current price reflects current valuations. Earnings are TTM (static). So when we calculate weights for earnings, I think we should go for beginning weights.
The change in constituents would be tricky. However the constituents are always fixed for each quarter, so beginning weights could still be obtained.
1 Like
So after @akbarkhan ’s post I relooked at the Nifty methodology and how I calculated PE more carefully. I discovered I made a conceptual error in my computations. This error understates the EPS by 7.5% for the last quarter ended Sept 2018. The gap between Bloomberg EPS and mine have now pretty much narrowed to explainable limits (2.5%) for the last 2 quarters.
I have made a detailed note on the earlier method, where it erred, and the revised (correct) method and its validation. I hope it is easy to understand and does not bore the reader. 19112018 Note on error in Nifty computation and the revised method.pdf (668.9 KB)
I have reworked the Nifty EPS for the last 5 quarters, i.e. from Sept 2017 to Sept 2018 and reworked the computation for Nifty EPS after Q2 results and PE as on 14 Nov 2018.
Reworked Nifty EPS / Nifty PE ratios for the past 5 quarters, on the last day after declaration of quarter results
The detailed revised computation after all results for Q2 FY 19 were declared is attached. Revised Nifty PE Q2 FY19 for valuepickr.xlsx (18.8 KB)
My apologies for circulating the wrong PE / EPS. Thanks to @akbarkhan , @Gaurav_Agarwal and @Yogesh_s who have looked my computation and tried to help me out at different times!!
13 Likes
Hi Krishnaraj, thanks for great contributions
When can we expect new round of EPS?
Today Nifty closed 10746
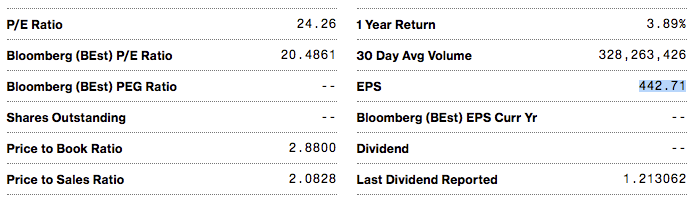
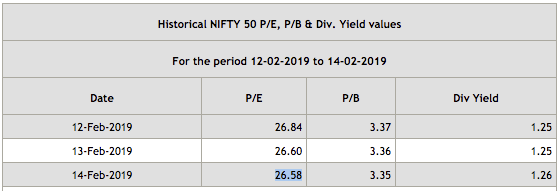
Bloomberg site claims 442 eps which I assume consolidated since nseindia claims 404 EPS, which likely standalone and computed from their 26.58 PE
But your Nov-18 post shows Bloomberg EPS 485.49
Are earnings declining?
Supporting screen pics:
https://www.bloomberg.com/quote/NIFTY:IND
https://nseindia.com/products/content/equities/indices/historical_pepb.htm
Nov-18 post
1 Like
That may be due to Tata Motors.
Hi Amit,
Will post it by tonight.
Warm regards,
1 Like
Folks,
Attached is the Nifty trailing 12 month PE (weighted) as at February 14, 2018. Nifty PE Q3 FY19 for valuepickr.xlsx (27.7 KB)
-
My computation shows TTM Nifty PE at 22.52 on Feb 14, 2019 vs 22.35 3 months ago. Nifty grew by 1.61% and EPS grew by 0.85% during the same period.
-
The year on year numbers look like this:
| 14-Feb-19 | 14-Feb-18 | +/- %age | |
|---|---|---|---|
| Nifty | 10,746.05 | 10,500.90 | 2.30% |
| Nifty PE (TTM) | 22.52 | 22.16 | 1.60% |
| Nifty EPS (TTM) | 477.27 | 467.62 | 2.06% |
- Bloomberg looks like this at the time of posting this:
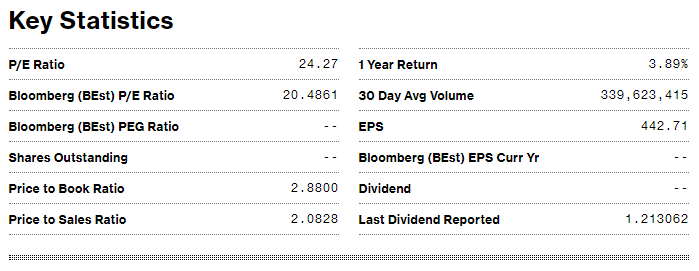
I am not sure why the EPS is lower, possibly ONGC results - declared a few hours ago - may not have been updated and they may have taken only standalone numbers of M&M (requires a manual look-up to do consolidated numbers.
Nifty EPS growth is limping, there is always one fellow or the other pulling it down ![]()
Feel free to ask for clarifications.
Important edit: 23 Feb 2019
I noticed I made a big error in my Nifty computations not placing a decimal correctly in ONGC’s results (made it Rs 826,200 million instead of Rs 82,627 million). You may see it in my previous Excel. I regret this goof-up, no excuses. Thank you also to folks who trust, use it and question it, this pushes me to make it more robust,over time.
So, here is the corrected version - Nifty PE Q3 FY19 for valuepickr_corrected.xlsx (27.7 KB)
This brings down the Nifty EPS closer Bloomberg’s estimate earlier, but now lower than Bloomberg by 2.3% at 432.72 (Bloomberg’s is 442.71) and makes the Feb 14, 2019 PE at 24.83 (Bloomberg 24.27). My earlier EPS estimates were 477.27 and consequently PE at 22.52.
Thank you!
10 Likes
Thank you @diffsoft Krishnaraj for calculating and posting this every quarter. Do you compute/know a source of P/E ratio of BSE Midcap or Smallcap Index ?
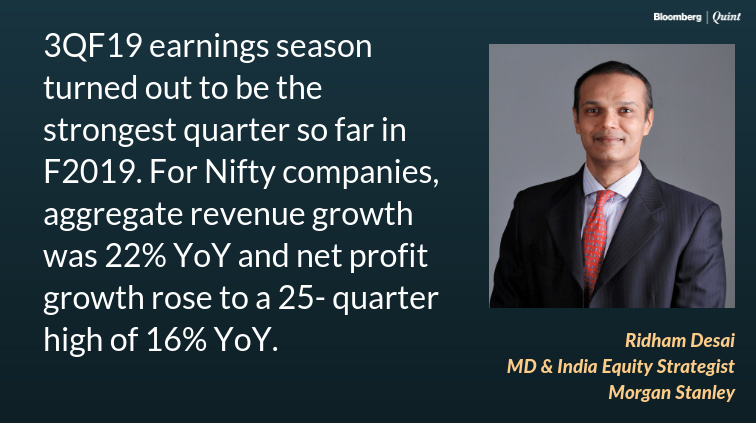
He has the worst record for “stargazing”. He is a perfect TV talking head. All talk and no value of a single word.
(Jan 2016) Earnings to recover in 4-5 quarters: https://www.msn.com/en-xl/asia/videos/india-inc-earnings-to-recover-in-4-5-quarters-ridham-desai/vi-BBoM04n
(June 2017) Earnings could compound at 20% every year: https://economictimes.indiatimes.com/et-now/experts/earnings-could-compound-at-20-every-year-ridham-desai/videoshow/59033531.cms
I could post more of what he speaks but it’s equal trash. If. there is one person we can safely ignore listening to its RDX.
8 Likes
You said it right!
He talks like an astrologer:
- Just like an astrologer he knows what people want to hear
- Just like an astrologer he uses phrases which play both sides of the story (viz. you enjoy a evening get together AND a walk on the beach)
- Just like an astrologer he keeps his predictions vague
- Just like an astrologer he talks about the past as if he had predicted them
- Just like an astrologer he will shy away from predicting anything in near future (i.e. next week or month). He will only talk about 3 to 5 qtrs minimum.
To be fair to him, most people in markets are like him. His job is to paint the future rosy and keep the morale high so that fresh money keeps coming in the market.
2 Likes
I have pasted yoy earnings of each Nifty constituent below with total.
| All figures in ₹ million except PE ratio | ||
|---|---|---|
| Stocks | PAT for 3 months ended 30 Dec 2017 | PAT for 3 months ended 31 Dec 2018 |
| Adani Ports & Special Economic Zone Ltd. | 9,941 | 14,086 |
| Asian Paints Ltd. | 5,546 | 6,356 |
| Axis Bank Ltd. | 7,264 | 16,809 |
| Bajaj Auto Ltd. | 10,132 | 12,208 |
| Bajaj Finance Ltd. | 6,900 | 10,596 |
| Bajaj Finserv Ltd. | 7,305 | 8,505 |
| Bharat Petroleum Corpn. Ltd. | 21,437 | 4,951 |
| Bharti Airtel Ltd. | 3,058 | 862 |
| Bharti Infratel Ltd. | 5,854 | 6,484 |
| Cipla Ltd. | 4,005 | 3,322 |
| Coal India Ltd. | 30,426 | 45,667 |
| Dr. Reddy’S Laboratories Ltd. | 3,027 | 5,003 |
| Eicher Motors Ltd. | 5,205 | 5,330 |
| G A I L (India) Ltd. | 12,622 | 16,812 |
| Grasim Industries Ltd. | 5,432 | 9,579 |
| H C L Technologies Ltd. | 20,750 | 26,050 |
| H D F C Bank Ltd. | 46,426 | 55,859 |
| Hero Motocorp Ltd. | 8,054 | 7,691 |
| Hindalco Industries Ltd. | 3,771 | 2,475 |
| Hindustan Petroleum Corpn. Ltd. | 19,497 | 2,476 |
| Hindustan Unilever Ltd. | 13,260 | 14,440 |
| Housing Development Finance Corpn. Ltd. | 66,815 | 21,138 |
| I C I C I Bank Ltd. | 18,942 | 18,740 |
| I T C Ltd. | 30,902 | 32,091 |
| Indiabulls Housing Finance Ltd. | 11,423 | 9,855 |
| Indian Oil Corpn. Ltd. | 82,875 | 9,648 |
| Indusind Bank Ltd. | 9,363 | 9,850 |
| Infosys Ltd. | 51,290 | 36,090 |
| J S W Steel Ltd. | 17,530 | 16,240 |
| Kotak Mahindra Bank Ltd. | 16,242 | 18,440 |
| Larsen & Toubro Ltd. | 14,900 | 20,416 |
| Mahindra & Mahindra Ltd. | 36,280 | 13,660 |
| Maruti Suzuki India Ltd. | 17,990 | 14,893 |
| N T P C Ltd. | 23,608 | 23,854 |
| Oil & Natural Gas Corpn. Ltd. | 50,147 | 82,627 |
| Power Grid Corpn. Of India Ltd. | 20,408 | 23,312 |
| Reliance Industries Ltd. | 94,200 | 102,510 |
| State Bank Of India | (18,866) | 47,092 |
| Sun Pharmaceutical Inds. Ltd. | 3,216 | 12,419 |
| Tata Consultancy Services Ltd. | 65,310 | 81,050 |
| Tata Motors Ltd. | 11,986 | (269,925) |
| Tata Steel Ltd. | 12,864 | 22,860 |
| Tech Mahindra Ltd. | 9,431 | 12,029 |
| Titan Company Ltd. | 2,880 | 4,132 |
| U P L Ltd. | 5,740 | 4,610 |
| Ultratech Cement Ltd. | 4,563 | 3,937 |
| Vedanta Ltd. | 19,940 | 15,740 |
| Wipro Ltd. | 19,371 | 25,103 |
| Yes Bank Ltd. | 10,769 | 10,019 |
| Zee Entertainment Enterprises Ltd. | 3,743 | 5,624 |
| Total | 963,774 | 703,610 |
| Unweighted PAT growth (y-o-y) | -27.0% |
Thanks James, no I don’t. But if someone can supply the constituents and any free float factor, should be doable.
@investr and @valuestudent I admire his ability to be consistent in his ‘forecast’ (which to the clan means licence to deceive), even when he knows that his track record (and Morgan Stanley’s) is worse than that of a dart throwing rhesus macaque. I wish I had their ability to manage cognitive dissonance that arises whenever you know you are faking it. Also never to forget Morgan Stanley’s fund foray in India (1994?) was such a disaster that it likely was the longest quoting equity NAV that never touched even high single digit.
4 Likes