Please find attached the Nifty PE based on trailing earnings at March 31, 2016 and Market Cap as on May 31, 2016. Also computed is Nifty stock wise PE.
I find that most sites give these figures incorrectly because they either do not weight Nifty or they take only standalone numbers, and so forth. So as I prepare for my own reference, I wanted to share it with members.
Clarifications welcome.
@mods - I could not find any related topic / thread to post this; and I intend to keep updating it every quarter.
@Gaurav_Agarwal That is because the NSE site takes standalone results for PE computation. As a result earnings from the subsidiary of a company is not taken into account. So for instance a subsidiary of Infosys Ltd will not be taken in earnings of Infosys, when it should be. I had written about it here A company should be known by the companies it keeps
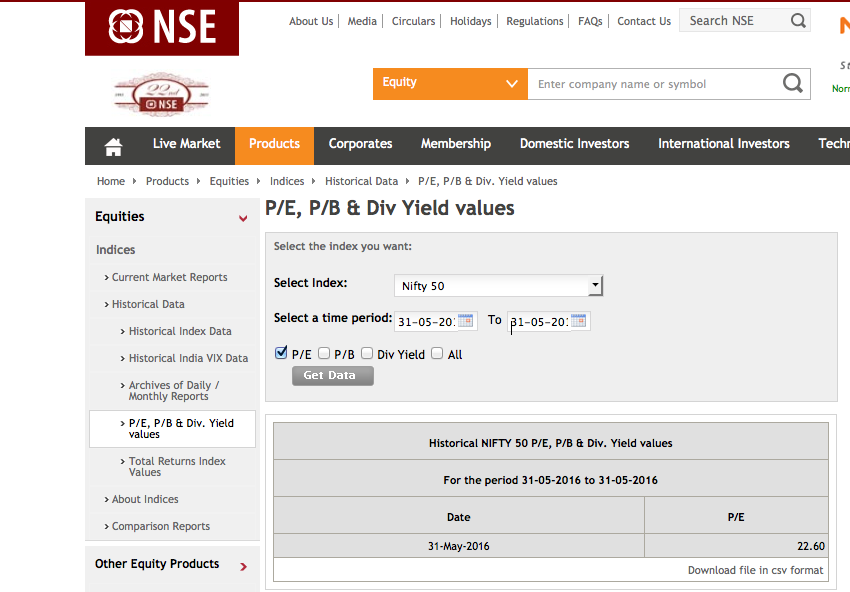
When you take the consolidated earnings the earning go up as most of the subsidiaries make a profit, consequently the PE comes down. In this case the PE is down from about 22.6 to about 19.8.
Thanks a lot for sharing this Krishnaraj - really useful.
Couple of questions -
a) I don’t seem to understand the concept of weights - are they fixed or keep changing real time based on the M.Cap of the companies? If they’re fixed - what is the criteria, when are they fixed and how frequently are they reviewed?
b) The P/E calculated in the sheet doesn’t have the formula in the cell - can you share that as well?
They keep changing based as MCap changes but these changes are induced by IISL and not by the market. You may find some more here Index concepts from NSE site but it does not contain all. You can download the weights from there - Index weights, select the appropirate option from the drop down box. The best way I have understood them is to imagine you have one stock of each constituent, which is weighted by the weights, this gives you a figure. This figure is now multipled by a constant - not known or shared, that gives the Nifty. So if the stock falls by x% the index will fall proportionate to its weight but the weight itself will not change.
NSE website says that IISL (a sister company tasked with such indices) reviews it twice a year. That is what I have seen but in certain cases it is changed even in between. The one example is when Satyam, a part of Nifty, collapsed after the MD declared he committed fraud. Changes in India have been quite frequent like 4 - 5 firms every year, whereas the Dow has changed only 51 times since 1896!
It is cell H56 / G56. I copied some of these as values instead of formulae which is why you see it as values (I will retain it henceforth)
This would be one of the most useful thread for me. Great job Krishnaraj
Hope you keep updating it. Although, I should learn to do it myself very soon given the above information.
Tracking Nifty P/E, P/B and Dividend yield is something very important to me in order to manage cash.
I think this thread should come under the tag of “investor toolkits”.
Nifty PE is at 20.1 as of yesterday which increased from 19.8 in May 31 even as trailing 12 month earnings fell by 2.7% from March 31, 2016.
At the risk of repeating myself, most sites report the Nifty PE from the NSE website, which is erroneous as it does not take consolidated profits into account while computing earnings.
Great efforts Krishnaraj. Is historical data available for nifty PE with consolidated earnings? It will be useful to compare it like Nifty PE crosses 24|A statistically informed entry-exit model! Would like to see if it differs from the chart of standalone nifty PE.
The source from where you got the data gives results only for standalone figures whereas to get the true economic performance you need consolidated figures. Almost all non Govt owned firms have multiple entities owned by the parent company and these entities generate material profits. They need to be taken into account while computing profits for the company; i.e. we need to take consolidated figures.
Consequently consolidated PE will be lower than standalone PE. In fact consolidated PE is 20.09 (the excel attached) against standalone shown as 23.89 as on 12 Sept from the above source.
So I finally got time to calculate the weighted consolidated nifty PE on my own and the number that I get is very close to the NIFTY PE published by NSE India.
Can you please tell me how did you get the figure of 20.09?
I quickly ran through your numbers. There are differences in (a) Consol PE for many stocks and (b) there are 51 stocks in Nifty because of Tata Motors DVR anf Tata Motors, whose PE is different because their prices are different.
You may compare it with the excel spreadsheet I attached in my computation.