VK Portfolio Learnings
- The strategy for Portfolio is very important. But more important is the management of Portfolio on a periodic basis.
- I learned over a long investing period that one of the fundamentals of Portfolio construct is Asset Allocation between Debt and Equities.
- Another key thing to a portfolio management is the timing of the market not in exactness but in approximation.
- Lastly collecting data for the portfolio performance on a daily basis and analyzing it on a quarterly, half-yearly and yearly basis is sine qua non for understanding the strength and weakness of one’s portfolio which will help in decision making for better results.
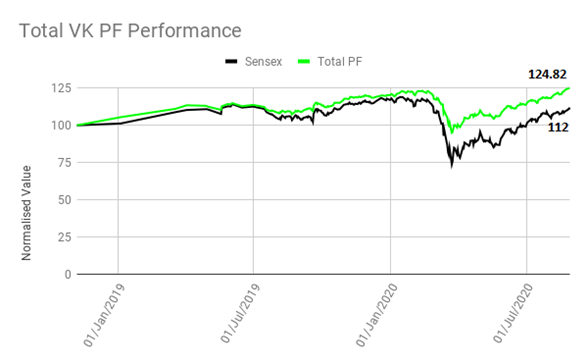
- I prefer target Asset Allocation as Equity : Debt = 60% :40%. But the wild market fluctuations keep moving the asset allocation and hence the swing in portfolio performance. Here is the graph of my Portfolio Performance I started monitoring on a daily basis since Nov’2018.
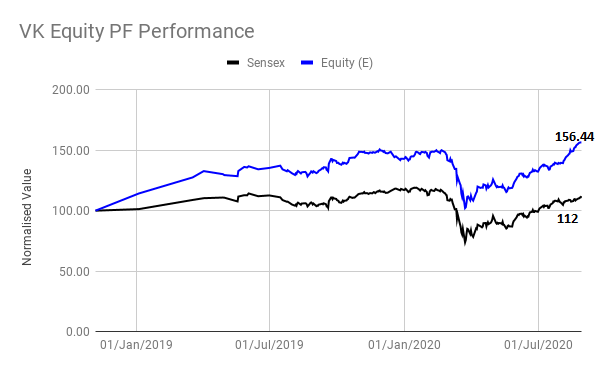
Equity Performance:
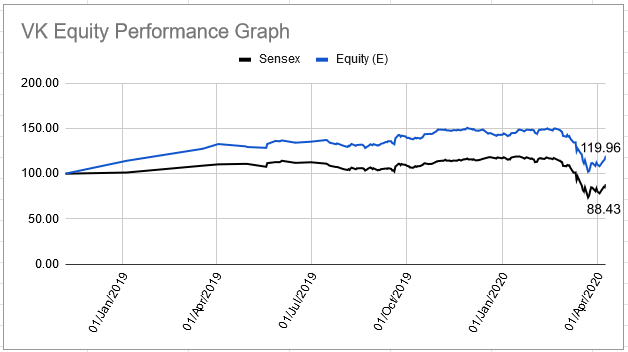
The link to the graph is as follows: https://docs.google.com/spreadsheets/d/13FQsZ2eaV0EF3tAgE3Wk5MQip47MstaKf9HNe8WSu9U/edit?usp=sharing
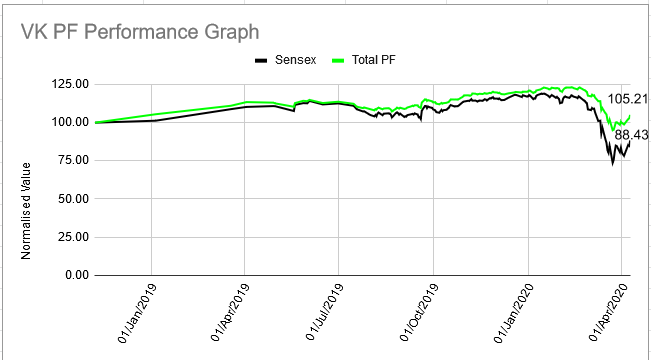
The key statistics of portfolio is:
| Date |
Sensex Close |
Sensex |
Total PF |
| Upside |
PV - MIN |
14.69 |
10.18 |
| Drawdown |
MAX - PV |
30.63 |
18.01 |
| Range |
MAX - MIN |
45.32 |
28.20 |
| 09/Apr/2020 |
31159 |
88.43 |
105.21 |
| MAX |
41952 |
119.06 |
123.22 |
| MIN |
25981 |
73.73 |
95.03 |
| AVERAGE |
38302 |
108.70 |
114.59 |
| MEDIAN |
39067 |
110.87 |
115.18 |
| STDDEV |
3536 |
10 |
7 |
Any valuable suggestions, comments for improvement shall be accepted with alacrity.
Happy investing!
Vijay Kiran
1 Like
Continuing with the above post, below are the investment mistakes and therefore learnings from personal experience:
| # |
Learnings since 2004 |
| 1 |
FOMO - Fear of missing out is a dangerous behaviour and psychology while investing in Stock Market. Therefore, it is always better to be late in good party than to be early in bad party. |
| 2 |
The Stocks or Mutual fund having less standard deviation is much better and should be preferred for long term investment. |
| 3 |
Minimum period of investment should be at least 10 years. |
| 4 |
Small allocation on good company (e.g. Petronet) and large allocation on bad company (e.g. ONGC) is equally BAD. |
| 5 |
Any investment in Government owned companies (ONGC, NTPC, NHPC, SAIL, BHEL, Coal India, Oil India, GAIL, PNB etc.) is DISASTROUS. |
| 6 |
For a amateur investor, diversification is a must to reduce unforeseen risk of investment. |
| 7 |
Any investment in stocks not showing any positive sign of reversal from loss in a period of at least three years should be redeemed without fail. |
| 8 |
When stock performance is superior year after year then increased investment should be made periodically. (e.g. Petronet) |
| 9 |
Good Stocks sold too early for minimum or little gain is a losing game. (e.g. Havells) |
| 10 |
If one doesn’t know how to evaluate the company then better option is to invest in good FMCG company for long term. (e.g. ITC, Nestle, Britannia etc.) |
| 11 |
Avoid investment in cyclical and metal companies (e.g. Tata Steel, MMTC, Textile like Super Spinning) |
| 12 |
It is better to invest in Index Mutual Fund than any scheme of mutual fund. |
| 13 |
Debt funds are also risky and can lose money upto 6%-7% in a day. (e.g. Franklin Ultra Debt Fund and Franklin low duration fund due to Vodafone exposure.) |
| 14 |
The Asset Allocation is must for stability of Retirement Corpus. Ideal Asset Allocation should be Equity : Debt = 60% : 40% |
| 15 |
Minimum amount to invest in any good stock should be atleast 1 lakh. (e.g. Petronet, TCS, ITC) |
| 16 |
Never invest on a factor of high dividend paying company (e.g. ONGC). |
| 17 |
In mutual fund, growth option is always better than dividend option. |
| 18 |
In mutual fund, always invest in DIRECT plans. |
| 19 |
Price is very important factor for Return and drawdown. Even a good quality stock cannot be bought at any high price. |
| 20 |
It is always better to avoid stocks which are falling for bad management reasons. (e.g. Yes Bank, Dewan Housing, Zee Entertainment) |
| 21 |
Retirement Corpus is sacrosanct capital. No unnecessary risks in lieu of Returns should be taken. |
| 22 |
Risk of losing money as well as gaining money is equally very high in Stock market. Therefore risk of losing money should always be evaluated and considered first than return. |
| 23 |
Never ever invest in following types of companies: Airlines, Telecom, Govt. Owned companies, Metals. Ex. Like Indigo, Bharti, ONGC, SAIL, BHEL, Coal India, Hindalco, Tata Steel etc. |
Note: Above names are for indicative purpose only and not for investment.
Any reflections will be most appreciated.
Vijay Kiran
21 Likes
Very Nicely put.
Can you please share name of companies in your portfolio?
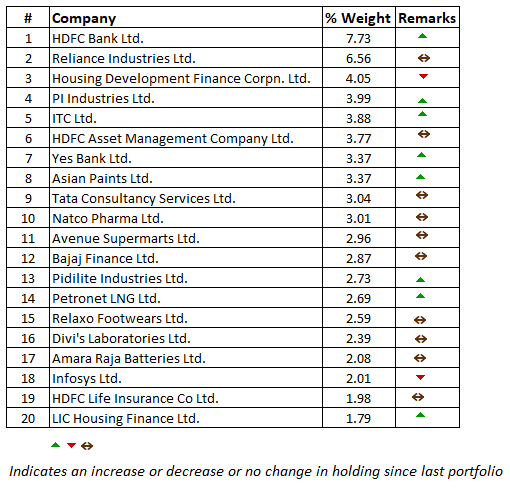
Thanks. Although I have give reference to the Top Holdings in the link (VK PF Performance Graph) mentioned in above post, I am writing again here for common reference:
|TOP 20 Holdings|
| # |
Company |
% Weight |
| 1 |
HDFC Bank |
8.34 |
| 2 |
HDFC |
5.65 |
| 3 |
HDFC AMC |
5.58 |
| 4 |
Reliance Industries |
4.85 |
| 5 |
ITC |
4.78 |
| 6 |
Asian Paints |
3.80 |
| 7 |
Avenue Supermarts |
3.67 |
| 8 |
PI Industries |
3.52 |
| 9 |
Pidilite Industries |
3.37 |
| 10 |
Infosys |
3.30 |
| 11 |
Relaxo Footwears |
3.24 |
| 12 |
TCS |
3.14 |
| 13 |
Petronet LNG |
3.13 |
| 14 |
Natco Pharma |
2.92 |
| 15 |
Bajaj Finance |
2.31 |
| 16 |
Divi’s Laboratories |
2.30 |
| 17 |
HDFC Life Insurance |
2.25 |
| 18 |
Ajanta Pharma |
2.00 |
| 19 |
Nestle India |
1.87 |
| 20 |
Amara Raja Batteries |
1.84 |
2 Likes
Friends, today I am presenting a curtain raiser to the Portfolio Management using Statistical analysis and techniques which I am following.
An investment is made with an objective of achieving long term goals confidently. However the volatility of the market impact the Portfolio return and make it quite difficult to ascertain the attainment of objective.
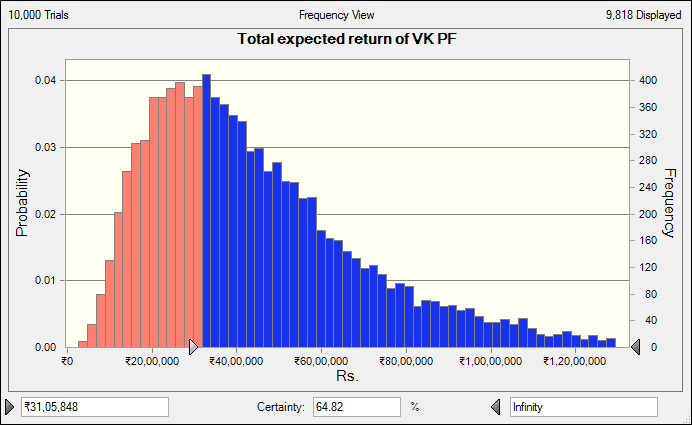
For example, for a long term goal of Kid education due in 10 years from now, assuming current PF investment of Rs. 10 lakhs and PF return of 12%, what is the probability that Portfolio will generate the expected return of Rs 3,105,848?
|
Decision |
| Portfolio factors |
variables |
| Assuming Amount Invested |
₹1,000,000 |
| Assuming Expected PF Rate of return p.a. (%) |
12.00% |
| Time (years) |
10 |
| Total expected return of VK PF |
₹3,105,848 |
With reference to the portfolio statistical data collected over time:
|
PF |
Mean |
stddev |
| Investments |
return |
return |
risks |
| VK PF - 2020 |
14.59% |
14.59% |
7% |
Applying MonteCarlo Simulation technique, The current PF Mean = 14.59% and Std. Deviation = 7%, the probability to achieve expected return of Rs. 3,105,848 and above is equal to = 64.82%.
Conclusion: To continue with the current Portfolio allocation and its constituents.
Link to analysis: VK PF Performance Graph
Thanks for your time.
Vijay Kiran.
1 Like
PF Stock Update as on 25.08.2020
Top 20 Stocks:
The corona virus fall has been recovered this month. After extensive reading of this forum especially guidance from veteran like @hitesh2710 Hitesh Bhai thread, have added few Pharma scrips but < 1% of PF. . Will update the PF performance shortly.
2 Likes
Great selection of stock.
I have 8 stock common with you.
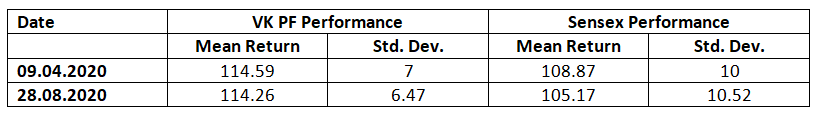
VK PF Performance Vs Benchmark Index Sensex 30
| Asset Allocation |
Equity |
Debt |
| Target |
60 |
40 |
| Actual (on 28.08.2020) |
68.87 |
31.13 |
Key Statistics as on 28.08.2020:
Hey,
How do you compare portfolio returns to a benchmark? Are there any tools available for this?
I developed a excel based tool to do this. Its not very difficult. If you are interested and need it than let me know. I will share it. Thanks for your time.
1 Like
Dear VK
I really enjoyed reading the entire thread.
I too have realized (over long period of time) that PSUs are a loosing investment
If you keep monitoring too closely, FOMO effect does creep in (difficult to just watch and do nothing)
The “coffee can” PMS so far has been my best effort. Find companies with and sit tight
No debt (for non financial cos)
ROIC greater than 25% for last 5 years or more
Growing the revenues at rate greater than GDP growth
Clean management
Astute allocation of capital
To me in Indian markets, in the long term investment scenario, finding " clean management"
is of prime importance
Minority investors need a clean management (specially for long term value investors) not to be short changed during this period
3 Likes
@Inimitable_Investor,
Here is the asked tool for common reference for those who may need it.
PF_Vs_Sensex_CompareTool
Thanks.
3 Likes
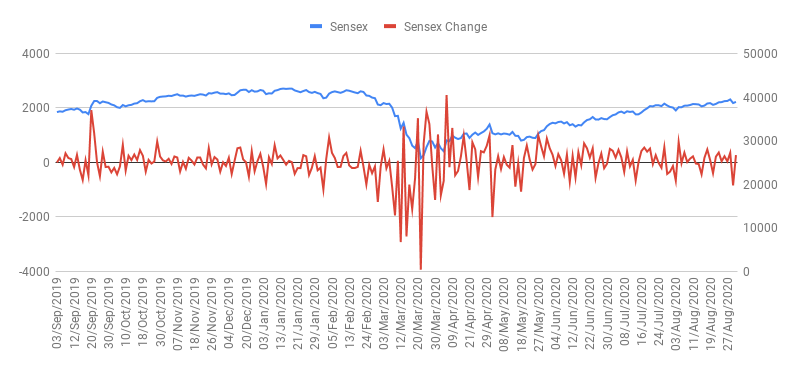
The Sensex Return!
The above chart is from my analysis desk. The last one year pattern of sensex is really very amazing. From the chart we can see that in the first 6 months (Sep-Mar) market seems to be very confused but in latter half (Mar-Sep) market is not willing to give up and inching higher month on month post pandemic fall with high confidence.
I think that market has entered into a strong bull run and in 15-18 months there would be no surprise if market hit the range of 45000-50000.
Any reflections will be appreciated.
1 Like
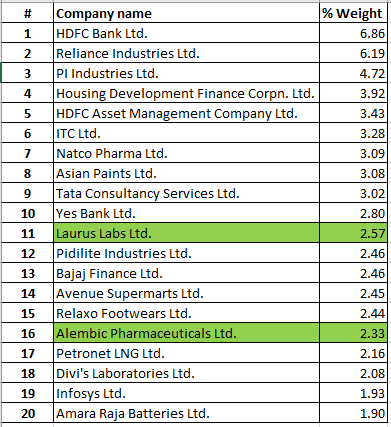
PF Stock Update as on 30.09.2020
Top 20 Holdings:
Two new stocks in the portfolio from Pharma sector - Laurus and Alembic. Incremental capital allocated to HDFC pack, ITC and PI in the month of September during fall.
3 Likes
Hi Vijay,
How do you pull/fetch the data to compare both the benchmark and your PF return in excel?
You are holding several solid businesses, could you share the average buy price?
Your top 20 constitutes ~60% of portfolio. Whats your portfolio size? Are you considering cash as a component of portfolio?
Can you please share the approach you follow to buy at the fair price ?
@naquib_alam Since Nov 2018, I am maintaining daily record of my PF value on a closing basis. I even note down the Sensex closing value in my PF tracker. Comparing is not difficult once you have the data points. In the earlier post I shared the draft approach for comparison against benchmark.
@sivaramtvl  very tough question to answer on public platform.
In brief, well I can segregate the stocks of my portfolio based on holding period which which will give the fair idea about the acquisition price.
-
Holding since 2004 - Reliance, Petronet, ITC, TCS, Infosys,
-
Holding since 2016 through 2018 - HDFC Bank, HDFC, PI, HDFC AMC, Natco, Asian Paints, Pidilite, Yes Bank, Bajaj Finance, Avenue Supermart, Relaxo, Divis, Amara Raja
-
Holding in 2020 - Alembic, Laurus
I follow the Asset allocation ratio of 60%:40% between Equity and Debt. The Debt includes PPF, EPF, NPS, Gold, Bonds, Cash. The PF is being developed for retirement corpus plus child education and is currently 10-12 times of my annual expense. I do lots of fundamental and statistical analysis of various data points of my PF. At PF level I focus on RRR (Reward-Risk Ratio) and every attempt is made to minimize the risk to my portfolio. My PF RRR as on yesterday stands out to be 16.96 which means for every unit of Risk my PF Reward is close 17 times.
Hope this helps. Happy Investing.
VK.
5 Likes
@Rafi_Syed My buy approach is simple and many times I tend to buy stock at high price if I liked it. I follow staggered approach of building the stock allocation. I always buy very small and keep on buying till my desired level is reached and then I stop buying. Averaging down is done only on significant fall as per my statistical analysis. Stock inclusion in PF is never done on price consideration. Business understanding and long term accrual benefit is the only criteria.
I follow Peter Lynch and Graham approach. I am a firm believer in diversification
Hope this helps.
6 Likes