Indian Equity Markets: A Data History
A data history of the Indian equity markets should be an ideal starting point for all who are starting the investing phase of their life. You could be investing, directly, or via an advisor, PMS, AIF, or MF and could be interested in individual equities, thematic, sectoral, strategic, ETF, Index, etc. This data history will give you a benchmark on what kind of returns to expect, what lumpiness the returns could have, the importance of investing only your patient capital into equity products, and why one needs to be careful around periods of market euphoria.
I have covered major indices based on their popularity, history, and while I could certainly add more indices given the time and resources, google sheet has a 5 mn cell limit which quickly got filled with this data. I have thus not included sectoral and thematic indices as comparing them to broad-based indices is pointless. Broad-based indices and their historical returns should be directly comparable to most diversified portfolios. However, I have included two strategy based indices into the comparison, they are the simplest form of factor-based investing.
I have included comparable indices from both NSE and BSE as I wanted to focus on the value-add if any provided towards the indices’ returns by these two major exchanges and whether we could identify a clear loser and winner.
Indices
I have included the following indices in this comparison:
- NIFTY 50
- SENSEX
- NSE 100
- BSE 100
- NSE 200
- BSE 200
- NSE 500
- BSE 500
- NSE MIDCAP
- BSE MIDCAP
- NSE SMALLCAP
- BSE SMALLCAP
- NSE MIDSMALLCAP
- BSE MIDSMALLCAP
- NSE ALPHA 50
- BSE MOMENTUM
The data for the above indices is available from different time periods, I could have cleaned the comparable indices data to avoid any outliers which may have crept due to differing market cycle in the longer time periods but I wanted to include the oldest data points I could find. I will call out such outliers in the data and not consider them for comparison.
Dates
Rolling Returns
To start with let us pick up the rolling return charts of different indices. If you do not know what rolling returns are, what you need to know is that rolling returns are an attempt to protect ourselves from the bias of picking arbitrary starting and ending points in any time data series.
You all must have heard the stories from someone highlighting that XYZ asset class or instrument gave ABC returns between timestamp 1 and 2. What this ignores is that we have no idea what the returns were between or outside these timestamps. This technique is used by both bear and bull camps to reinforce their bias or view.
So instead we look at rolling returns on a daily price data where we calculate returns from a date “t” to date “t+250” and then we take “t+1” and “t+251” for the next rolling period and so on until the end of the dataset.
As humans, it is impossible to completely remove our biases, and in the rolling return charts below I have included my human bias of choosing arbitrary time periods of 1 month, 1, 3, 5, 7 and 10 year periods. This is a civilization/planet-based bias that we all have. Suppose if we were on a different planet in our or different solar system (hopefully in the goldilocks zone), or Earth took a different time period to revolve around the Sun we would be using different time periods to measure performance (same goes for measuring company/investment performance on a quarterly or financial year basis. Do not dismay if a company does not perform in these arbitrary time periods, each company’s business model is different and it takes different time periods for each one to grow their dominance. However, for now, we are stuck with the time period our civilization uses.
I have assumed approximately 250 trading days in a year. The monthly and 1-year return figures are absolute, while the longer timeframe figures are in CAGR.
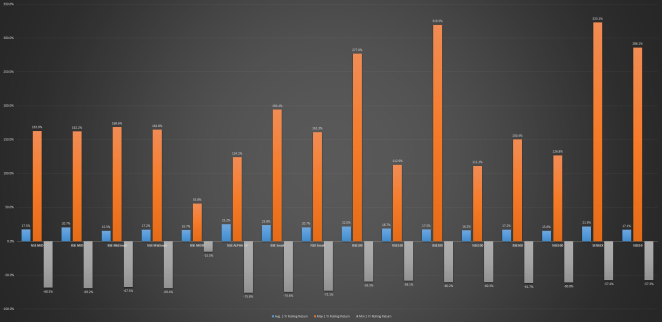
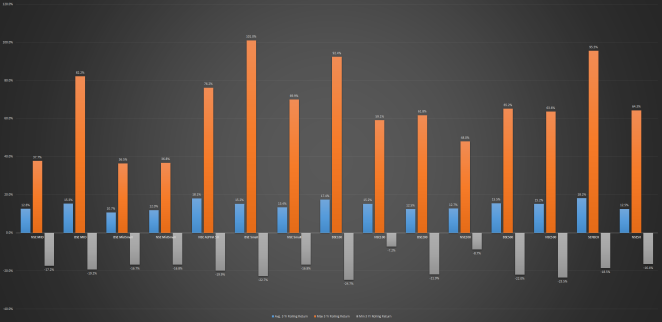
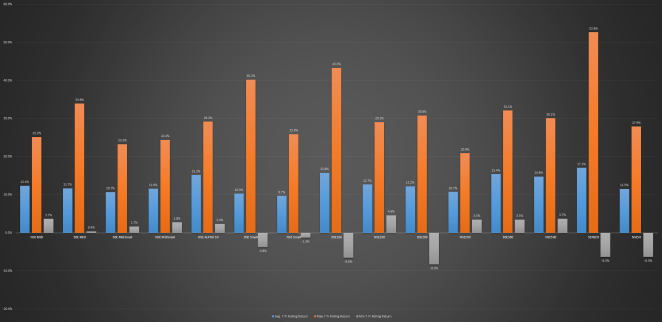
The average performance of both NSE and BSE indices in a 1-year rolling timeframe are mostly similar. The mid-cap indices have given 17-20% yearly returns, while small-cap indices have given 20-23%. The 50, 100, 200, & 500 constituent indices which have a heavy skew towards large-caps are not far behind in average performance.
Averages have a way of hiding the outliers if we compare the maximum of 1-year rolling returns, we see surprising outliers from the pre-2000 indices. The maximum returns are almost 2x of the indices which started post-2000. This tells us just how undervalued, underresearched the markets were back then and the market euphoria post-2000 was a mere shadow of what our elders have witnessed before us.
In terms of minimum returns, the returns only the unluckiest investor could get, the data is more comparable across all indices, perhaps this is telling us that the markets do not distinguish between any instrument when panic sets in and everyone wants to get out of everything and that this ability of the market to sell indiscriminately in panic has not weakened with time.
We can ignore the outlier that is the BSE Momentum Index, the index has not seen a full-blown market panic in its lifetime, its older cousin or daddy (whatever you may prefer) the NIFTY ALPHA 50, should be an appropriate benchmark for the fall, momentum strategies can see during tough times.
1 Year
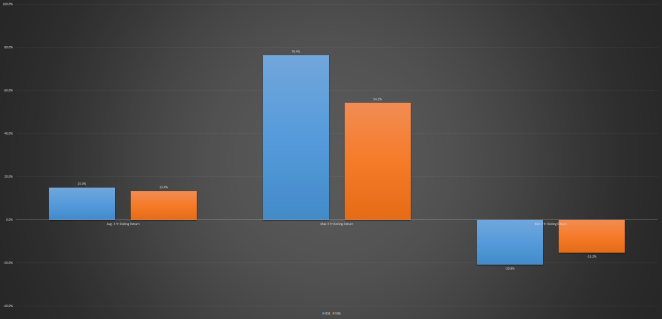
BSE vs NSE – We can ignore the small win for BSE in the Small-Cap indices, BSE’s index was started 8 months before the NSE, BSE captured a lot of the up move in the market and NSE did not. We should also ignore BSE’s win in the 100 & 200 constituents indices as NSE started much after BSE. The 500 constituents indices started around the same time with a difference of 5 months. The 24% outperformance by BSE over NSE was all the result of market direction. Similar story in SENSEX vs NIFTY 50 due to differing time periods.
Amalgamating the above data in the chart below, we can ignore the maximum figure until we reconcile the differing time periods, however, we see small outperformance and underperformance by BSE in average and minimum returns respectively.
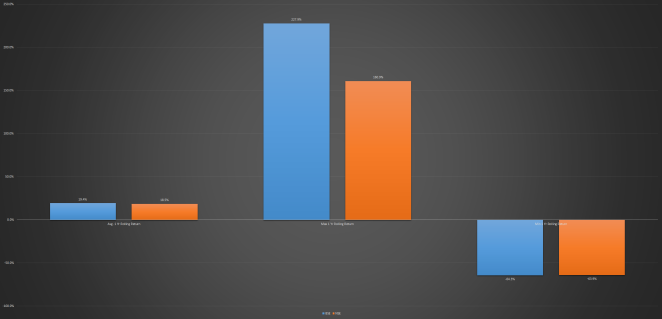
1 yr
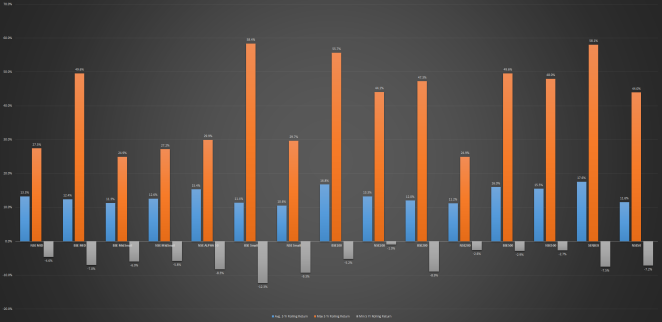
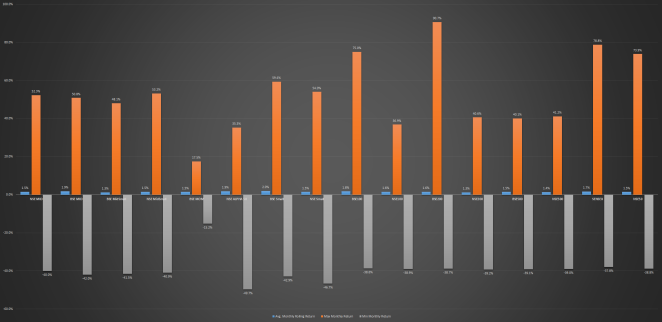
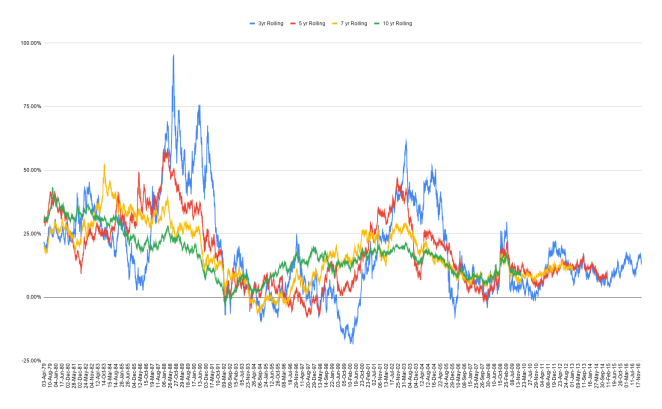
Moving on to the 3-year rolling return data, here, the pre-2000 outliers of the 1-year returns disappear, which tells us that market euphoria or climb does not continue for long, i.e., markets do not keep going up year after year.
What all market participants should notice is that while the maximum and average returns have mellowed down with an extended timeframe, even the minimum returns of the unluckiest investor have reduced. In fact, while the average of maximums has halved, the amalgamation of averages have reduced a few percentage points, the minimums are the real champs here, the averages of minimums have reduced to 1/3rd.
All market participants are getting a lot more wins and a lot fewer losses by just extending their timeframes.
3 Years
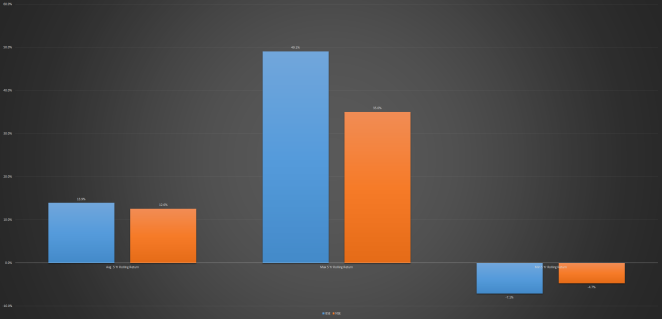
BSE vs NSE – We see a similar outcome between the exchanges as above, however, the average of minimum returns have fallen significantly for BSE against NSE. The bulk of this outperformance by NSE is from the 100 and 200 constituents indices and some from the small-cap indices. The first 4 of 100 and 200 indices have decades between them, while the small-cap indices do not. As a counter-argument to time differences leading to lower minimums, the SENSEX and NIFTY50 also have a decade between them but do not see much difference in minimums.
What is happening here is that we are missing the forest for the trees, we are focusing on one time period of maximum and minimum returns. The ideal way to compare the rolling returns would be the average of all these periods. Which smoothens out the effects of outliers. If you feel that averages obfuscate the data, we can compare the average of the highest and lowest (1%, 2%, 5%, 10%, 20%) of a particular set of returns. This is like looking at a part of the forest which is a middle ground between looking at the entire forest and a single tree.
I have calculated the figures for different %s of data to look at and found that directionally, the results are not different from the picture we get from looking at the average dataset.
3 yr
Similar story continues for the 5, 7, 10-year timeframes. The minimum returns that any investor can get at even the unluckiest of times, turns positive as the time period extends.
5 Years
5 yr
7 Years

7 yr

10 Years

10 yr
The amalgamated average rolling return data shows that BSE is a clear winner against NSE in all timeframes of monthly, 1, 3, 5, 7 and 10 years. A lot of this outperformance is due to the difference in performance between SENSEX and NIFTY50 which is mostly due to the difference in the length of history. Even when we remove these two main indices in our amalgamation, BSE’s lead over NSE continues in terms of average rolling period returns.
The only indices where BSE loses to NSE is, in the longer periods (5, 7, 10 years) of their respective Mid-Cap indices, and all the periods of their SmallMid-Cap indices.
Monthly
The last of the rolling returns graph is for the monthly period, investors should never judge their portfolio returns on a monthly basis, it is too short a timeframe. The only strategies which necessitate a monthly vigil are the momentum-based strategy, which requires frequent rebalancing, even then the investor in those strategies look at the bigger longer picture and knows that monthly outcomes can be negative for some time.
I include this chart just to show how wildly the market can move in a short span of time, any investor needs to be emotionally, mentally ready to see such falls once in a decade on average.
For some reason, on an amalgamated monthly basis, BSE outperforms NSE with its indices but the outperformance is not significant.
Monthly
Buy & Hold Returns
Below are the charts which depict, the absolute and CAGR returns of these indices since inception. SENSEX is the obvious winner here because of its relatively longer history.
NIFTY ALPHA50 is an interesting candidate here, it has similar inception date to BSE Mid Cap, NSE & BSE Small Cap, NSE 100, & NSE 200 indices. With the exceptions of BSE Mid Cap and BSE Small-Cap indices, the ALPHA50 has outperformed the other with its simple factor-based strategy and concentrated design.
Amongst the Small Cap indices, the BSE clearly outperforms the NSE by 3x even though the difference in their inception dates is only 8 months. This difference in such a short amount of time is a testament to the fact that different starting/ending period of a time series can yield different results.

Absolute Return
In terms of CAGR returns since inception, the two momentum strategies are clearly giving ample competition to all the other indices. The underperformance of some Midcap & Smallcap indices relative to their larger-cap peers is puzzling, over such long timeframes they should have clearly outperformed. The reason for the underperformance could be the different length of histories, and that, today’s large caps were actually the small caps at the time of inception.

CAGR Return
Drawdowns
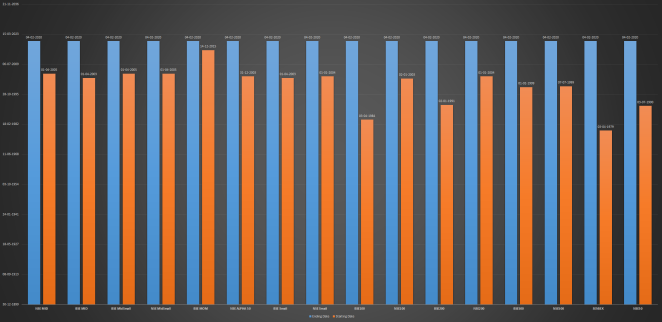
Below is a graph of the maximum drawdown days for different indices. What these represent is the highest number of days an investor’s investment was below the previous all-time high. This graph throws caution to the buy and hold strategy for the really long term, or adding fresh investments at the market tops. These are just the maximum figures, I have included the individual detailed Drawdown graph for each of the indices in the data folder linked at the end of the post.
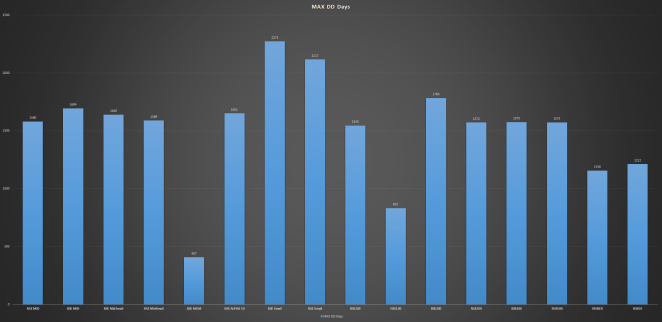
Max Drawdown Days
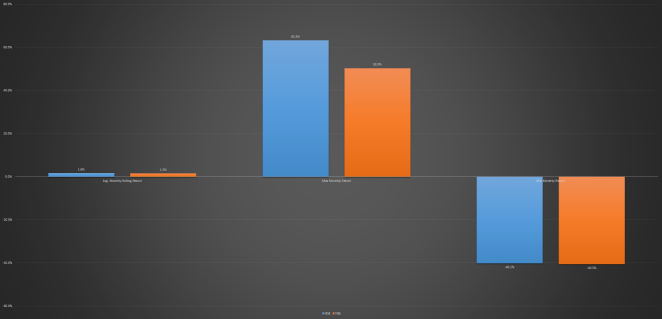
While the above graph tests the patience of any investor, the one below which charts the maximum drawdowns one could suffer from peak to trough, tests the nerves of even the most experienced investors. Massive erosion of capital in a very short amount of time is a real risk in the market when one is investing near market peaks. Although these drawdowns can often have a V-shaped recovery and one only suffers paper losses, there is something to be said about the lost opportunity cost if one does not keep aside cash in the portfolio for such opportune times.
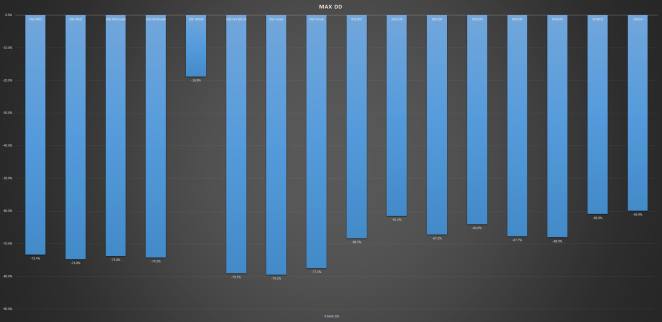
Max Draw Down
Not much to read here, given the magnitude of the drawdowns in both NSE & BSE indices a few days fewer of drawdowns and 6% lesser drawdown would bring a little comfort to the investor who had suffered so much.
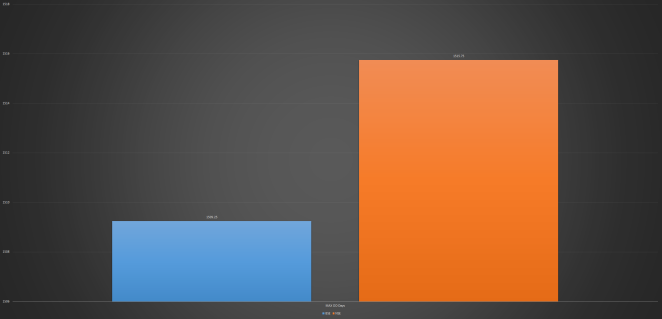
DD Days
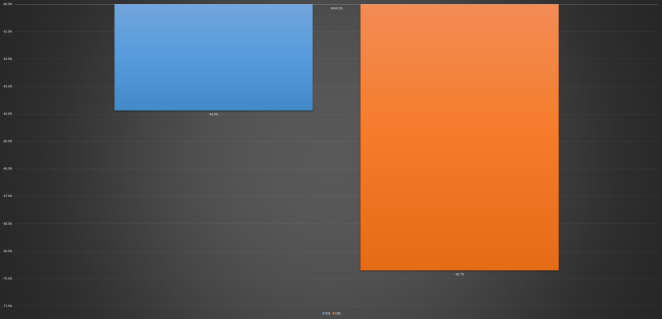
Max DD
SENSEX Data Charts Sample
I have included the following charts for each of the indices in the data folder linked at the end. For the rolling returns charts, the return corresponds to the purchase date. The longer the time horizon of the investor, the lower are their chances of a negative outcome in their investment.
The drawdown and drawdown days charts will help familiarise the investors with the fact that equity as an asset class spends most of its time below some previous all-time high. It is impossible to successfully/perfectly time the entry and exit in equity markets. You will never know beforehand what was the peak and trough.
The ST rolling returns chart is a perfect example of randomness, this is why it is hard to be profitable in trading.
The last chart is of the local price peaks, in equity markets it can take years for the previous peak to be conquered.
LT Rolling Returns
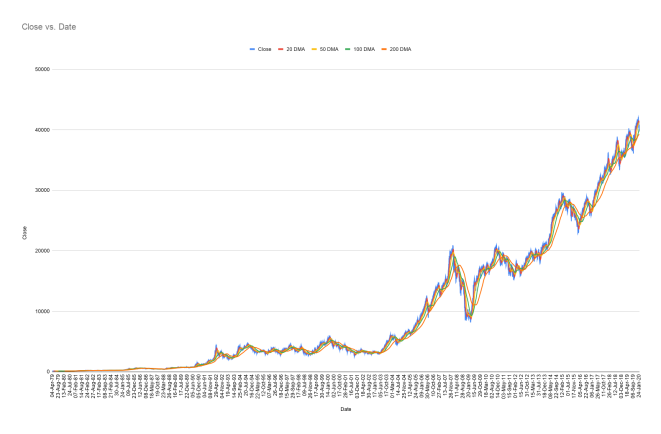
Index with SMAs
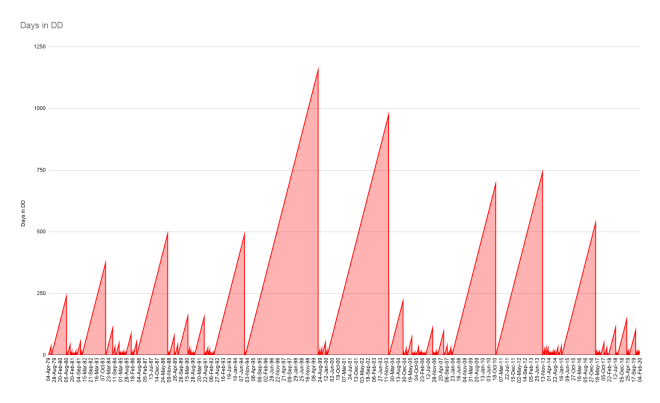
Drawdown Days
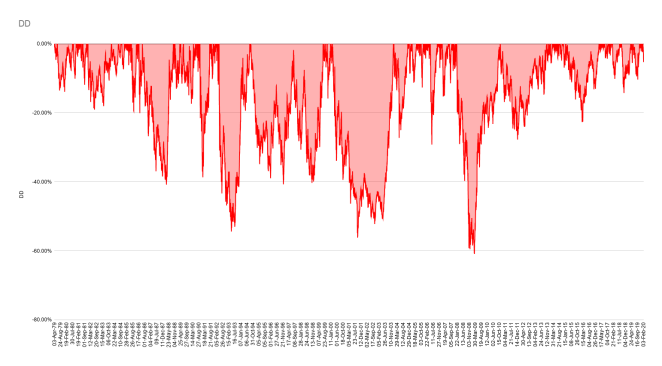
Drawdown
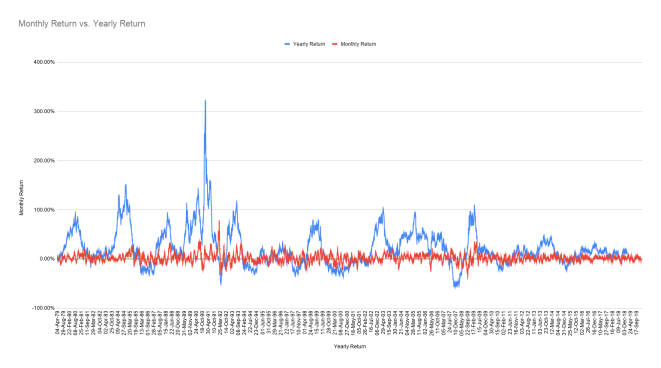
ST Rolling Returns
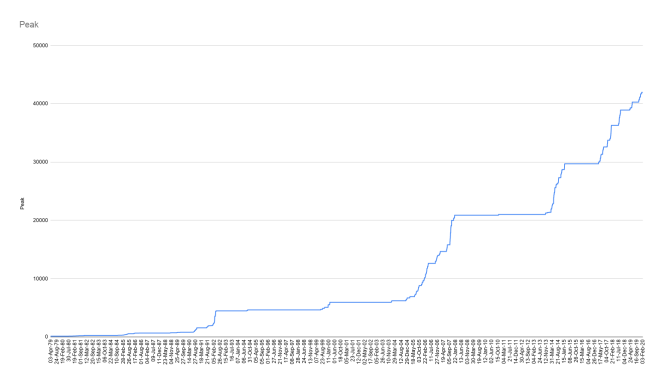
Peaks
I would like to end this post, with a phenomenon I have noticed in my limited time in the markets. The life of an investor is always at the edge of regret, sometime you will regret buying/not buying, selling/not selling, someone will always be making more money faster than you, your portfolio may not grow as fast as you want it to. It is also difficult to be satisfied in equity markets, the ones who made 20% returns are looking to double their money, the doubles wants a 5 bagger, the 10 bagger wants 100. Even the 100 baggers won’t rest and want to achieve this feat again and again.
You will notice that market performance is not much different from life, life also has its ups and downs, rarely are people satisfied in their life, most of the successful people in both life and markets follow a structure in their efforts towards improvement, if one does that, they can position themselves on the right side of luck.
Happy Investing.
Data:
- Indices Data – Dropbox
- Indices Data Sheet – Indices Historical DD - Google Sheets
- Momentum Indices Data Sheet – Momentum Indices DD - Google Sheets
- ITC Price Data Sheet – ITC Price DD - Google Sheets
- ITC Data Charts – Dropbox
Blogpost: Indian Equity Markets: A Data History | oldschoolfinance