The problem with indicators is them giving false positives many a times and none of them being leading but being only lagging. Relying on one or a bunch of indicators to get completely out of equities as an asset class is harmful for long term returns.
Many people use the PE of the indices to determine capital allocation between debt and equity. It is difficult to follow these rules strictly, for ex. If one were to completely exit at PE > 25 and only enter at PE < 15, they would be out of the market for a long time.
So one needs to have a dynamic allocation strategy of changing allocation between equity and debt as the market PE moves up or down.
Stableinvestor and portfolioyoga have done a good amount of work on the above.
I have not looked into other technical indicators and their viability. Perhaps someone more adept in this field can help here.
As for indicators from momentum investing, it is not easy to find the historic portfolio composition of the indices. Without this it would be difficult to build an indicator. What I am working on right now is to record the highest, lowest and average sharpe ratios of my personal momentum portfolio on a monthly basis. Also recording the same from this year for the momentum indices of BSE and NSE. Not sure whether an indicator will develop from this but theoretically one should be able to see momentum weakening and strengthening but with a lag effect.
I will share the same when I have enough data to form a thesis.
PS: Bheeshma’s above comment reminds me of the work done by Yogesh. He uses no. Of stock above or below their 200 DMA to gauge bearishness or bullishness in the markets.
Kudos for very detailed work. This is really extensive and will need some time to digest and sink-in. More so, since different indexes has different point of origin hence difference in rolling returns.
In the meantime, two quick things:
I think you have provided monthly/yearly returns starting first corresponding cell only. For example, BSE500 had origin date of 02/01/1999 (Feb 1999), so rolling monthly return should start reflecting starting 03/01/1999 (March 1999) only. Likewise, 1 Year rolling return should appear from 02/01/2000 only. For first 30 days there is no return to be calculated since we dont have full 30 days data. End result - The curves of graph etc. may remain as it is however the corresponding time axis values will shift right.
I think you had to resort to standard 250 days or multiples as a surrogate to annual return calculation (i.e between 02/15/2019 to 02/15/2020). Attached is a quick effort to fix the issue with some excel hack. Please refer to formula in cell C23 or D251 onwards of attached excel sheet to validate. Index Return.xlsx (1.5 MB)
This become little critical for drawing meaningful inference since on a 10 Year rolling etc. there is a wide difference between actual date difference vs. assumed 2500 working days.
It will really help if you can revisit the data analysis to see if the existing findings still holds true in context of revised approach.
Again, there is some real insight in your study and gives a reference point towards passive indexing baseline vs. delta expectation on active effort/time investment.
Hi Tarun,
Thank you for your suggestions to improve the working of the sheet.
The first point of starting date of rolling returns, both of our ways are correct, the way I have positioned is at their buy date and the way you are positioning them is at their sell date. We can use either.
On the 2nd point I appreciate you bringing out the point of variance in the dates with my 250 day year assumption. I did a crude check on the 1st 10 year end date for BSE500 and it comes out to be 30th Jan 09 which is very close to the end from the 1st feb 99 starting date.
Will run a check on other years as well tomorrow. Its late and I will go through the formula you have provided to adjust for the 250 day assumption with a fresh mind. If you can please do share how the logic of the formula works, as it appears to be fairly complicated with its multiple nestings.
How does it work? Is it trying to match the date, month and year + x variables years. If yes then what does the formula do when it doesn’t find a matching end date to the start date as weekends keep changing year to year and what might be a trading date in one year might be a no trade, close day in another year.
Hi @hack2abi, you are right. this will look for corresponding day 1 month or 1/3/5/7 years in past. If there is no exact rresponding date (due to shifting weekends,holidays etc.) then will look for immediate previous working day to do the comparison. In real life also this is how the comparison will work, isn’t it.
I was going through all the attachments on this thread and also BSE website. I am unable to get the historical index values of sensex right from inception. Is it possible to get that.
Initially when you select the year from the drop down menu, the furthest it shows is 10 years back. But if you click the year drop down menu again, 10 more years get unlocked. Weird. Thankfully one can download the entire data in one go from BSE unlike NSE which limits to 365 days at a time.
When will these exchanges move to latest technology?
@dd1474
Hi dhiraj, is it possible to share the updates, major changes in your portfolio, lessons learned and thought process during these unprecedented times of Covid-19.
Tried to work on couple of Tata group hostorical financial and shareholder return (assuming one got 100 share in IPO and hold without participating in rights/warrant issue and hold till Dec 2019).
In case of Tata Steel, over 93 years (1926-2019 period), Net profit for the company grown at CAGR of 11.7% p.a. The company did IPO in 1917 at par. I assumed that investor bought 100 share allotment in IPO at par value of Rs 75 per share and got dividend declared with bonus/split adjustment. I do not have dividend details for around 10 years, so XIRR calculated would be lower than actual. My calculated XIRR for a shareholder over 103 years would be 10%. (Refer to Range Y2:AE103 for my working in Tata steel excel sheet).
Similarly, for Voltas Over six decades, XIRR has been around 16.5%p.a. while Net profit CAGR is around 13.8% p.a.
Enclosing Voltas working file (cell Ab71 and Ae71).
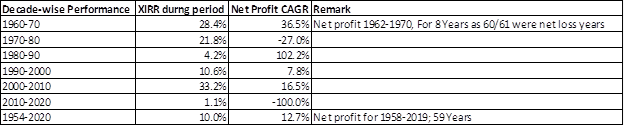
Find enclosed summary of my shareholder return calculation for Minority shareholder of Great Eastern Shipping since IPO listing. The calculation assume only cash outflows for purchase of IPO and holding the original quantity of shares along with bonus and NOT PARTICIPATED in right issue over the period.
As per my discussion with Donald, I tried to calculate Decade wise return as well over the 5 decades to get more insight in the company. Find enclosed my summary of return:
Over 65 years since IPO, investor got XIRR (including dividend, details in excel work sheet) of 10.0% p.a. as against net profit growth of CAGR 12.7% during 1958-2019 years (59 years).
The decade wise performance show most remunerative phase of 2000-2010 period and 1960-70 period. While I have limited understanding of 1960-70 period, in 2000 entry price was lower due to Dot com bust. I learning from this is in cyclical company, the entry and exit are very cirtical for investor to make wealth.
Also, during 2005-2006, the management did buyback of around 20% of outstanding equity agt attractive value which assisted company to deliver superior performance in the sector. There demerger of reality and offshore business, which I have not considered in my calculation. That would improve the shareholder return further.
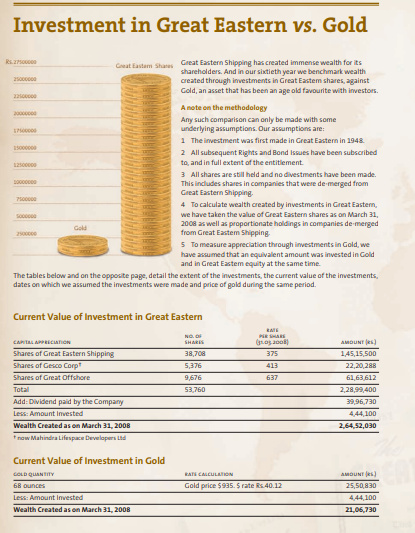
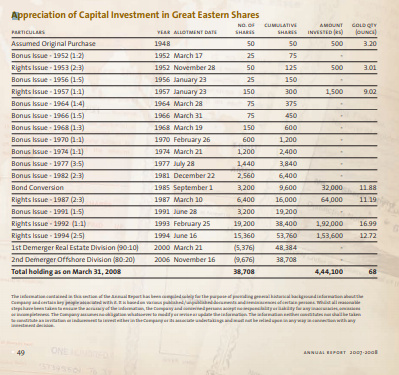
In FY2008, the company completed 60 years and the annual report (available on company webiste) compare company performance with Gold investment during the period and wealth created by the company. Very rarely one come across such working from the company listed in India which is worth appreciating. I am enclosing screern shot of relevant portion of annual report.
My excel working GE Shiiping Past Return.xlsx (58.0 KB)
Discl: No investment in the company. Do not assure authenticity of calculation is it is very difficult to get old data for companies.
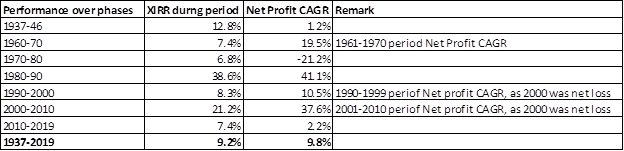
Another one, Giant and among the oldest company of Cement sector ACC. Find enclosed my working for investor who hold share (including bonus but not participating in rights) in ACC which got listed on BSE on 21-10-1937.
Over 1937-2019 (82 years), the minority shareholder XIRR (including dividend) were 9.2%. Net profit growth CAGR during 1937-2019 period was around 9.8%. So return of the company moved in line net profit growth over the years.
What was noteworthy that during the period, there were multiple change in ownership of the company. In fact, the company was formed by merger various small cement companies in 1930s which subsequently got controlled by British group moving the control to Tata Group after independence, in 2000 seen controlled moved to Gujarat Ambuja group and finally moved to Holicem group.
It is also pertinent to note that the company was one of the most favoured stock of Mr, Harshad Mehta during 1990-92 period. However, despite that, return in 1990-2000 period was mediocare 8.3%, despite net profit growth 10.5%.
Find enclosed summary of my working:
One interesing point which give insight in Cement sector operation in Indian since early 1930s.
The sector was reasonably consolidated as compared with industry before independence and hence has relatively bettter price influence despite being commodity.
Find enclosed sharheolder return XIRR since IPO for an investor. The enclosed link provide details for Ratnamani Metals. The enclosed message has excel link providing details for calculation.
Find enlcosed my working on Past return of Asian Paint since Listing. Key highlights of my findings are as under
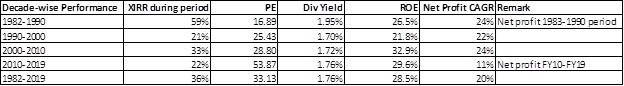
During 1982-2019 period, XIRR for shareholder (including dividend) was around 36% p.a… During same period, net profit increased at CAGR of 20% p.a. and PE ratio ( as per Market share price 14 December 1984) was around 13 times which increased to nearly 80 times as on December 31 2019 share price. (I have considered FY19 EPS with December 2019 price to make is comparable with past calculations).
An investor who got 100 share allotment with investment of Rs 2300 in 22 October 1982 (IPO with Rs 13 permium), over last 37 years, would have collected dividend of 13,80,408 (including latest dividend of Rs 1,93,620 in FY19 on investment of Rs 2300) and current value of 18,440 shares (due to split and bonuses) at 31 December 2019 price of Rs 1786.85 per share is 3,29,49,514.
Amazing past perfromance of the company. What is interesting to note that the company, while PE of the company has expanded over last 4 decades, Dividend yield has remain less volatile at around 1.77% over last 37 years. Return of Equity is also fairly stable at 32.5% with moderate volatility over period. Net profit in CY1983 was around 3.65 Cr which has increased to Rs 2159.50 Cr in FY2019.
I could not get financial from FY1995-FY1998 period and hence ROE and PE for 1990s is only average for available years data. I am enlosing my working for everyone reference.
Data source: Prices and Financial from CY1983-FY1994 compiled from BSE Quotation available in BSE web site. Financial from FY1999 compiled from annual report of Asian paints.
I was trying to get more understanding about investing in company at high PE and impact of same in case PE contract, despite very good business propsects. While Asian paint kind of appear happy ending picture, story was completely different for Investor of Wipro in December 2000.
In case of Wipro, entry in December 2000 at PE of 185 times, would have resulted in XIRR return of 2.6% over next decade (FY2000-2010), mainly coming from Dividend yield which was around 1.1% for the decade. At end of December 2010, PE contracted to 15 times, so despiste Net profit CAGR of 31.5% p.a. during FY2000-FY2010, the shareholder did not got even market return. This are risk and only after decade we know whether the company would behave like Asian Paint or Wipro. Having said that, Intgerity of management and free cashflow ensured, that despite such major rerating Wipro, contributed positive shareholder return during the period.
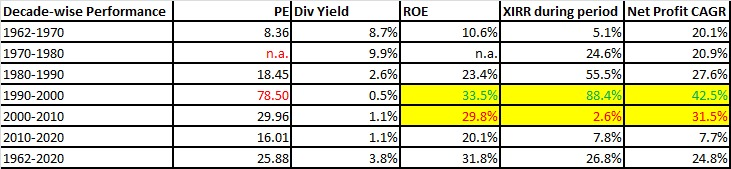
Also, a mouth watering return of 26.8% CAGR over 1962-2020, by no mean is mediocare performance. We hardly find such companies even in global market. Key highlights of my working are as under.
Since Wirpo was listed on BSE from 1946, however, I could get price only from 1962; as against previous companies, in case of Wipro, I have assumed that investor bought share in 1962 and continue to hold till 2020. My details excel sheet is enclosed for everyone’s reference. Wipro Past Return.xlsx (66.6 KB)
Data always represents a story behind. A rational approach would be to tag PE with the story i.e capability of the company to tap industry growth, opportunity size, while keeping competition at bay. Infact, it is story that classifies the theme as structural or cyclical. Although, in a fluidic environment, the categorization is subject to change at different time intervals.
Asian paints solidified its leadership position over time, while Wipro witnessed see-sawed growth rates.