
Hi Harsh, why did you choose to go with dharmraj rather than dhanuka, where I found the margins to be better, they have collaborated with foreign companies and growing at a decent rate with their dahej plant just coming live. Also both are at similar valuation as of now. Any specific pointers? Thanks
I have been hoping that price dips a bit more and I can buy more. The last time I bought was in Feb 2022, so its been a while. Every few years, PI sees a 30% price drop and I try to buy each time that happens.
Coming to pyroxasulfone, broker reports suggest that it contributes 45-50% of their CSM business which brings in a concentration risk. The last time this happened was in FY17, where pyro was a large part of their CSM business. As a result, their FY18 nos were quite muted and stock also underperformed for a couple of years.
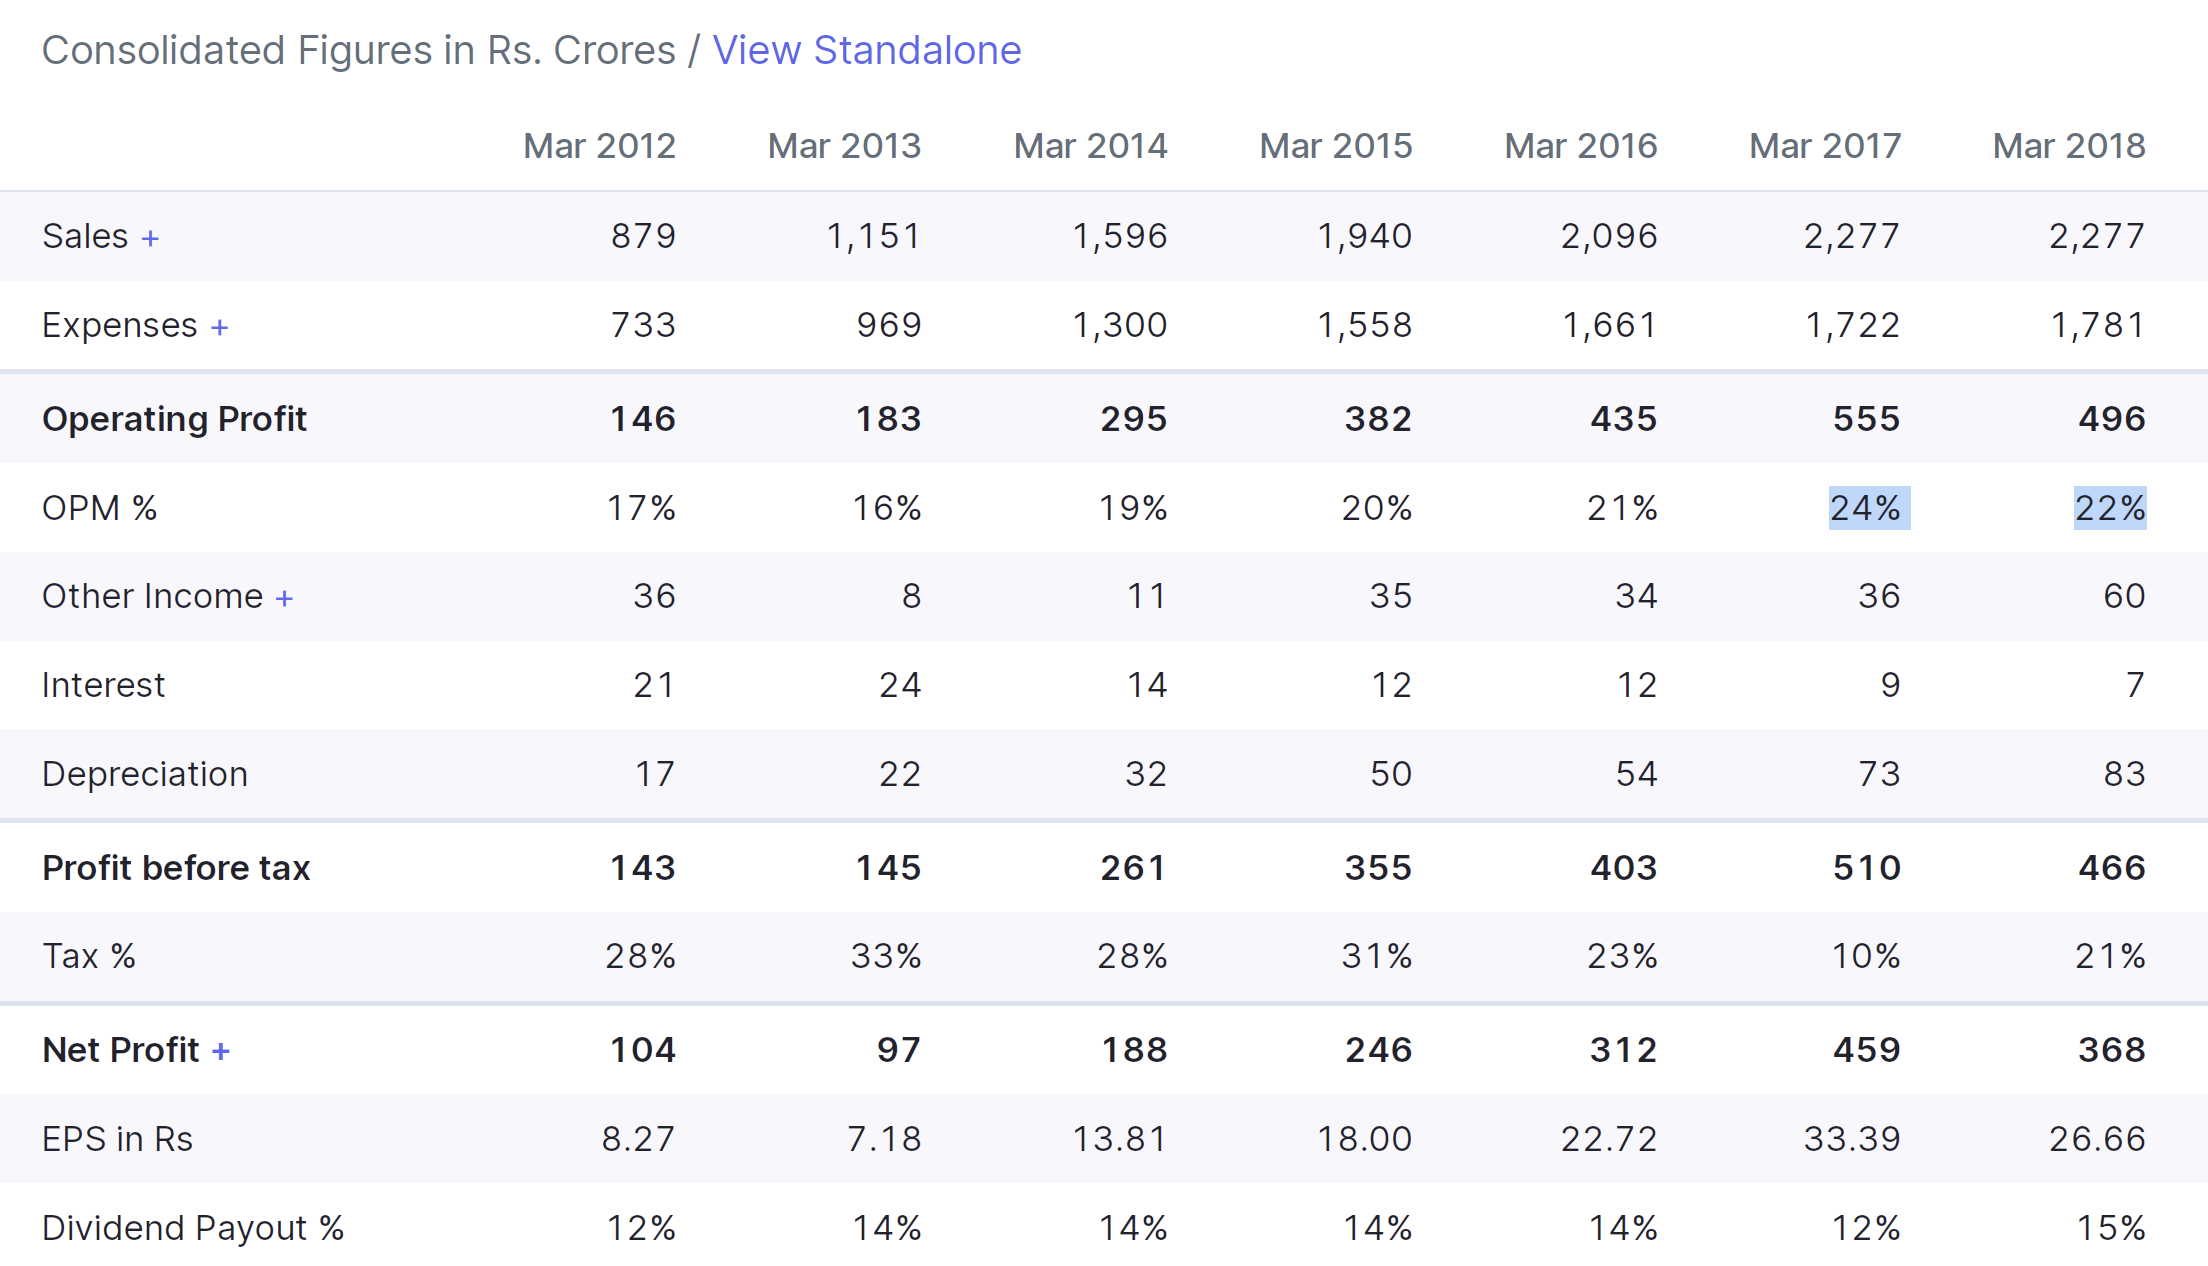
The key difference this time is they have a much larger product basket, which management is hoping can fill the void (if demand for pyro stagnates). Their CSM product basket has increased from 10 at that time to 20-25 now. Also, pharma is a growth driver and is higher gross margin compared to agchem CSM. I actually feel more bullish about their future prospects now, than in 2022 when I had last bought.
Much higher growth, Dharmaj is growing at 25-30% vs Dhanuka growing at 10-12%. On business front, Dhanuka is probably the best managed domestic agchem co.
33 Likes
Harsh can you please also talk about the annual chur you have done so far since the beginning of this thread and also the XIRR targetted vs achieved?
Really appreciate it.
-Abhishek
1 Like
Sharda cropchem - Debt free company with 75 % promoter holding, growing at 15%.
All parameters looks positive. But stock price is not moving. Can you please explain about this business.
2 Likes
Its been 6 years since I have been maintaining my monthly investing records, the performance according to calendar years is shown below.
| Calendar year | My returns | Nifty returns | 100 invested in Harsh folio | 100 invested in Nifty |
|---|---|---|---|---|
| 2018 | -0.63% | 3.15% | 99.37 | 103.15 |
| 2019 | 11.83% | 12.01% | 111.13 | 115.54 |
| 2020 | 27.18% | 14.89% | 141.33 | 132.75 |
| 2021 | 27.30% | 24.12% | 179.92 | 164.76 |
| 2022 | 8.26% | 4.33% | 194.78 | 171.89 |
| 2023 | 48.97% | 20.03% | 290.16 | 206.32 |
A more granular performance (on monthly returns) is shown below.
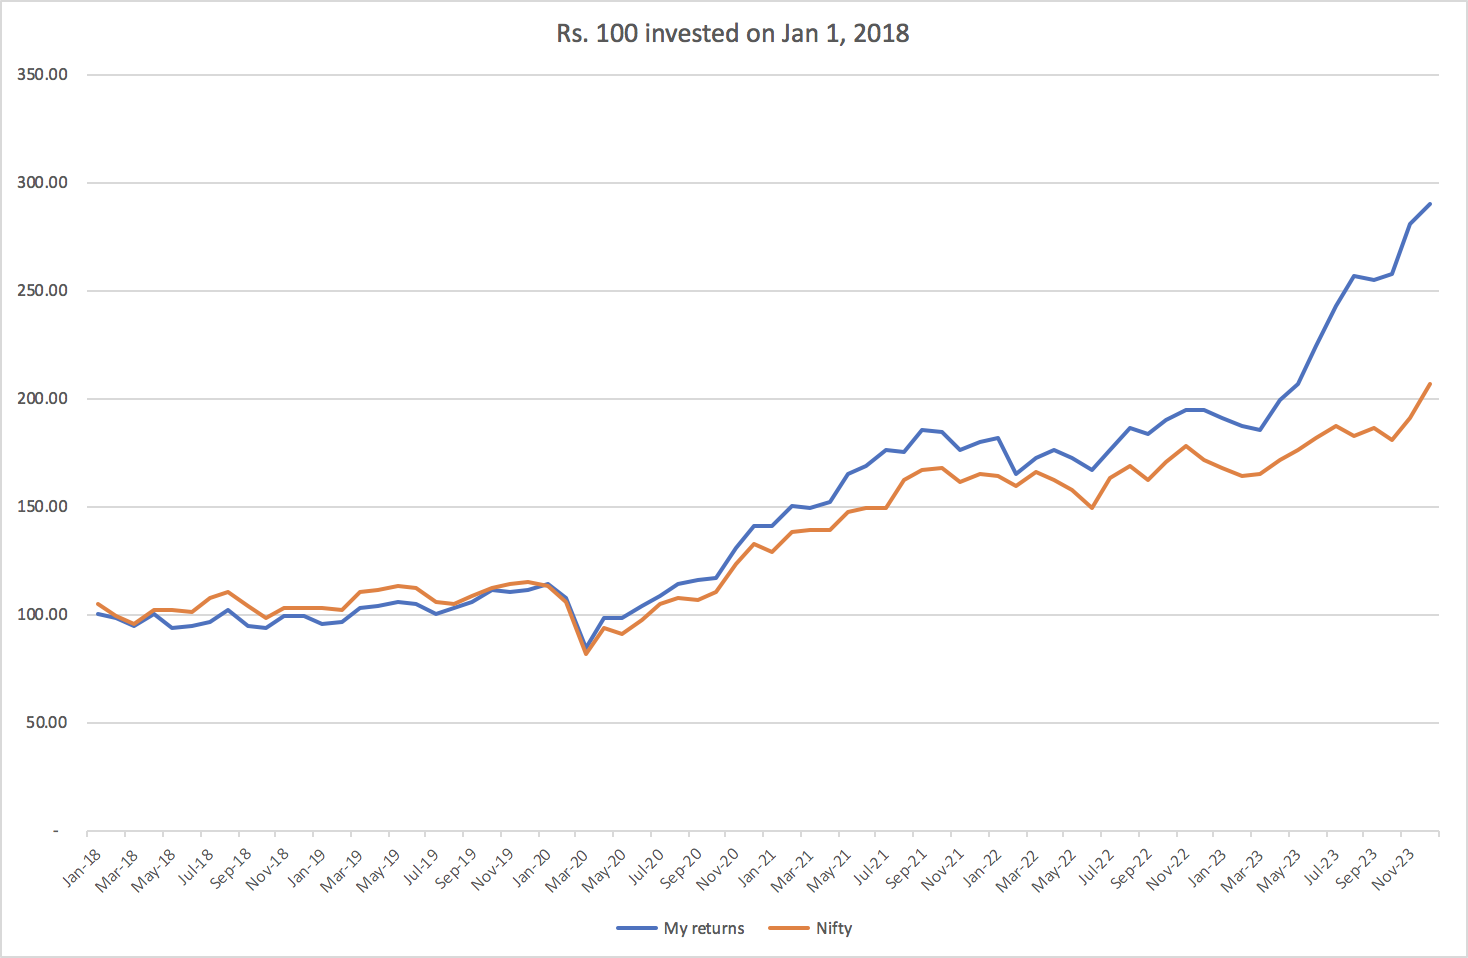
I have managed to outperform nifty over this period, with CY23 now being the best year, and CY18 being the year with maximum underperformance. My portfolio beta has consistently stayed below 1 (computed on monthly data with 1-year lookback). Its crazy that despite 80%+ allocation to small caps, my beta has stayed below 1.
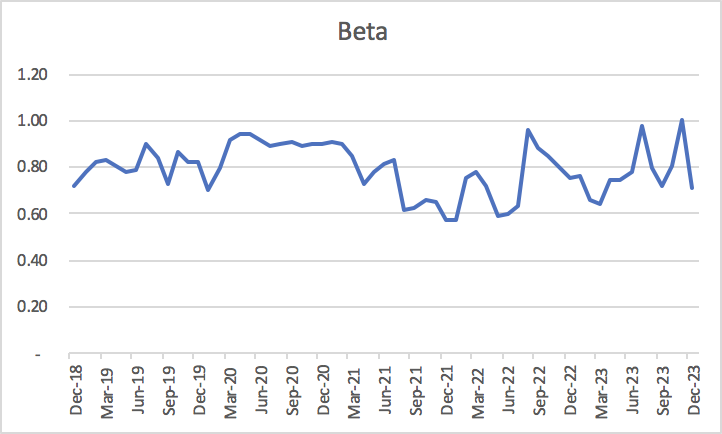
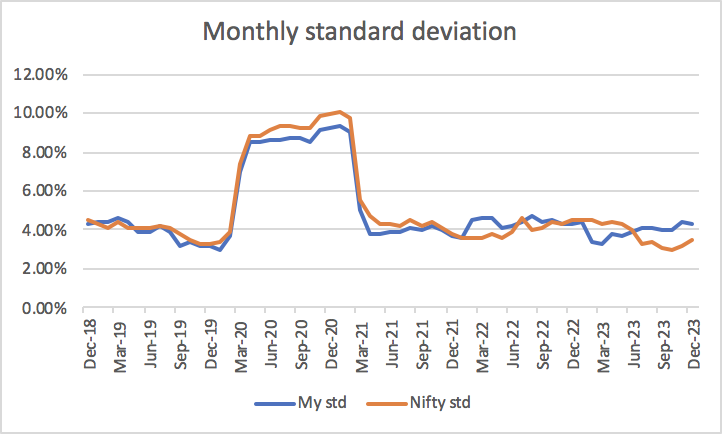
Before I gloat too much on my crazy alpha, lets be realistic. Portfolio volatility has been quite high, and beta looks low because of increasing divergence of my returns with Nifty returns as a result of more bottom-up stock picking
Deep value: Its again doubled this year (110% returns), why am I doing anything other than deep value is something I have started asking myself ![]()
Given the good performance this year, I am looking to reinvest into stocks which are not doing well currently. A large part of 2023 outperformance was from contra stock selection made at peak of 2021. It seems watering my weeds and cutting my flowers has worked for me (who knew!)
Lets see how 2024 pans out. I wish everyone a lot of success in all their endeavours and a very happy new year ![]()
I have increased my goal post from doubling in 4 years (19%) to doubling in 3 years (26% CAGR). So far, IRRs from January 2018 has been in excess of 30% (excluding dividends, transaction costs and taxes). Obviously it will look higher in any other timeframe, but I prefer looking from peak of 2018 as it reduces the element of cyclicality in performance.
91 Likes
@harsh.beria93 I have been following your thread for sometime and there is always something new to learn. To spend time and energy sharing progress and learning consistently is not easy. So Thank you for all the posts.
Your portfolio performance is spectacular. All the best to continue doing this in the future.
Your alpha is off the charts. Have you broken down your alpha contribution by specific companies ?
Is there a pattern where some specific bucket has done consistently better than others ?
If I look at my portfolio last year majority of the alpha (80 percent plus) for me came frm Contribution by just 3 out of 30 plus stocks. This was simply because these were bigger holdings in my portfolio and made an impact. There were other strong performers too but I hadn’t studied them and tracked then deeply so it was a clear portfolio sizing issue and I could not add them enough in time.
Your portfolio has 4 /2 and 1 percent allocations across buckets. Any reason you don’t let any strong performers scale beyond these allocations?
Best
3 Likes
Many congratulations @harsh.beria93 for this tremendous performance. I also want start tracking my monthly performance. Can you please share how exactly you do this?
I want to do this, without spending too much time on this activity. Is there any particular tool or are you doing it on self-developed tool?
3 Likes
has your deep value portfolio always outperformed your overall portfolio? Do you plan to increase your deep value allocation?
Hey Harsh currently Ashok Leyland is trading at around1.2x sales and also with regard to EV theme they have a subsidiary Switch mobility but they have not scaled EV business considerably, with possible fame 3 policy targeting commercial utility vehicles as this is actually the industry that makes the best economic sense as usage is high and EVs have low running cost, my only concern with the lack of scale.
What are your thoughts on this business?
Great performance Harsh .Well done .Your stick picking skills are amazing
1 Like
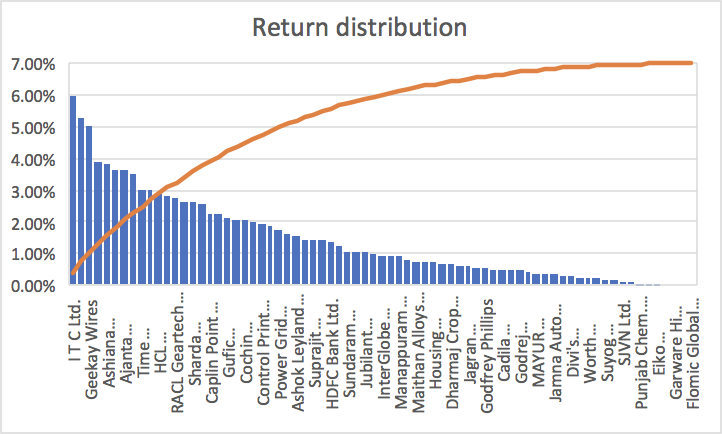
Returns have not been very concentrated, its not like 3 stocks account for 50% of returns. ITC has been the biggest contributor so far, accounting for 6% returns, and you can see how the distribution looks like below.
Another way to look at it is what % of my folio returns is accounted by #1-5 stocks, #6-10, and so on.
| Stock ranks | % returns |
|---|---|
| # 1-5 | 24.20% |
| # 6-10 | 16.95% |
| # 11-20 | 25.24% |
Some more statistics to chew upon:
Total stocks invested in: 89
Stocks in losses: 16
Cumulative losses from these 16 stocks has been 6.65%, ITC alone has contributed to 6% returns. So almost all losses have been struck off by ITC.
The hit ratio of 82% is abnormally high because we are in the middle of a bull market. I hope I can maintain this ratio over 65% over a period of time.
I hope the above statistic answers your question.
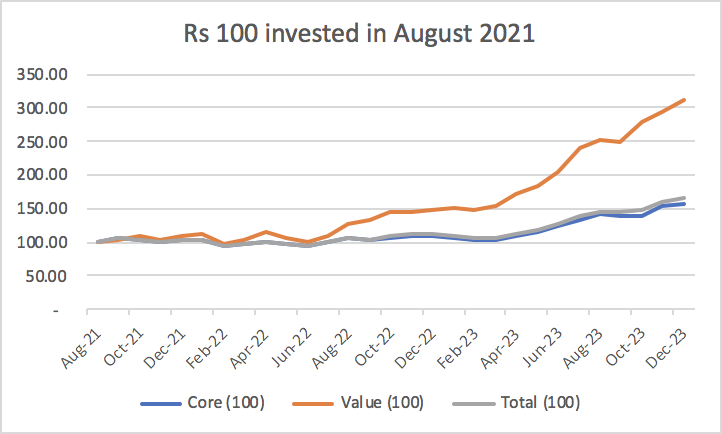
I only started tracking performance of deep value from August 2021. Before that, I used to make token investments as I wanted to get comfortable with the idea. Since 2021, this part of portfolio has generated IRRs of 75%. Its highly highly unlikely that future returns will look like this as I scale up this segment, but I do plan to scale it up.
I have 100s of concerns about Ashok Leyland, but scaling up is not one. Its 2nd largest CV manufacturer in India with a very wide distribution network. EV scaleup is just a matter of time.
11 Likes
Hi ! SATIA INDUSTRIES - In paper Industry , Co has grown really well over the years , Profit growth in 3years 28% , Sales growth 3Years 32 % , even institution has also increased its holding but Price to Earning ratio of the Company has not shown re-rated . It is available at less than median PE of 3 years , and If we look at whole Paper Sector Co.s their P/E Ratio are very low So Why Its Like That ? Any Views?
3 Likes
Yes. It definitely looks like a value buy. But I am slightly worried about their peak margins. Paper, being a commodity, has very high chances of mean reversion.
My personal opinion
dr.vikas
4 Likes
Hello @harsh.beria93,
Congratulations on the great performance and detailed analysis.
As you are largely invested in Small caps, Nifty might not be the best benchmark. You can create a portfolio market cap weighted benchmark : 60% * BSE Small Cap+ 20%* CNX Midcap + 20% * Nifty etc. based on allocations.
Another option is to compare with the leading PMS’ with consistent long term compounding. Your true opportunity cost lies there as you are unlikely to simply pick a Nifty index fund if not investing on your own.
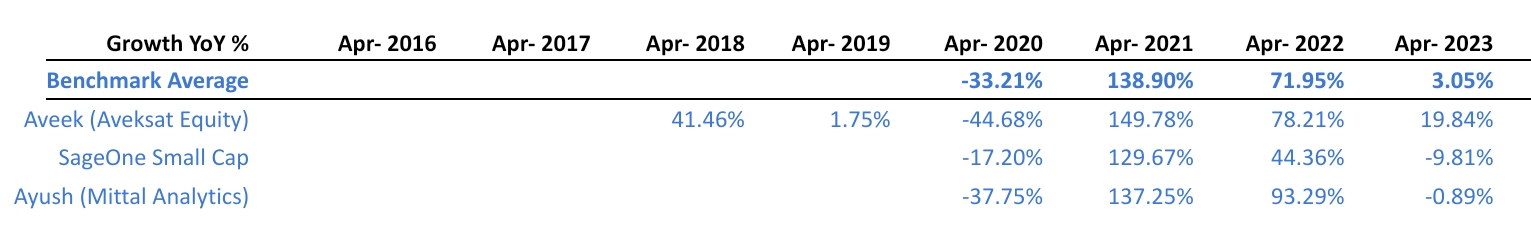
I use an average returns index from the 3 funds
- SageOne Small Cap
- @aveekmitra’s Aveksat Equity
- @ayushmit’s Mittal Analytics
Once again Congratulations for your great research and coverage across such broader areas with ever increasing circle of competence.
16 Likes
Hi @harsh.beria93 ,can we use the monthly return formula for calculating returns of a particular year as well since the cash inflow/outflow happens throughout the year?
1 Like
Harsh sir i am new to investing, i saw your recent interview on SOIC channel and for me both you and Ishmohit Paaji are gem, in terms of teaching, hope one day i will also do good under the teachings of both of you.Thank you for sharing your thoughts regularly.I just love your honesty and dedication level.Thank you
16 Likes
great job, beating the index consistently would be the key. thanks for sharing.
2 Likes
Harsh thank you for sharing your thoughts and portfolio…i have been your fan of your stock pickings…it has been a inspiring to watch you grow…Great work…
1 Like
Thanks for sharing your thoughts, more than benchmarking my thought is to look at opportunity cost. I have shared my thoughts on this earlier (see link below). My internal benchmarks are Nifty, Banyan Tree and MAPL as these three capture most styles that I like. I also used to benchmark against few other PMSes like 2Point2, Sageone, etc. but stopped doing that because my results were much better, especially during bad markets and most PMSes do well during good markets, and then give up a lot during bad markets. For e.g. during FY20 my folio went down by 17.38% vs average PMS losing between 30-50%.
There is only 1 PMS I know that had limited their downside during 2020 fall and yet matched the subsequent rise (Stallion). However, their style is quite different, they are very nimble folks and thats not my style.
You should only do it at smaller time frames, for longer time frames just compute IRR. Its more accurate.
16 Likes
Hey @harsh.beria93 Thanks for sharing your knowledge with us. Just curious which tool have you used to generate this Return Distribution chart - plug numbers into excel or somethign else?
1 Like