StageInvesting +Elliot Waves

M & M Finance

CMP-211

Can it go back to old glory in this tipsy -turvy market!

Well, let’s keep a close watch. Daily/Weekly/Monthly MACD is in buy mode .

On EW presepective, it seems to be in its 3rd wave.

Question is whether iii rd of 3rd has started ? Let the first confirmation comes ie. crossing and closing above 61.8% retracement levels of recent decline.
Monthly chart

From stage analysis prespective , it seems to have entered stage 2 again but with lot of resistances on left-hand -side. In short, the journey on upside ( if it begins ) would be slow and checkered.
Weekly Chart

Disclaimer:Chart for study purpose only. No recommendation, no suggestion. All of the above projecition might go completely wrong.

TNPL

CMP 213

Seems to be in 3rd wave and now in iii rd of 3rd.

Monthly as well as Daily MACD is in buy mode. Weekly MACD is about to cross towards buy.

Immediate resistance should be APRIL high of 227.

On weekly charts, it seems to be in Stage 2 . Breaking of upper channel (at 220) would be additional confirmation of the upmove.

Disclaimer :Charts for study purpose only. No recommendation, no suggestion. All of the above projecition might go completely wrong.

1 Like

USHA Martin Follow-up

Started covering it from 118 levels- about 28 days back . Now at 150.

Previously touched 140 and came back …today crossed it with lot of force- volume as well as price movement.

Next resistance is 165 - previous ATH…once that is crossed ,then it would enter blue-sky zone…no resistances on left , once DANAGER of overhead-supply gone then it can fly.

Disclaimer: Invested and biased. Opinions are personal, no recommendation,no suggestions.

3 Likes

POLYPLEX

Thanks for explaining in details. Can you please provide your view on POLYPLEX?
Is it good for 6 months to 1 year hold?

Thanks

Disclaimer : Have invested at lower levels

2 Likes

Thanks for checking.

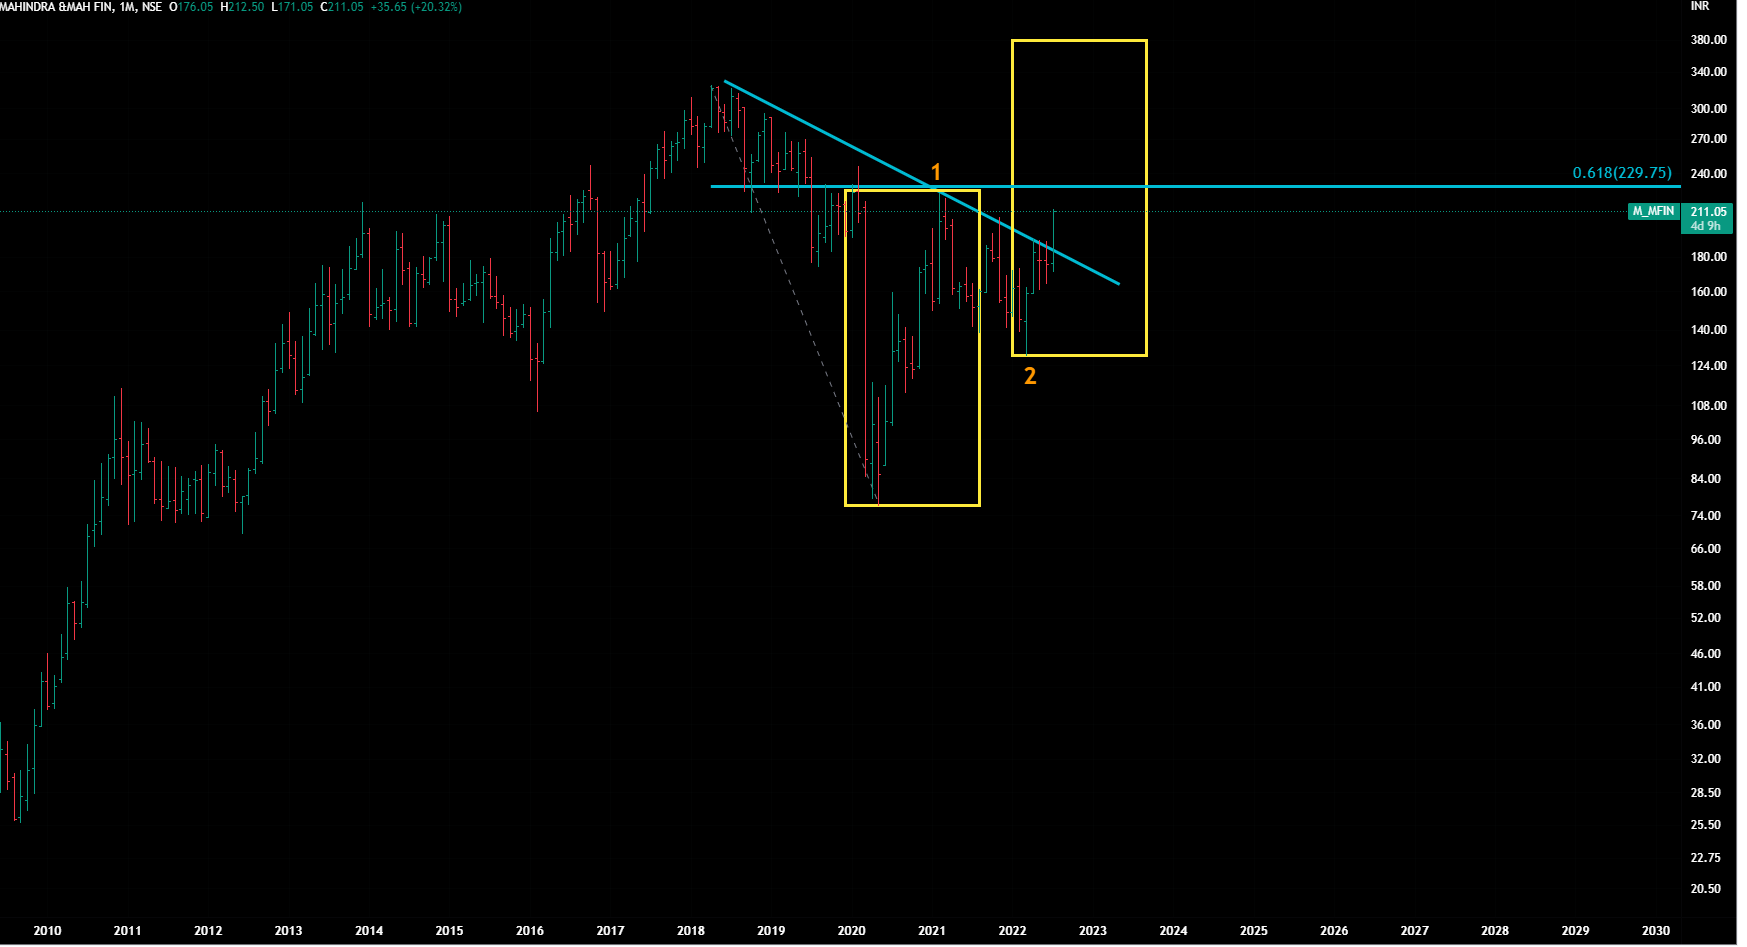
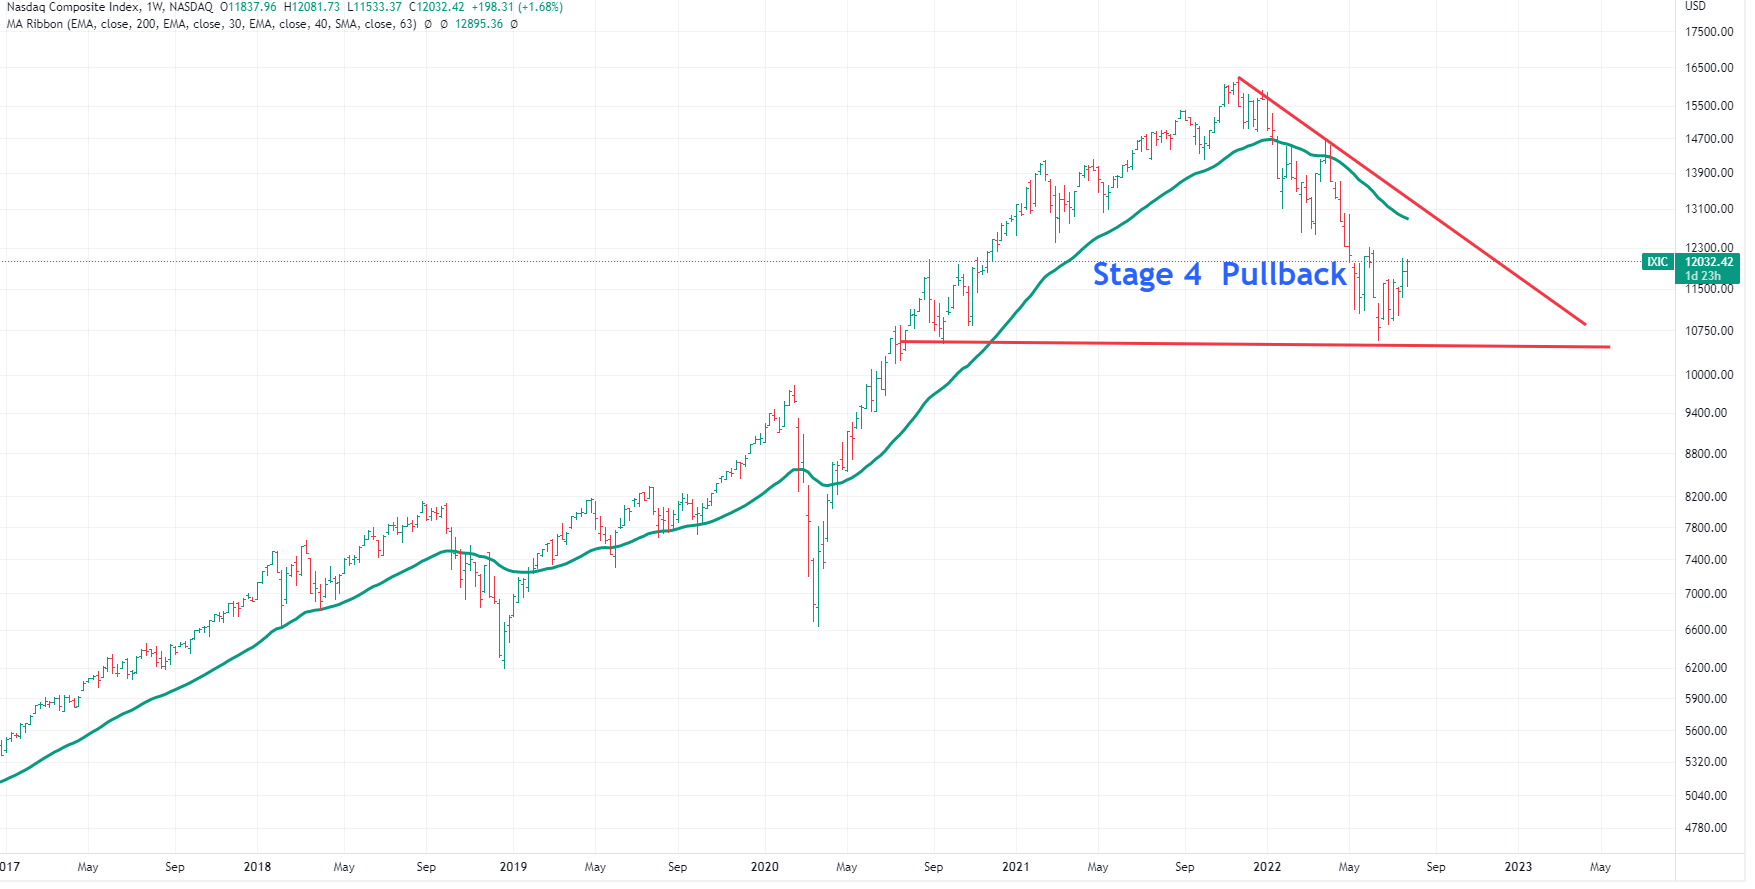
1st one quick insight- stock-price of every company moves into cycle (we all know that ) . Now during down-cycle , it has two elements ( a) price-correction (b) time-correction ( price moves with -in a range) . Stronger the company, longer the time -correction and lesser the price -correction . The purpose of both of these type of corrections is to frustrate the non-serious investors , the free -riders (in layman’s terms) .
Many a times when price runs ahead of earnings (due to future growth projections), either the price should correct or it rests in a range to catch-up with earnings growth.

PolyPlex - Quick check.

Please keep in consideration that we don’t comment on day-to-day movement of prices - we tend to look for mid-to-long term trends .
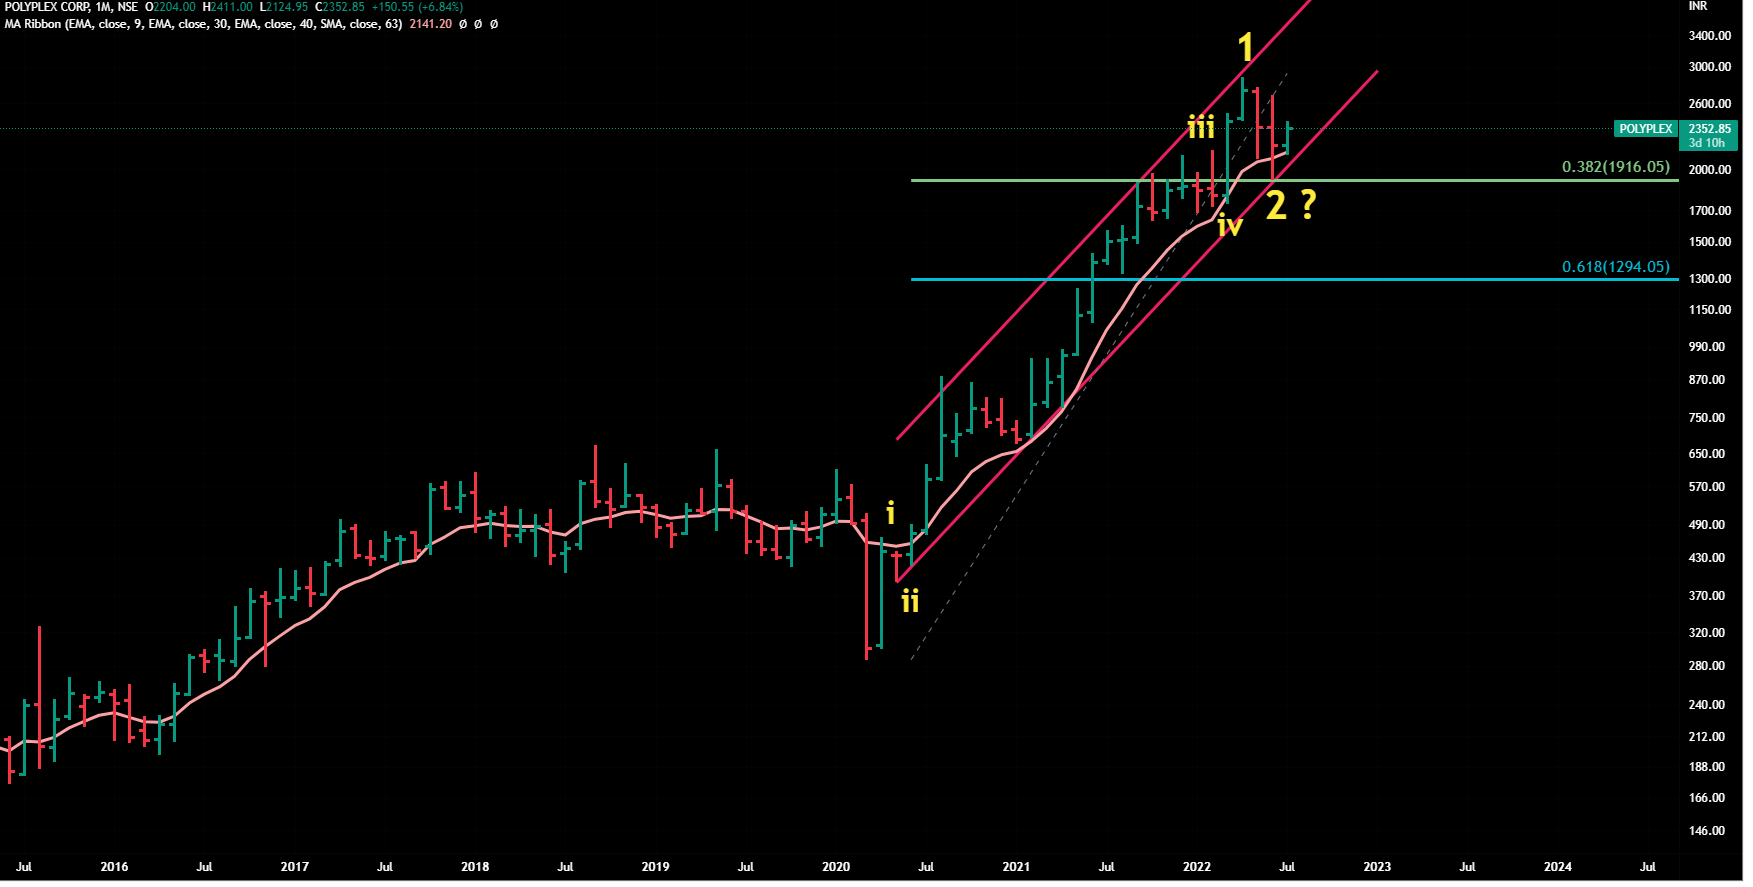
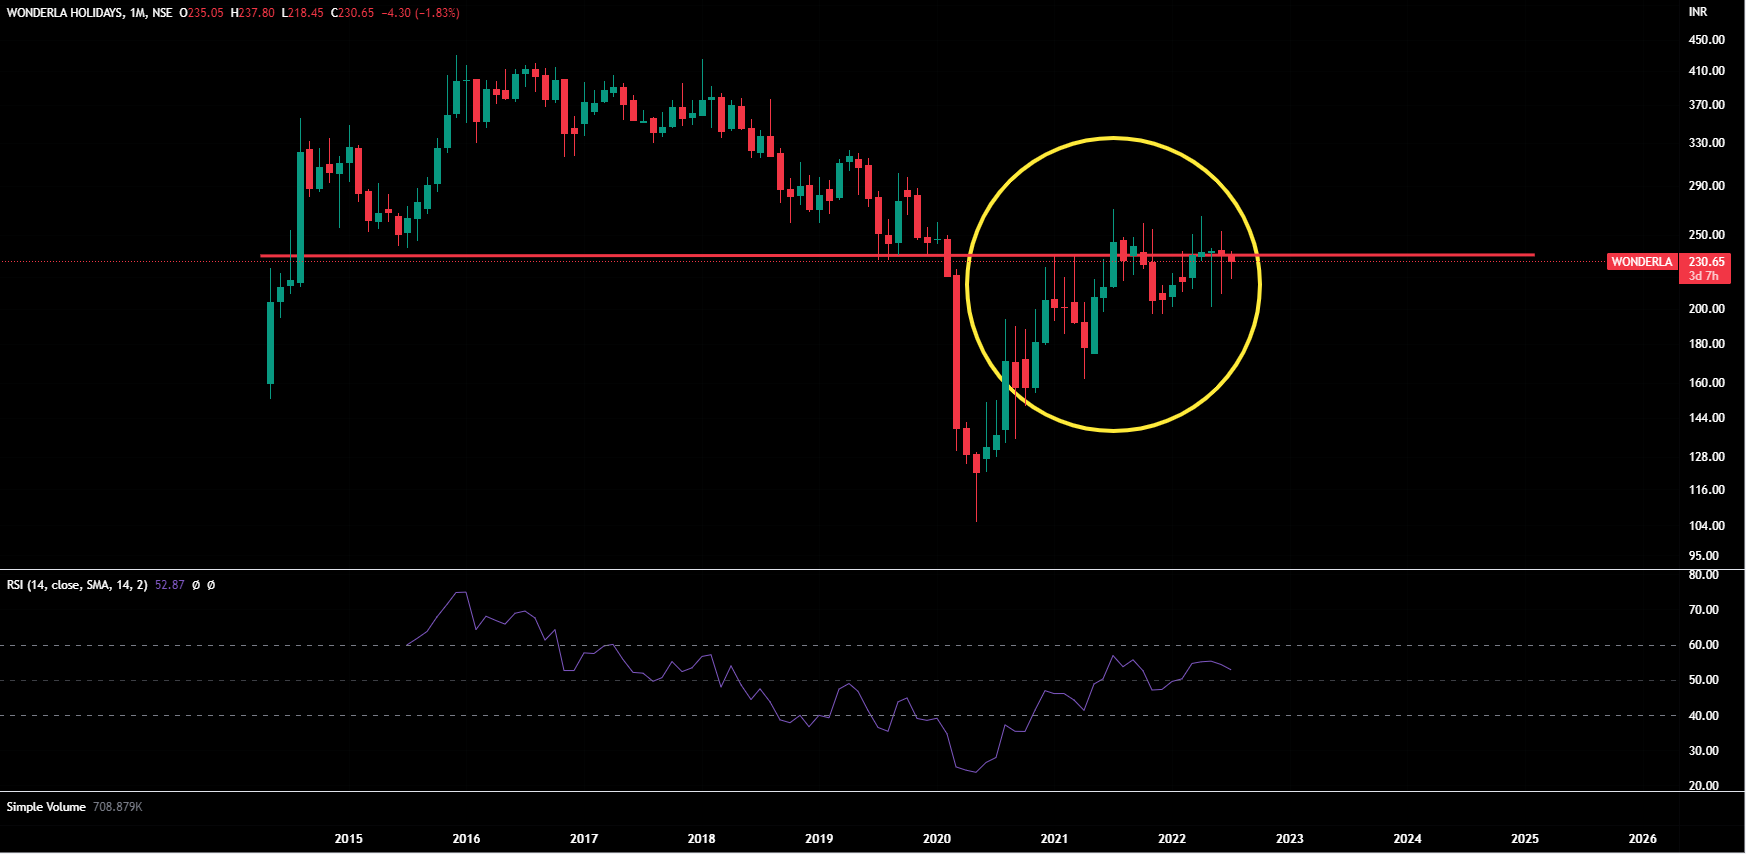
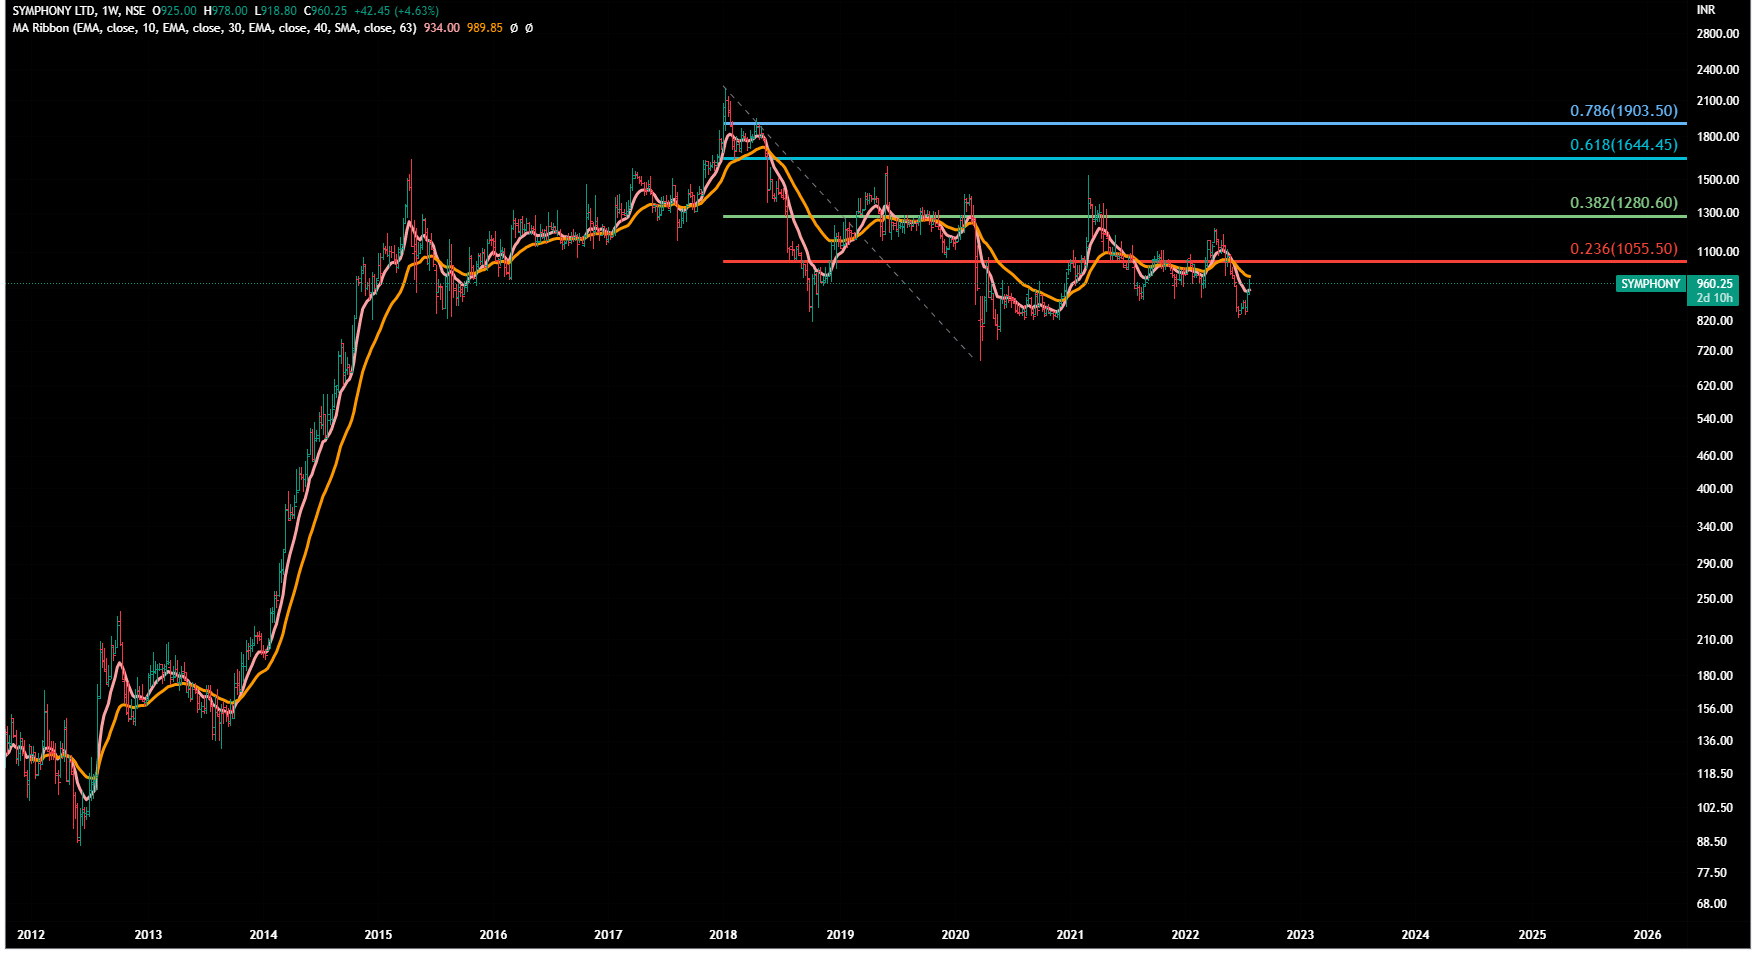
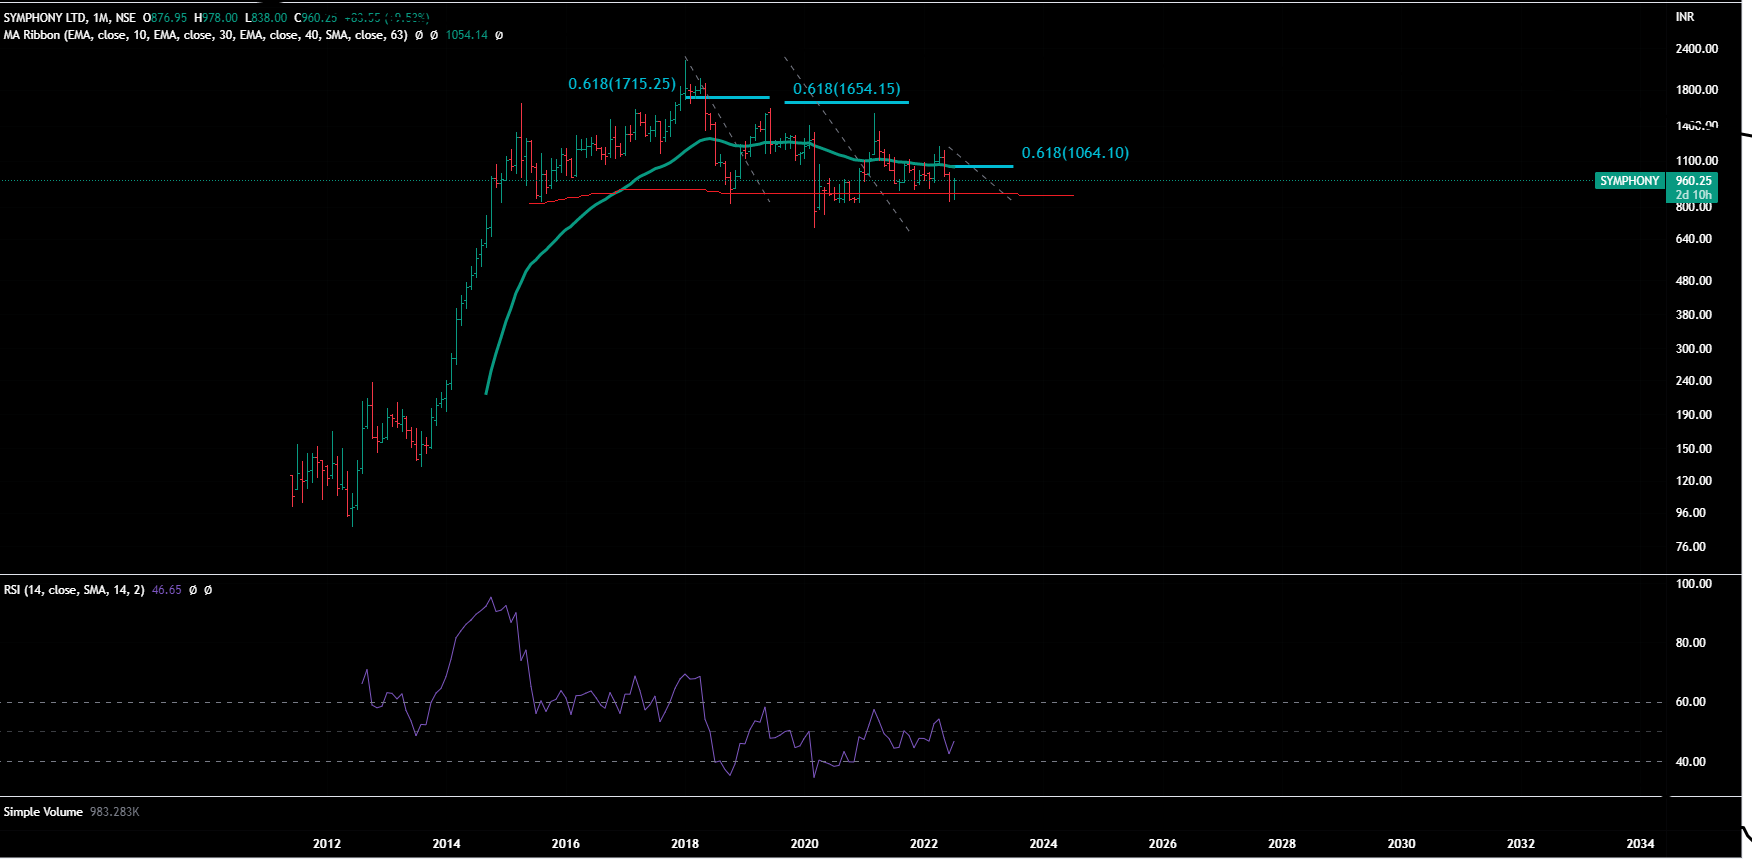
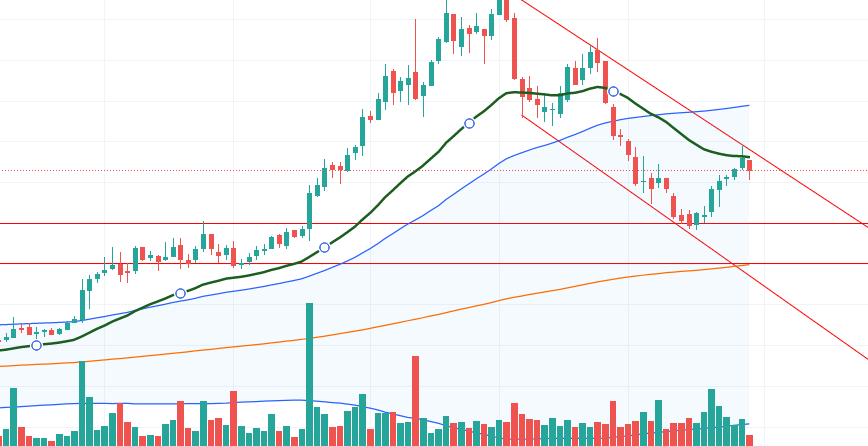
Monthly Chart

It is a beautiful chart - moving in a channel from May 2020 – did not break the channel even in recent correction. Also it is moving above 9 months moving average (pink curve) , came below it in June but did not close below that and also took the channel support at the same time and bounced back.

Other point to note here is that it corrected upto 38 % of FIB level ( of the rise from Covid lows to ATH).This is also a good sign. In these type bear markets, many a times stocks tend to correct upto 50 -78 % levels . If the stock corrected upto 38% level only, that means it is in strong hands ( big money)
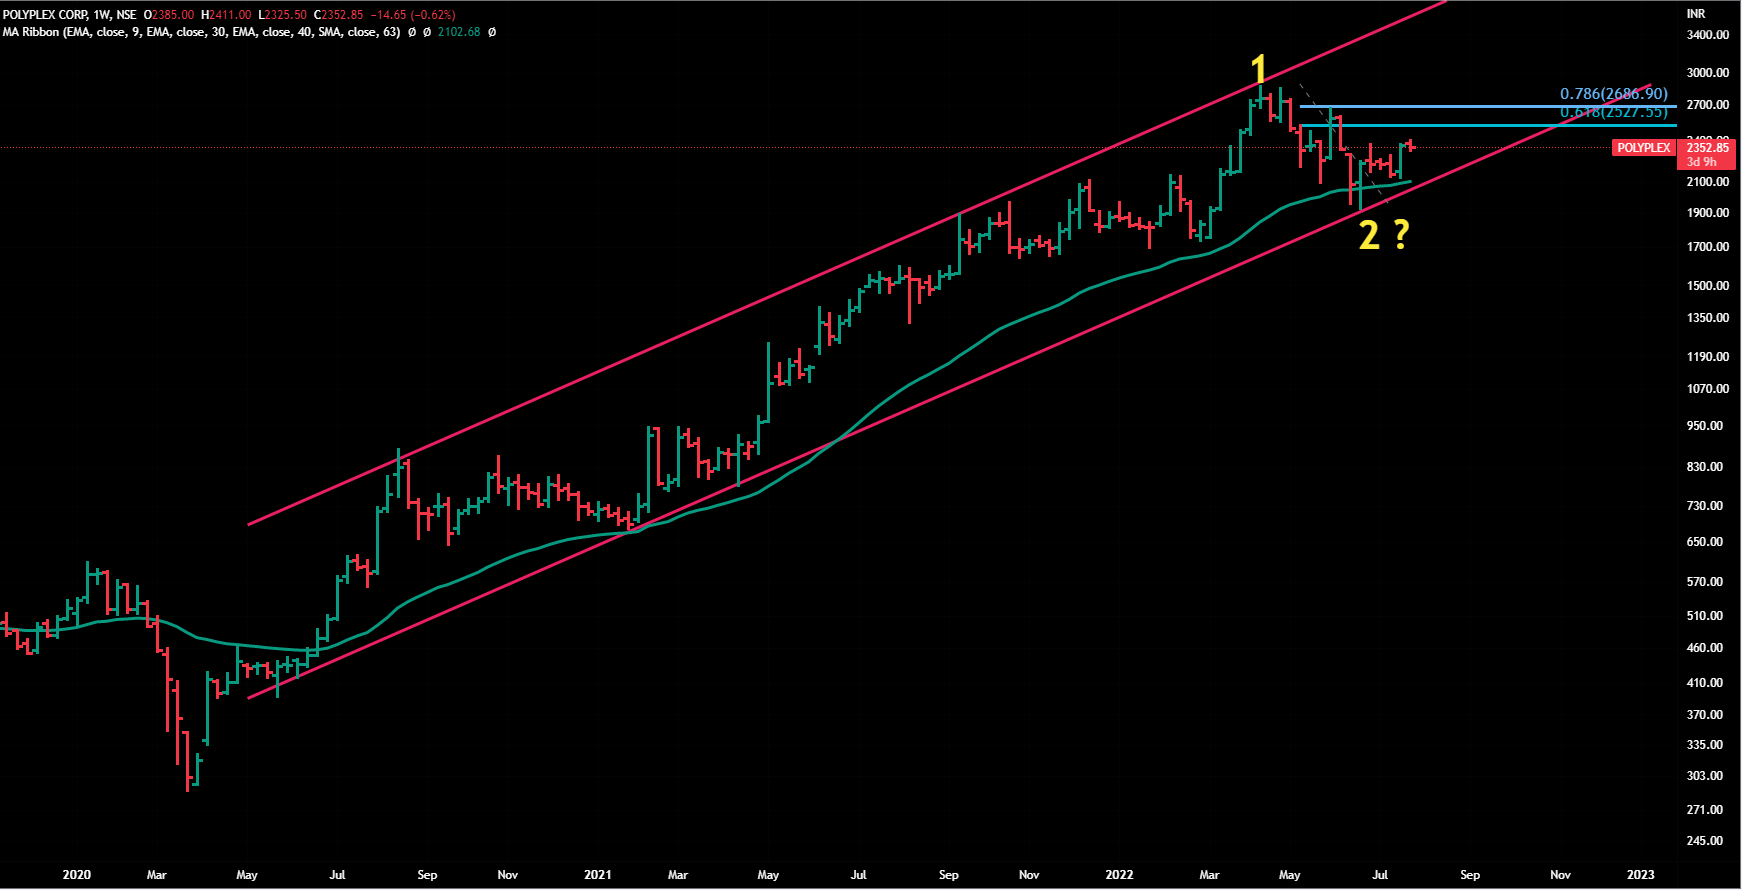
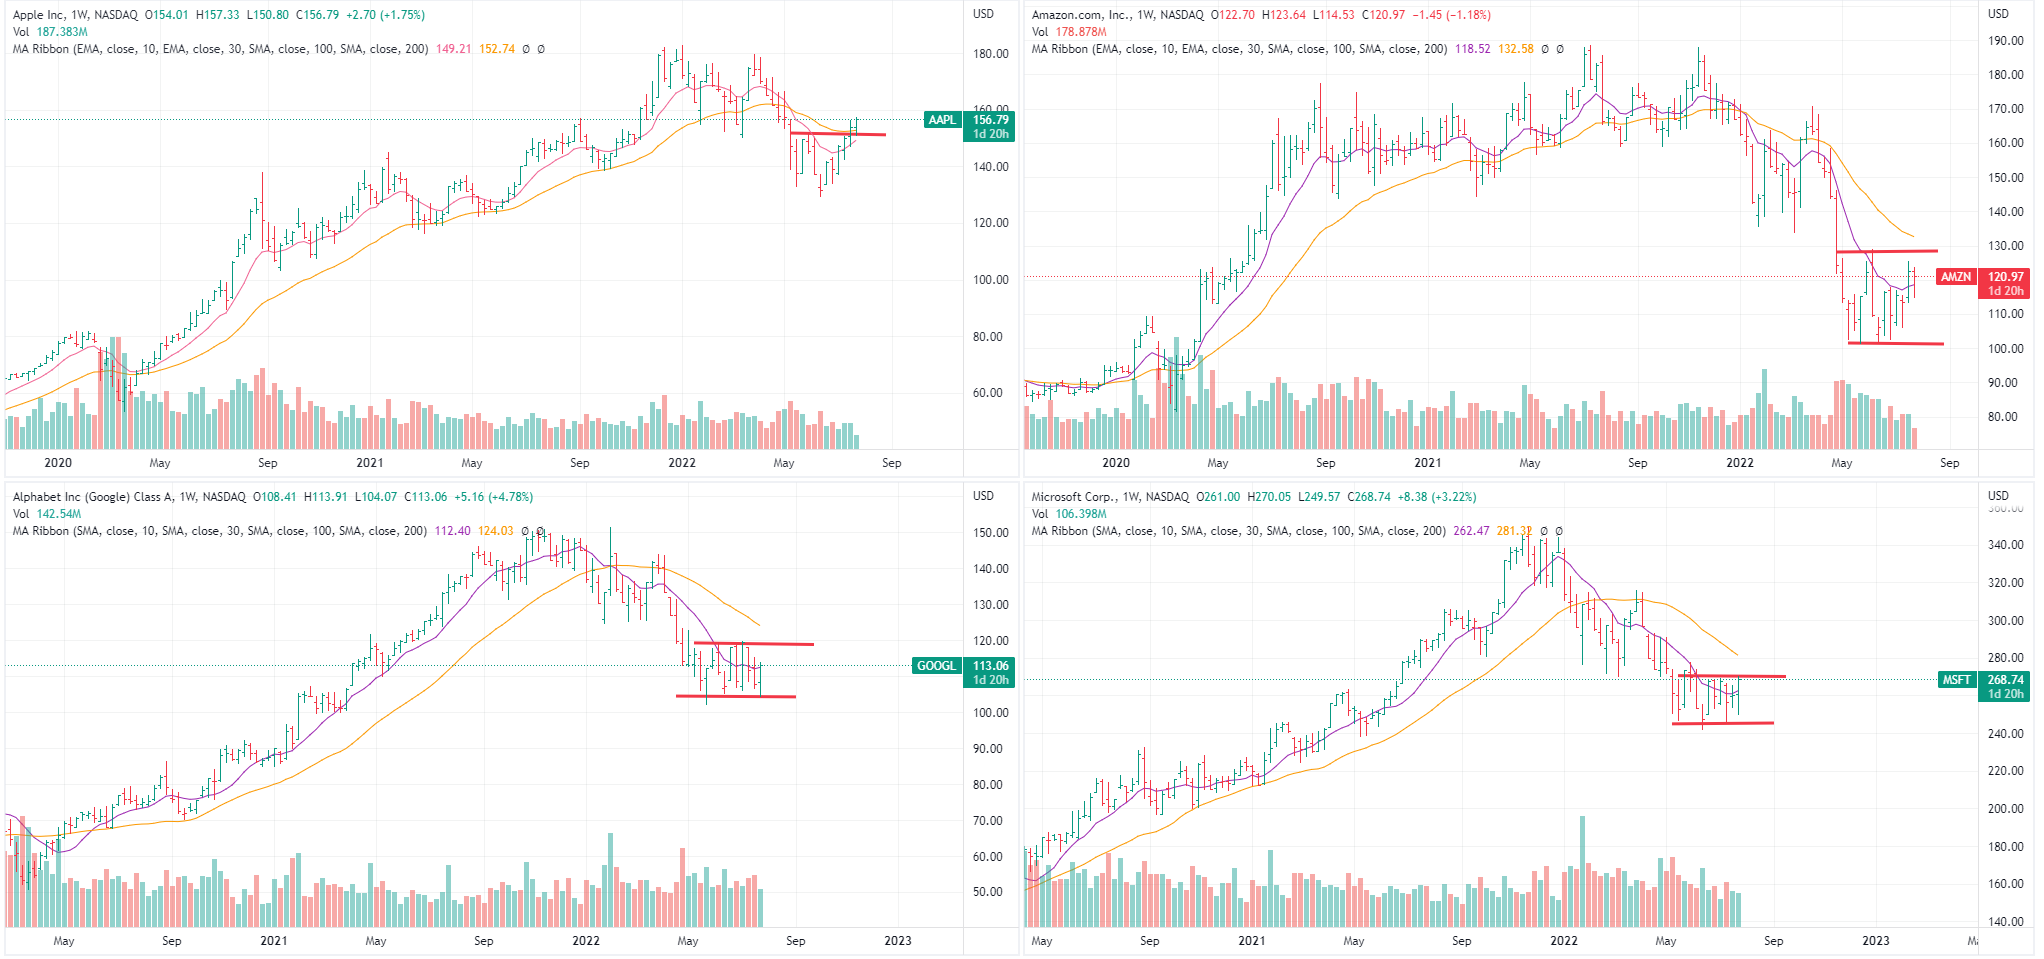
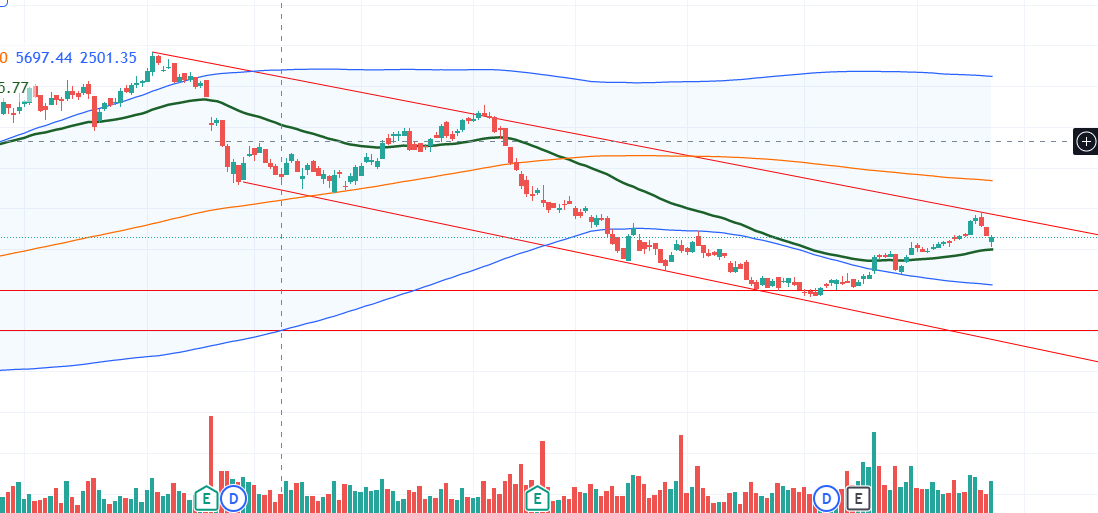
Weekly Chart

On weekly, it is taking a support at 40 week moving average (green curve)-never closed below it since the days of COVID lows.

What can happen next ?
Stock became more than 10 X from covid-low levels. To us, it seems to be in time-correction as of now ( it seems price correction won’t be much) , can move in a range between 2000 to 2500 for next few months.

Can it go up ?
Well it depends upon liquidity in the market and overall sentiments .For moving up, it should first trade and close above 61.8% & 78 % level of retracement of current decline ( 2530, 2700 respectively as shown on weekly chart) and then it should cross and close above recent ATH for few weeks.

Can it go down ?
Anything can happen in the market !

If we were at your place, we would track it weekly and monthly. We would draw a channel as well as would use weekly and monthly moving averages as pointed out in the charts.

On every weekend - we would check that it does not close below 40 week moving average for more than 2 weeks, and it does not close belwo the channel.

On every month-end - we would check that it does not close below 9 month moving avergae for more than a month and does not break the channel.

If we were holding this stock from lower level, we would keep it holding it for long term as overall structure looks good. And if we were not holding this stock, we would try to buy when it again comes close to lower end of the channel and track it closely before adding more or exiting.

Disclaimer : Charts are for study purpose only. Opinions are personal- can go very wrong. No suggestions , no recommendations.

5 Likes

Wondrela Holidays

All signs of a should-avoid stock!

Many a times technical -analysis skills can help you to keep away from highly recommended, highly tracked ,high pedigree stocks.

This one falls in that category.

A quick look at the monthly chart can tell you a lot of things :grinning:

a) Look at the size of the upper wicks of the candles ! Sellers come running in as soon as it tries to move up.

b) A storng resistance ( red line) , that happened to be a support -level till Dec 19.

c) RSI never went above 60 on monthly charts for the past 5 years- above 60 RSI indicates that there is momentum in buying interest .

c) All upside movement from Covid -lows is overlapping, no clear impulse wave ( as per EW)

On weekly chart - as per stage analysis, lot of up & down movement around key moving averages (10WMA,30 WMA) , Not able to break the trading range for ast one year.

In short - Basic technical-analysis skills can help oone person to stay away from traps.

Disclaimer : Charts are for study purpose only. Opinions are personal, can go wrong. No suggestions ,no recommendations.

6 Likes

Ujjivan Finance - Follow-up

Covered 8 days back at 156, CMP 174.

Today H & S got active - target for H & S is 220 .Key resistance is at 185.

Disclaimer: Charts are for study purpose and to track the probabilities… They may or may not work.

Bear Market Rally -Where are we now?

Checked few key indices - it seems either this short term rally is over or we’re at a very crucial juncture, a small push and Humpty Dumpty would start coming down .

Today’s Fed meeting may give it final direction on either side.

In short, time to be very cautious. Cirrently all stock-set-ups are in danger zone.

Midcap Index - MACD in sell -mode, could not cross 61.8% of recent decline, at the brink of breaking the rising channel.

Smallcap Index - Triple top type of formation, could not cross 61.8% of recent decline, at the brink of breaking the rising channel.MACD yet to cross toward sell !


Realty Index - MACD in sell -mode, could not cross 61.8% of recent decline, at the brink of breaking the rising channel.

Nifty Pharma Index - MACD in sell -mode, could not cross 61.8% of very recent decline, breaken the rising channel.

Power Index - MACD in sell -mode, could noy cross 61.8% of recent decline, at the brink of breaking the rising channel.

In summary - time to be extremely catious because it was all about FED money from 20008 to 2021.

Disclaimer :Charts are for study purpose and to track the probabilities… They may or may not work.

5 Likes

Symphony
Another stock that falls in my should-avoid list.

Weekly Chart :
a) Could not cross 61.8 % of its decline since Jan 2018 (even in 2years bull run)

b) Lot of ups and downs around key moving averages (10 WMA, 30 WMA)

c) No clear impulse (as per EW)

On monthly charts -

a) Trading below 40 months moving average
b) Could never cross 61.8 % of its latest declines (3 times) in last 2 years
c) RSI never crossed 60 in last 3 and half years.
d) Just taking support at a key level -any break from here can be brutal

Disclaimer : Charts are for study purpose. Opinions are personal. No suggestions, no recommendations.

2 Likes

US mkt up by a big % post fed rate hike tonight.

Seems bottom has formed ?

or is it still a bear mkt rally ?

How is Ujjivan Fin, Guj fluorochem, Pitti Elecon Rolex, meghmani org placed technically?

any other pick looking good to buy at CMP?

Too early to say the same.

On stocks , would like to say that we don’t do recommendations. We keep sharing the set-ups we like or dislike.

3 Likes

Out of 4 biggies of Nasdaq, only Apple is showing some strength. Rest are still consolidating with in a range.

US S&P 500 reaction ON -The -Day and The -Day -After a FED rate hike in 2022:

3/16: +2.24%
5/04: +2.99%
6/15: +1.46%
7/27: +2.62%

The next trading day:
3/17: +1.23%
5/05: -3.56%
6/16: -3.25%

Let’s see what happens today.

When we go all in?

Nasdaq 2008/2009 -Stages

Where we are now ?

We wait for the Stage 1 & 2 bases!

4 Likes

Portfolio July 28th 2022
As informed several times before, we are particiapting in this counter-trend rally. Increasing our cash allocation as we get few convincing set-ups.

Currently 50% cash is deployed.

All set-ups of this portfolio -stocks have been shared on this thread earlier.

Allocation is based on our convition lelvels on set-ups and valuations.
Portfolio

Views from veterans are welcome.

Disclaimer- No reco no suggestion.

14 Likes

It came in early July…with the FED July meeting completed with no surprises, the next meeting is in September…@StageInvesting Does this mean, a free run in S&P till the Sept meet?

1 Like

Hi ,
Request your valuable thoughts on Ashiana housing.

Seems, you need to wait till Oct 1, 2022

we may go near 17900 today, on the back of rollicking US markets in last 3 weeks…this was the level called out by @StageInvesting earlier above…y’day was a mega day for Dow and Nasdaq green closures… What happens after this? Is this, the ‘things have to heat up before…’? with everyone know that this is the resistance band and with everyone thinking of that, rarely the majority view coincides with what happens in market…With Stageinvesting user in suspend mode, I hope that other followers will give out their opinions

LTTS failed to break and seems to be firmly in Stage 4.


2 Likes

see how green candles volumes are reducing with increase in price. Buyers are reducing as price is rising…it should have been the other way around.

This is a nice analysis…Holding kopran from some time… Now around these levels… Hoping it recovers soon