
Hi
Do you have any other channel or place where the long term or short term outlook as per the technical outlook and wave theory? DJI seems at an important 200WMA. Learned members outlook will be very helpful.
there was no one volunteering to venture out here and I am sure that this forum is awash with deep tech expertise…come on…the bottom seems to have caved in Dow/Nasdaq and yes…nifty has shown strong divergence but for how long? In the absence of @Stageinvesting, can others with this expertise step in please?
Hi@stageinvesting …used to enjoy your posts a lot in a silent mode. They were so insightful and different from everyone else. Don’t know why you have stopped writing, hope everything is good at your end.
I am an old man, having 25 years of investing experience. These days don’t write or trade much due to health-related issues.
I GOT the following article on a WhatsApp group …it was on the same website that you used to refer to in the past. I found it interesting and learned a few new things. Thought of putting it in your thread as it is in line with your market views that you wrote 2-3 months back, will request your views on the same. Hope they are still the same as the market seems to be playing in that direction.
6 Likes
Exited everything on August 15th.
Carrying only few postions in core portfolio : Tube Investment, Ingersoll Rand, Kennametal,Escorts,Poonawala Finance ,KPIT
Keeping a close watch.
5 Likes
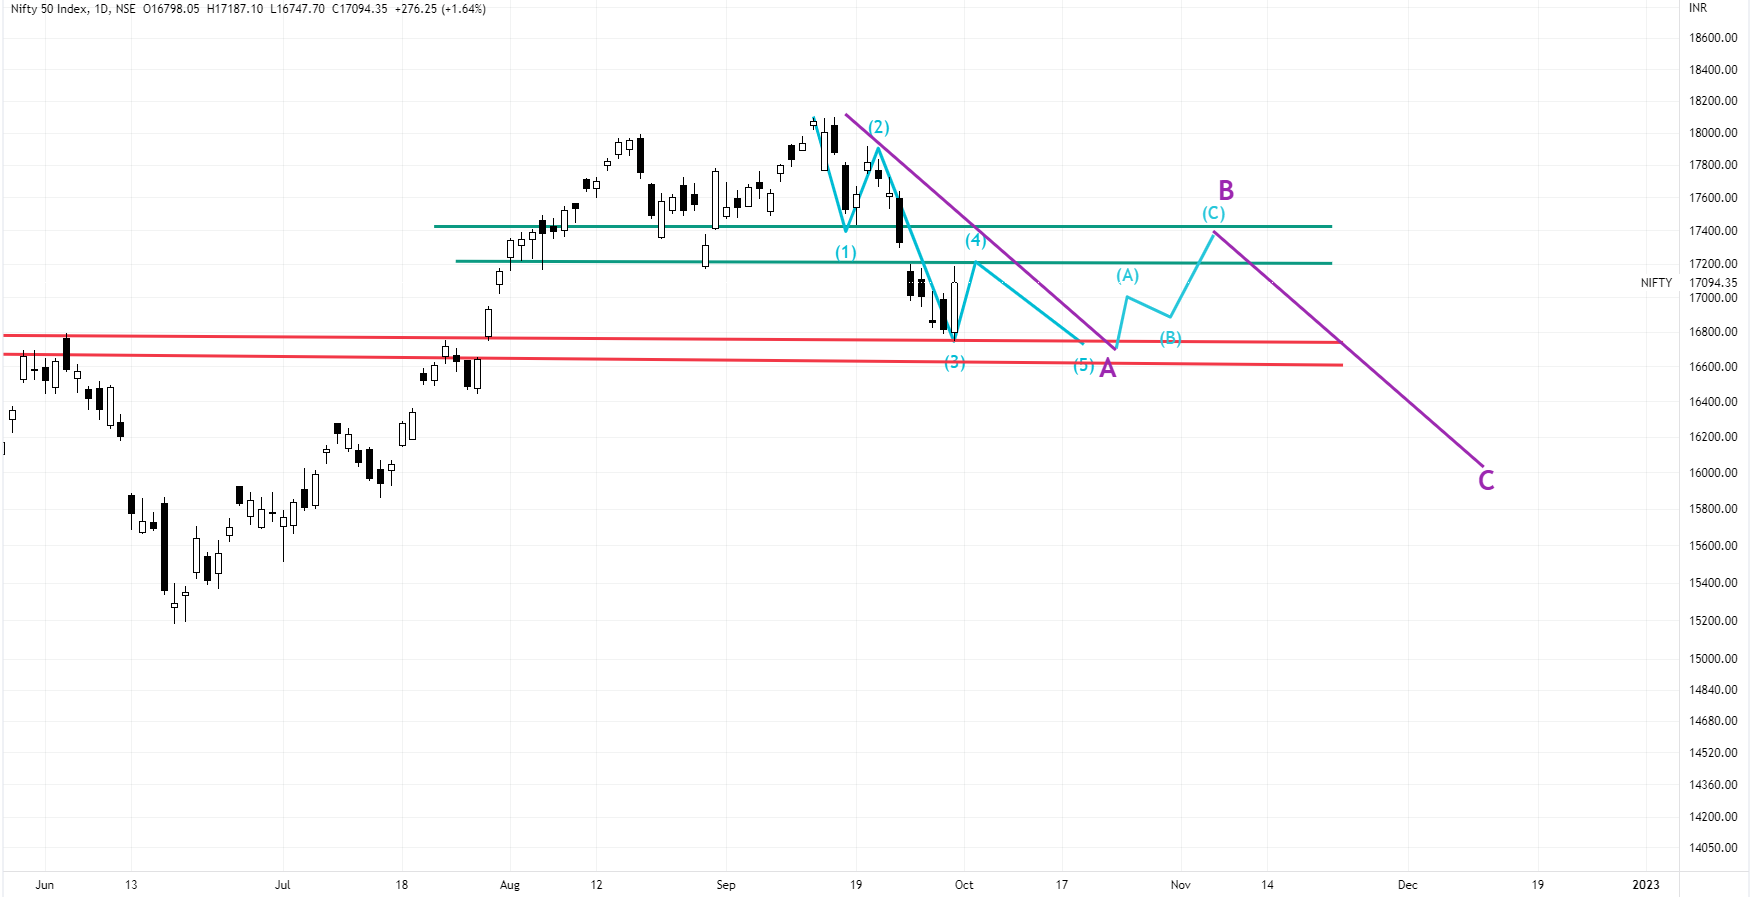
Nifty -Short to Medium Term Expectation
Short Term - Green Zone is important resistance zone for upside…if Nifty does not cross above 17430, we might follow this path . The skyblue lines can be likely the likely route.
Medium Term : Check the purple lines.
Long Term.…let’s review after 2 months whether we stop here or go to near to pre-Covid levels.
Historically Bear markets last 18 to 20 months in India . If we count from Oct 21, already 11 months are over. So best case scnario for bear market to end is April, 23.
10 Likes
For Our Regular Readers
We won’t be providing any stock updates on regular basis but would keep sharing our market views on time-to-time basis.
Our sir has told us not to be direct , not to say anything on SIP, PMS or keep-holding strategy. People don’t like that.
But we would be happy to answer any stock/marekt related query from our readers . Happy Selling ( for the time being, remember temporary bear market rally is over )
2 Likes
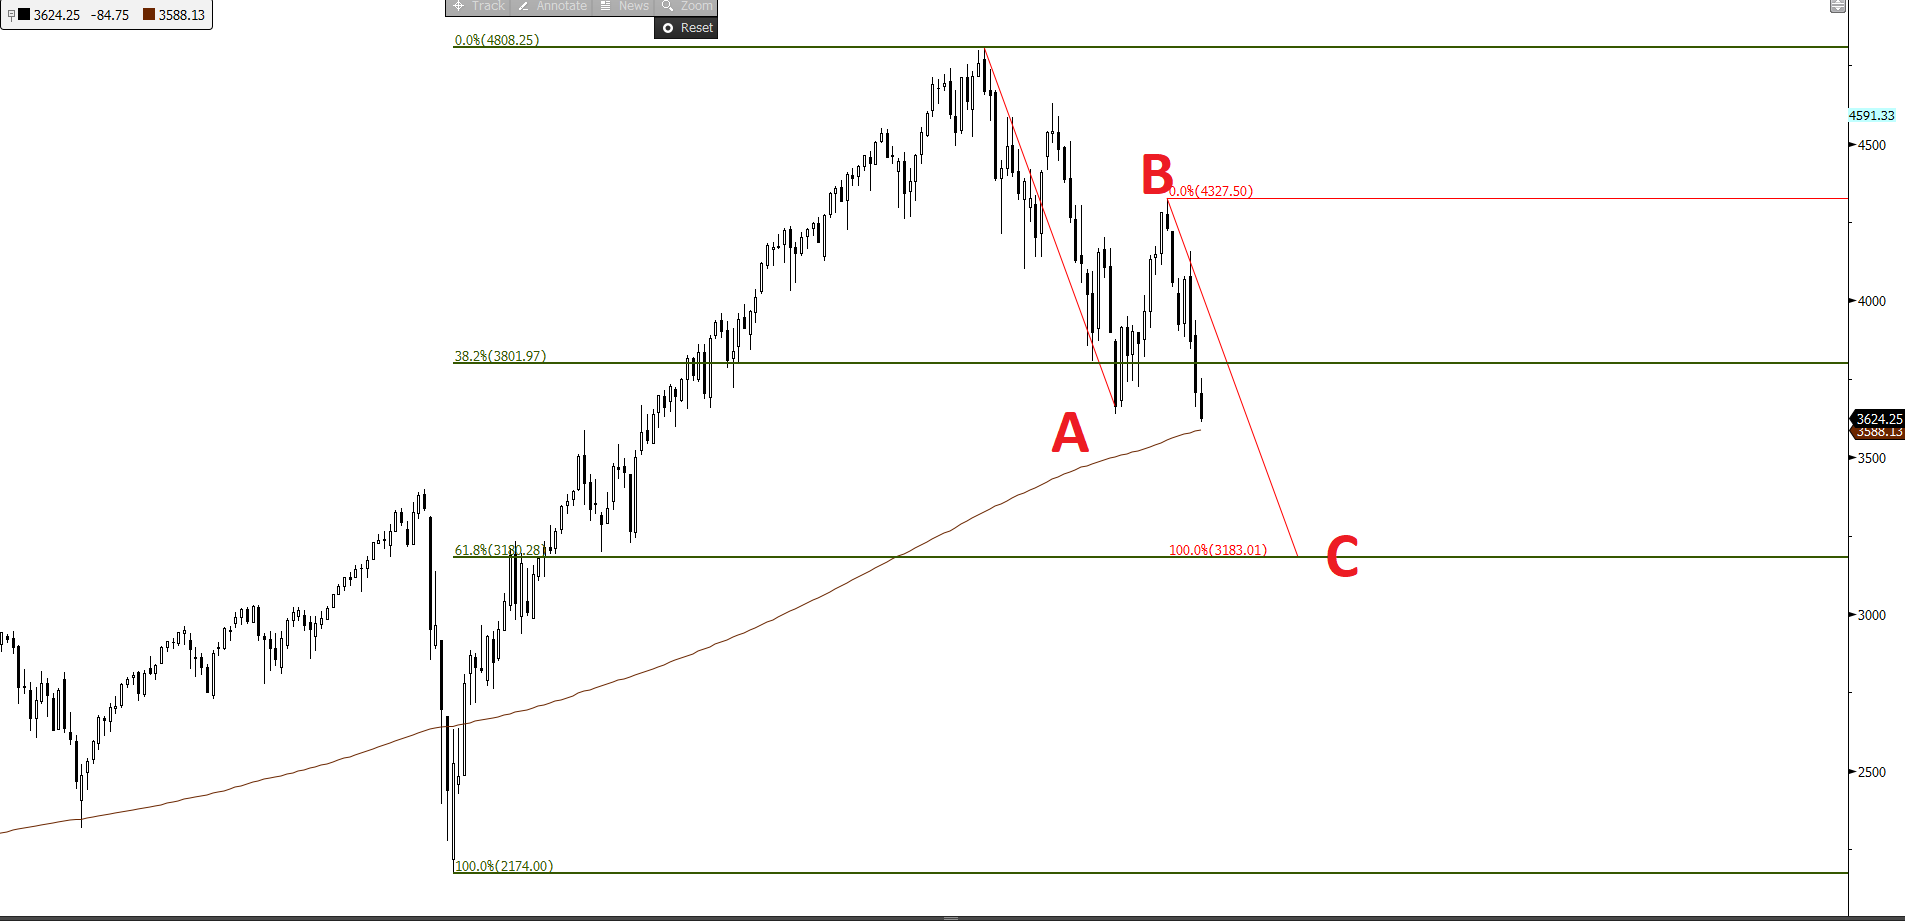
S&P 500
Thanks sir for sharing this .C waves are brutal.
The following chart is US index . It is currently in C wave.
Hope this gives an idea on how C waves are good for bargain hunters.
2 Likes
your posts are very insightful sir , please keep posting insights , Thanks a lot.
Just a view since , Gas price revised has been done from 6$ to 8.2$ per mmbtu. Any view on Oil and Gas cos
Thanks for checking.
In our view OMC companies are not for long term investors . Most of these are PSUs and the margin depends upon government demands on dividend and pricing to customers depend upon political compulsions. Hence we tend to avoid these.
Overall our market view is bearsih for next few months. B wave bear market rally is over . Hence we feel everything (except very few companies ) should correct.
Thanks
Would you by any chance be able to share one for bank nifty as well ?
Thank you
That is super speculative to consider Nifty to go from current 17100 to 12000.
Technical charts of long term are not indicating that, nor any macroeconomic indication to state such anticipation.
When Nifty was 15500, your post was writing it to go towards 12000, but it went just opposite side, 18000.
Now it has fallen to 17000, and long term 12k view still alive ! which is far from objectivity.
I think you are right @kartiks
Wave B ended near the base of wave A, extremely bullish !
S&P/Nasdaq will see wave 3 of C shortly, they probably hv just completed wave 1 of C and wave 2 might begin signifying wave 1 is complete. If they sell off more than Friday, then wave 1 of C is still ongoing, although unlikely. We will know shortly.
India wave 1 of C is probably getting completed and we will know it in 2-3 more market days. If so it can’t rally a lot as there is not much room else it risks breaking the entire pattern.
So even if we might be in wave 2 of wave C, and heading towards 3 of C which is supposed to be the most devastating the entire market is generally still very very BULLISH.
So we might see a-b-c done while still remaining bullish
I think the fall will come but it will arrest near June lows or thereabouts
The bull market that follows then might be very lucrative
This is the problem of not reading the full thread and selective atttention.
Let’s try to help you by quoting few earlier posts of this thread where we clearly talked about a B wave rally and levels of 17900- we call it bear market rally.
And we played the rally and we shared the portfolio for counter-trend bounce!
Here we talked about tradeable rallis of the bear market
Here we talked about possibilities of reaching 17900
Core Point : We are not God. We work on broader trend . Then we work on short term trends .And the issue with any technical study is that it can predict a trend but not the time.
On speculation Keep in mind , every decision ,every thought that is related to future is speculative in nature .
On we being God We can always go wrong ,we’re not God. Luckily everything here is in open . We were banned for 2 months otherwise we would have given more insights during bear market rally. Luckily most of our projections on the stocks in this thread,have worked well except in 1-2 cases (out of 50-60)
On going to 12000 If you see our today’s post, we are expecting index to go to 14200. An we have clearly mentioned that we would reveiw it after 2 months.
Request :Take everyone’s view with a pinch of salt . Also let’s start to learn appreaciating as well .It is very easy to criticise ( that too by not understanding the full thread)
9 Likes
Hi Sir,
extremely informative posts by you. I am also a big fan of technical analysis but a even bigger fan of tracking macro events.
When nifty was close to 15k and every was expecting it to go to 12k I was pretty sure it will not go below 15k but I posted this logic on different platform. I cannot share screenshot here otherwise it will look promotional.
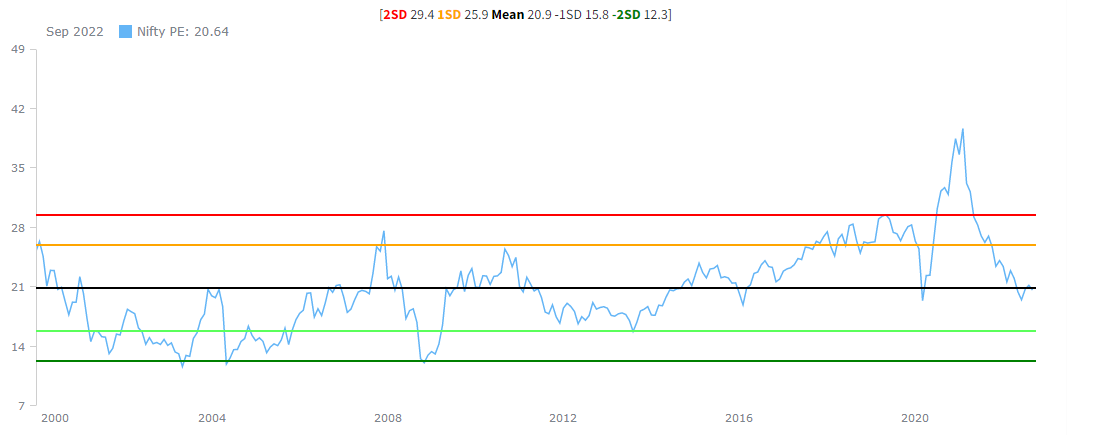
My logic why nifty cannot go below 15k but in coming time will touch 16k.
- Current nifty EPS is 837 and by this year end it is going to be above 850 minimum.
During covid we had lowest PE of 18.74 and today our economy is way ahead from that
period. So even if I take the worst case and a PE of 18 the price comes out to be 15300.
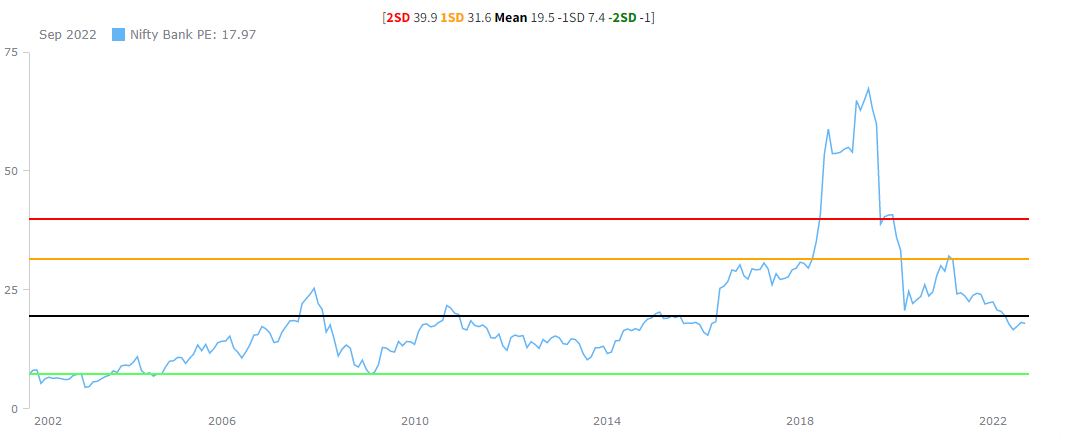
This is nifty 50 chart with median of 20 and the green line which is a buy zone is 17PE.
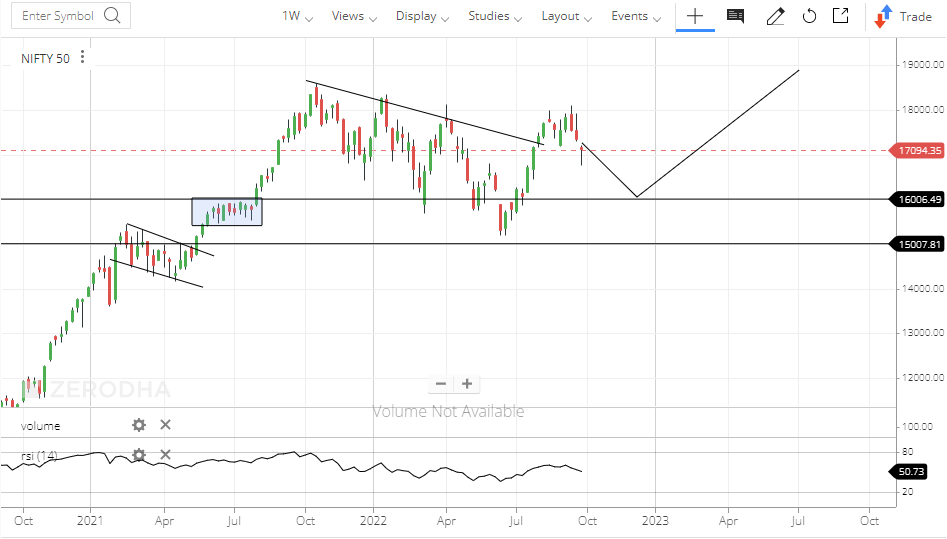
Moreover 15k was a breakout region from earlier consolidation so acts as a strong support. If you also see nifty has broken the recent consolidation channel. Current fall till 16k can be a retracement and thereafter nifty can go towards all time high.
-
Bank nifty is even stronger than nifty. Their EPS is going to be more than 2300 at least
Their PE is below covid level and we can se that the PE is tending upward from last 15yrs. Even if I take a pe of 15 here price comes out to be 34500. -
NIFTY IT has already been punished too much and further downside from here is very
much limited -
Nifty has a gap at 16k and current weakness can be extended to that level but 16k is a strong support. Bank nifty has a gap at 36k and 34500. I expect bank nifty to test 36k
in the recent downtrend and worst case 34k. NIFTY IT has a strong support at 25k so the current fall can be extended to that level.
I would love your view on why you see NIFTY going below 15k despite earnings going up.
I am extremally openminded I would love your view.
6 Likes
But sometimes , market also overshoots on downside which has happened in past , so there can be a chance of it going to 14k-15k Band ,but looking at geo political tensions i will give bearish views higher probability
We probably finished Wave 1 of C, not much room for wave 2, wave 3 might be deep but they don’t all move so fast, bank nifty will probably spend 10 days completing wave 2 and then rug pull but I think it won’t be more devastating than wave 3 of A wave
1 Like
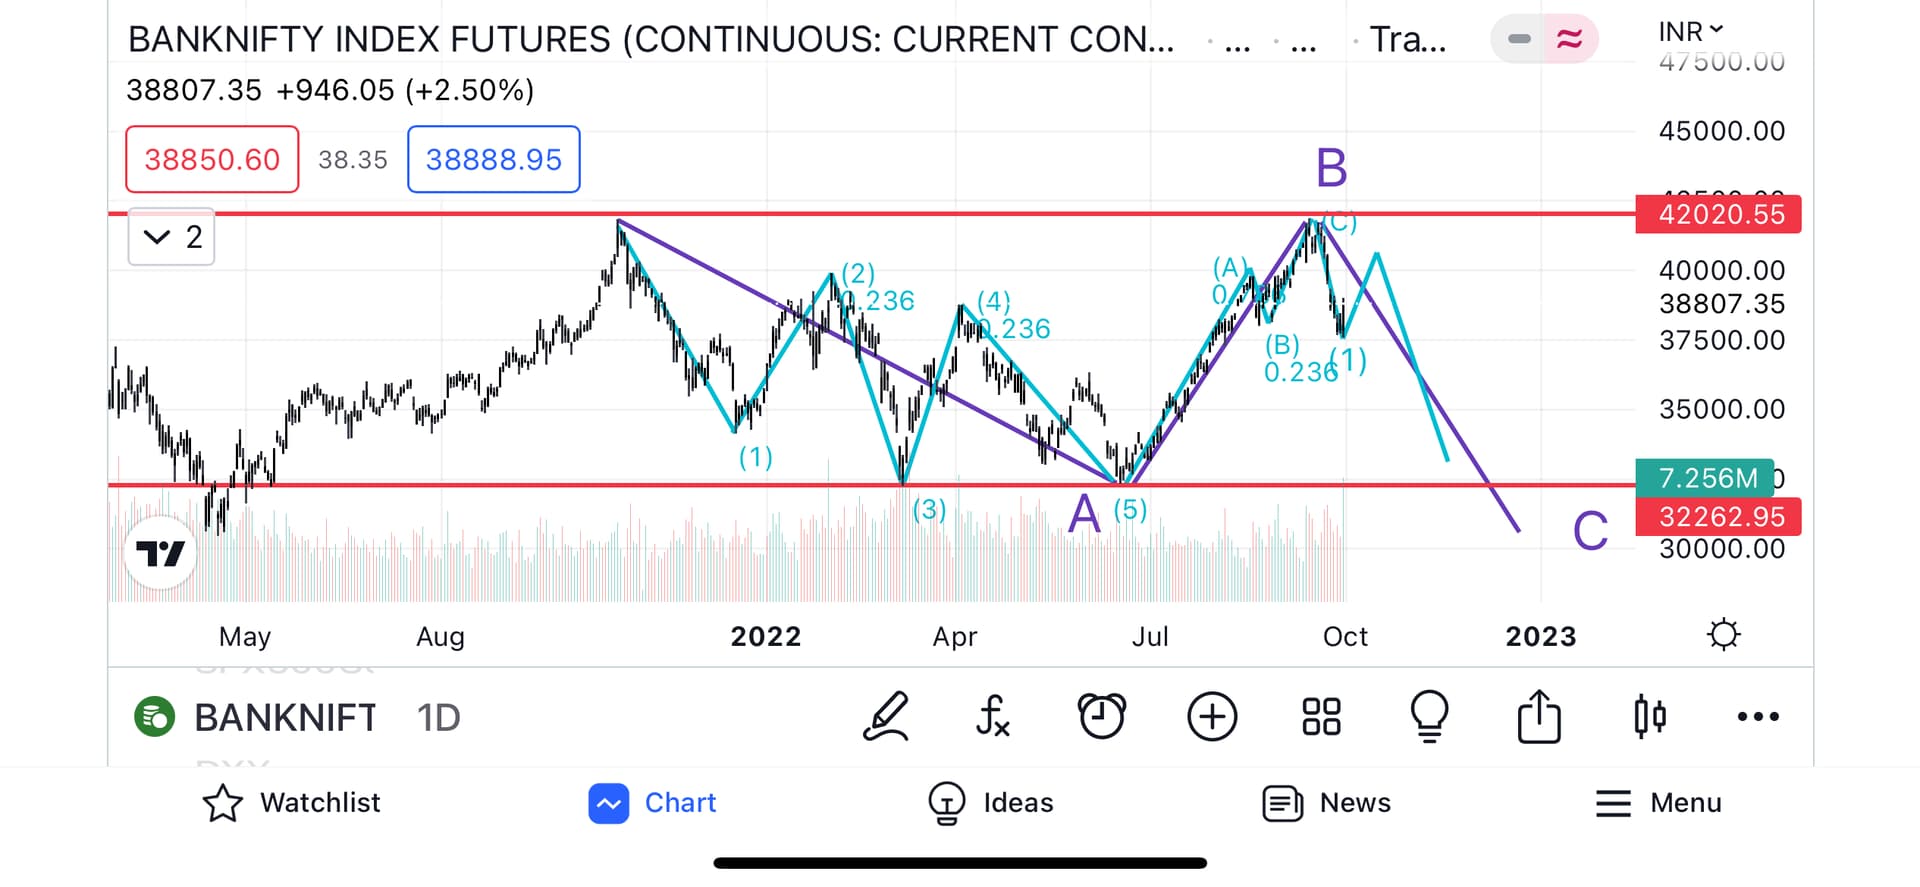
Well ,there are few issues with this count ![]()
In reality , it violates the very basic rules of EW :
a) Your wave 2 and 4 overlap
b) Wave 3 does not have 5 waves ,so it seems to be a corrective move and not the impulsive one
c) Wave 5 -wave iv and wave ii seems to be overlapping
And one little suggestion, always try to count on spot prices as there are lot of fluctuations in future prices due to premium -movement
1 Like
Good arguments, but here are are our thoughts
Well your argument is valid if we limit ourselves to last 2-3 years. But let’s go back to last 20-25 years and see what was average PE mutiple.Covid was a black swan event and is only one data -point. To take a better prespective ,we need more data points as well as need to include the falls that were secular in nature i.e. due to macro factors .
Last 15 years bull run across the globe were due to Fed funding as well as Central Bank across the globe were printing money and funding was at very low or negligible cost.
If we go back to normal days of interest rates i.e. before 2008 , with a normal liquidity in the markets, the PE levels were very different . So may be liquidity driven PEs need to readjusted.
(Additional conundrum- Now add Adani to Nifty and see what happens to PE argument )
Well , Indian IT companies are service providers to US & European companies. If they go into recession, the business of these companies gets affected.
Also there’s another well proven fact that in a bear market, weak become weaker. So we feel that IT index would copy the downward trend of Nasdaq index.
Last point :Support and resistances are meant to be broken ,but they need time ,lot of efforts and lot of macro factors.
Have a look at S & P 500, Nasdaq - June low was considered to be a strong support as well as pre-Covid levels were supposed to be resistance -zones- all have been broken.
Let’s keep a track - these are interesting times.
6 Likes
Haha ignore the fib numbers written on them, maybe you’re looking at fib numbers and assuming they are wave counts.
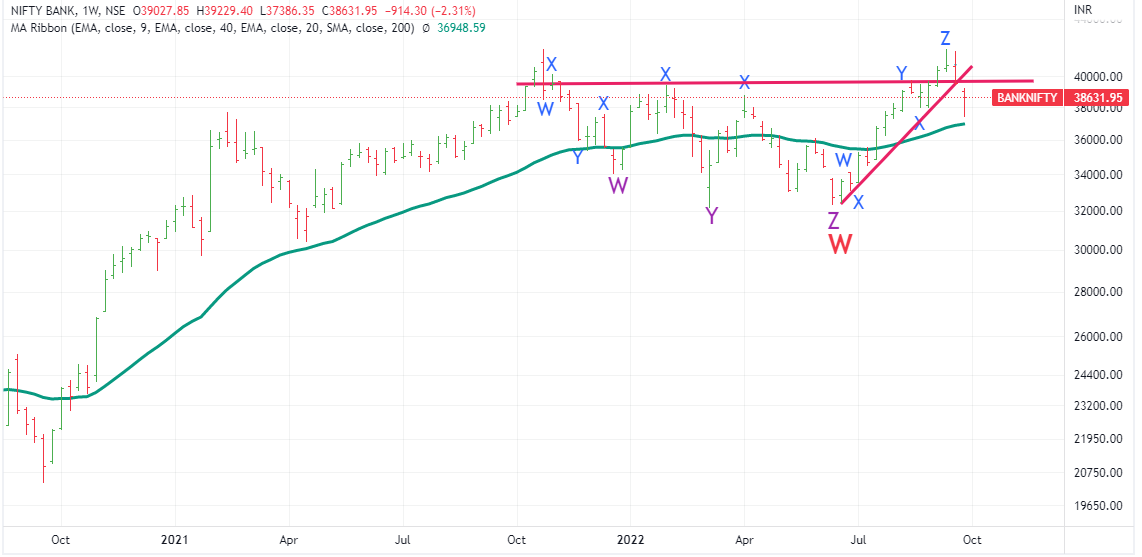
Here’s the wave count for Bank Nifty on weekly chart.
There can be alternate views wrt EW also as EW is an art rather than science (that’s why there’re no successful algorithm for wave counting).
For example, we can count the last rise as an ongoing impulse move ( as per this it is in ivth and Vth is yet to start on upside…and if this happens, we might turn bullish)
Views keep changing as the new data emerges ,same like when we analyse a company on fundamental basis.Hope it helps.
2 Likes