Well, on this part would like to say that most of the humans like mirror-images -the people who think like them. It does not depend upon what other person says , it depends upon whether it confirms to our thought-process or not. So something that sound sage for you may not sound same for other person ( but yes ,most of the people in certain group or a platform tend to think alike ) . In short, we share what we feel. People may like or may not like it.
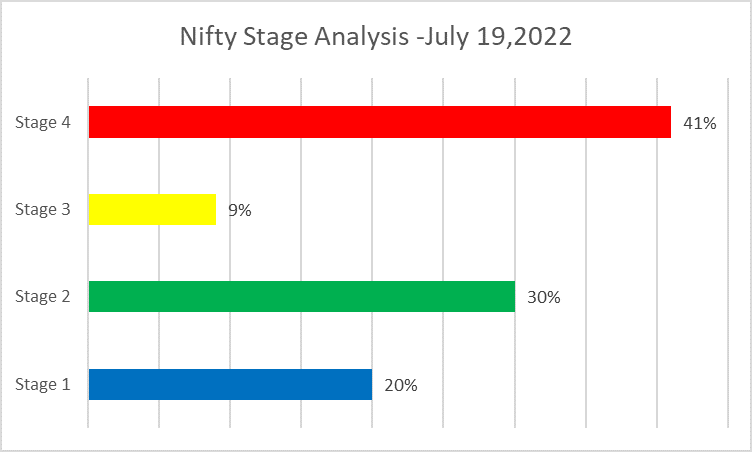
To us, it still sounds a bear market rally … we have not seen one good rally since October , so that is bery much unlike a bear -market. We’re yet to see a clear impulse on indexes , and most of the stocks still seems to be in Stage 3/4.
We would change our views if the structure of the market changes.
On sectors - difficult to say anything as of now. There is lot of sector rorataion happening over last 2 and half years. We’re just going by the flow.
On different stocks of you named…please see one by one.
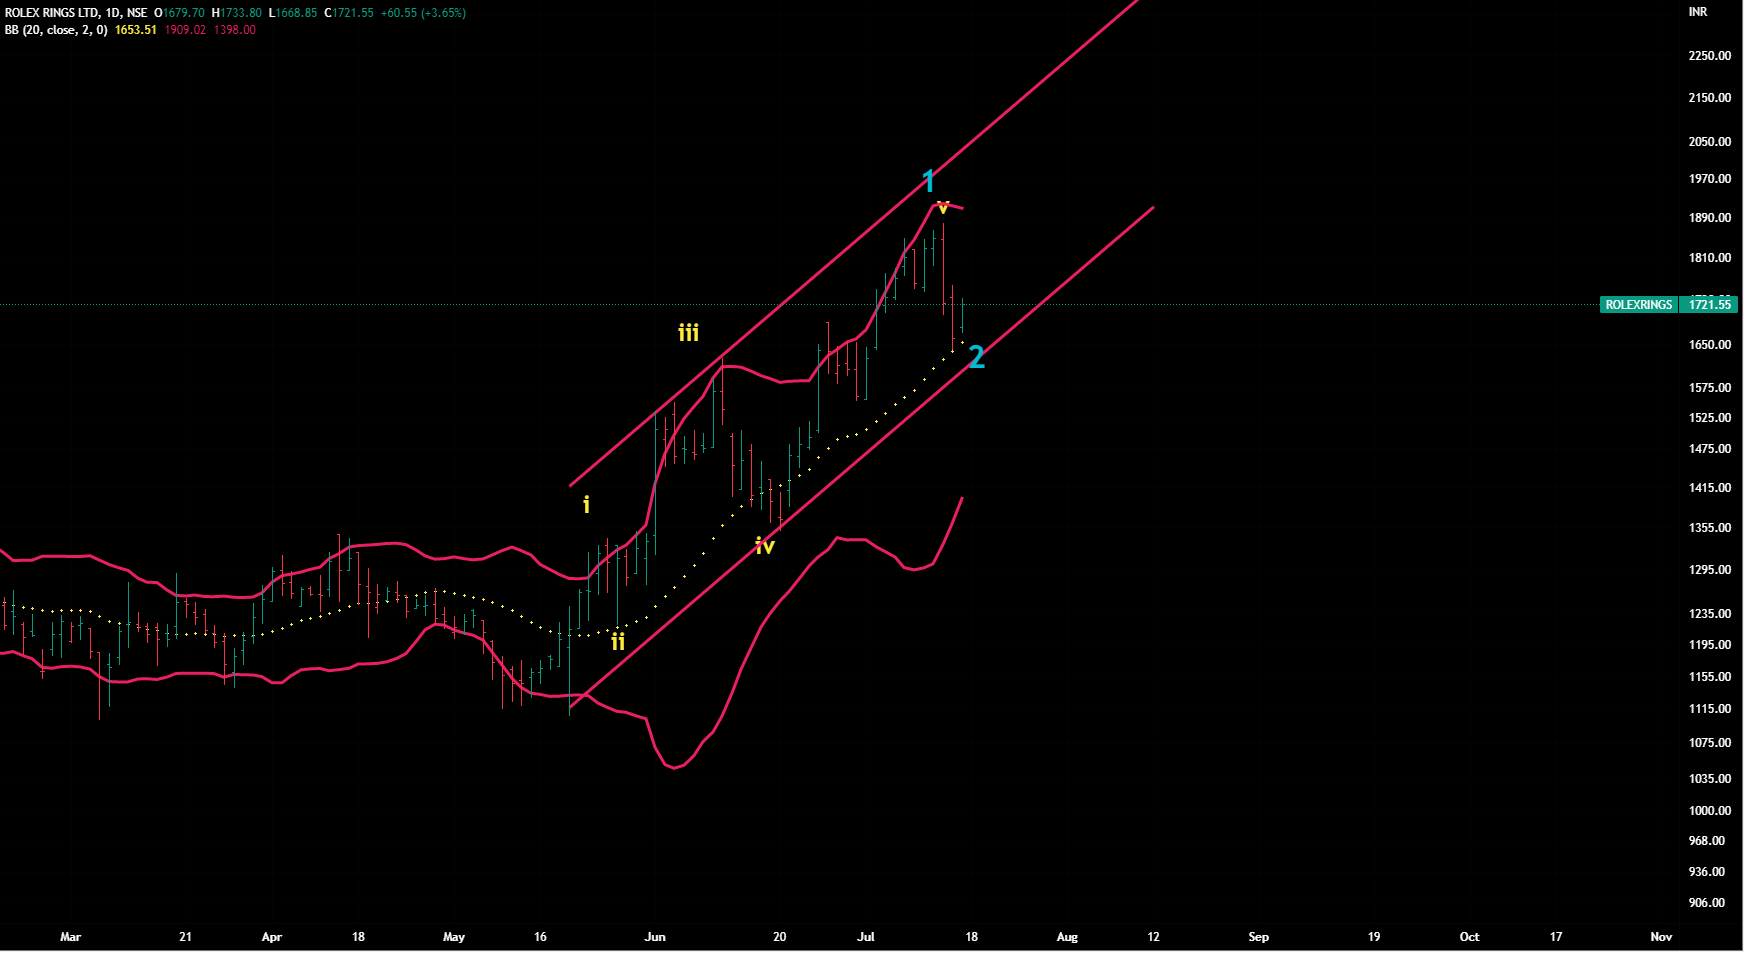
Rolex Rings
The stock has a small history so not so confident to make a projection but still tried.
Good thing is that we saw a clear impulse wave from May 22 lows - has completed wave 1 and is still in wave 2.Difficult to guess whether wave 2 is complete - will wait for 61.8% retracement (closing above 1790), then stock crossing its ATH and few more…one can do the position sizing as per these levels.Set-up fails below 1636.
Other good thing about this stock is that it has stareted an impulse wave during the market fall. Would wait for a new wave ( wave 3rd )
Disclaimer :Charts are for study purpose only . No suggestions, no recommendations.
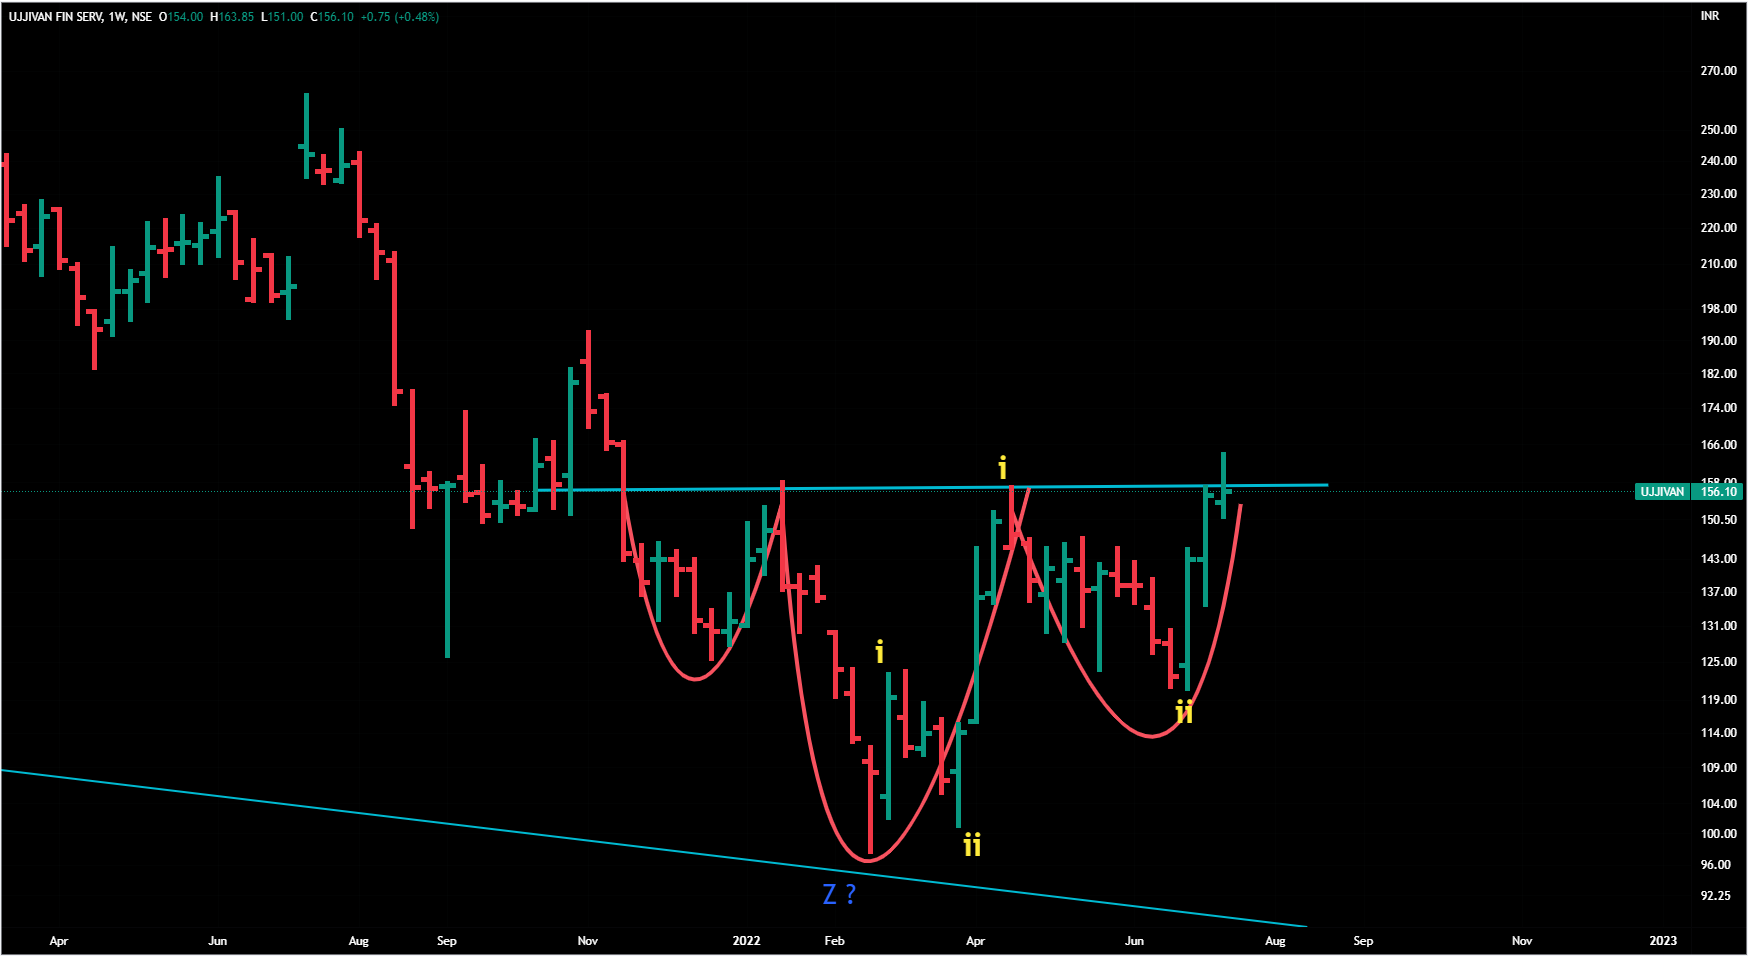
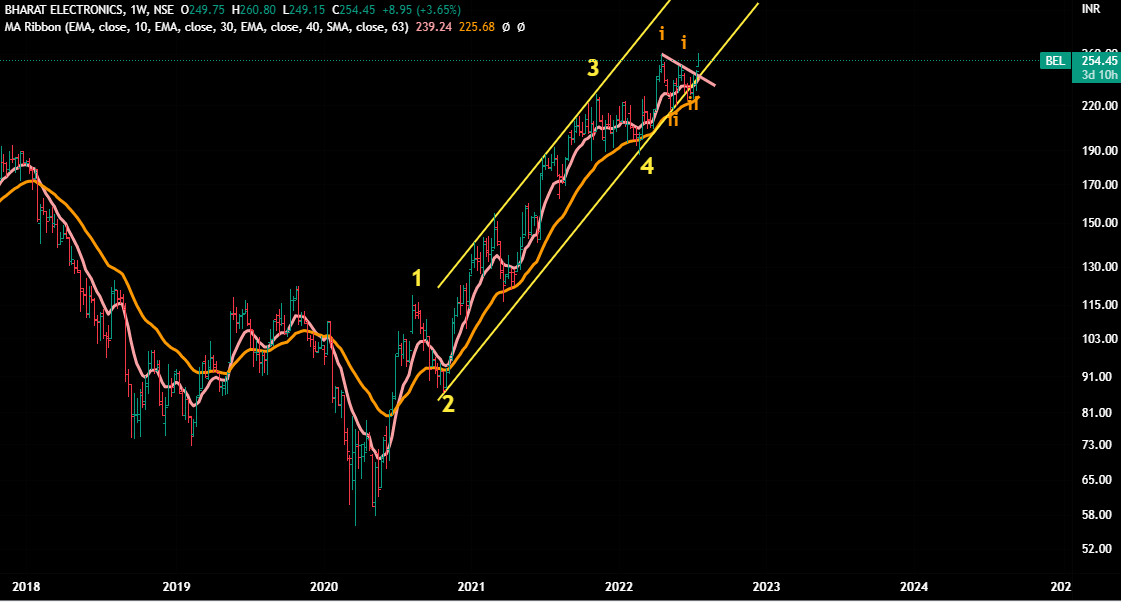
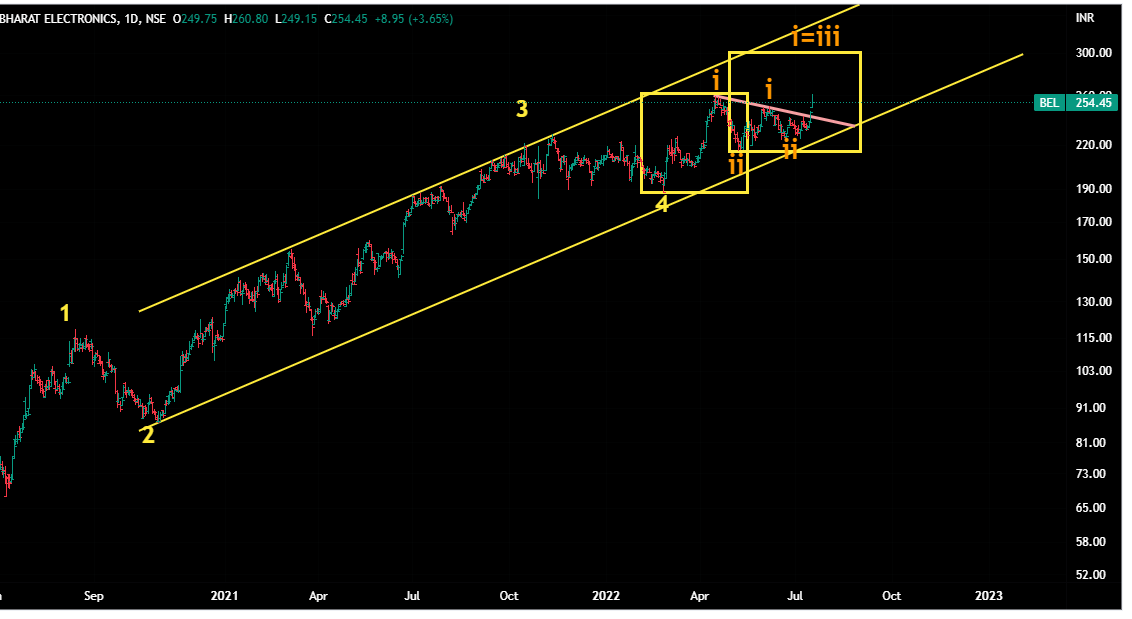
It seems to have formed a Head and Shoulder pattern and seems to be starting a iii of 3rd . Also it crossed and closed above 30 WMA recently apart from breaking the neckline ( yet to close above it on weekly time-frame) . Overall stock looks good as of now.
H & S targets come very high but for that it first needs to cross the 185 levels left-side resistance convincingly.
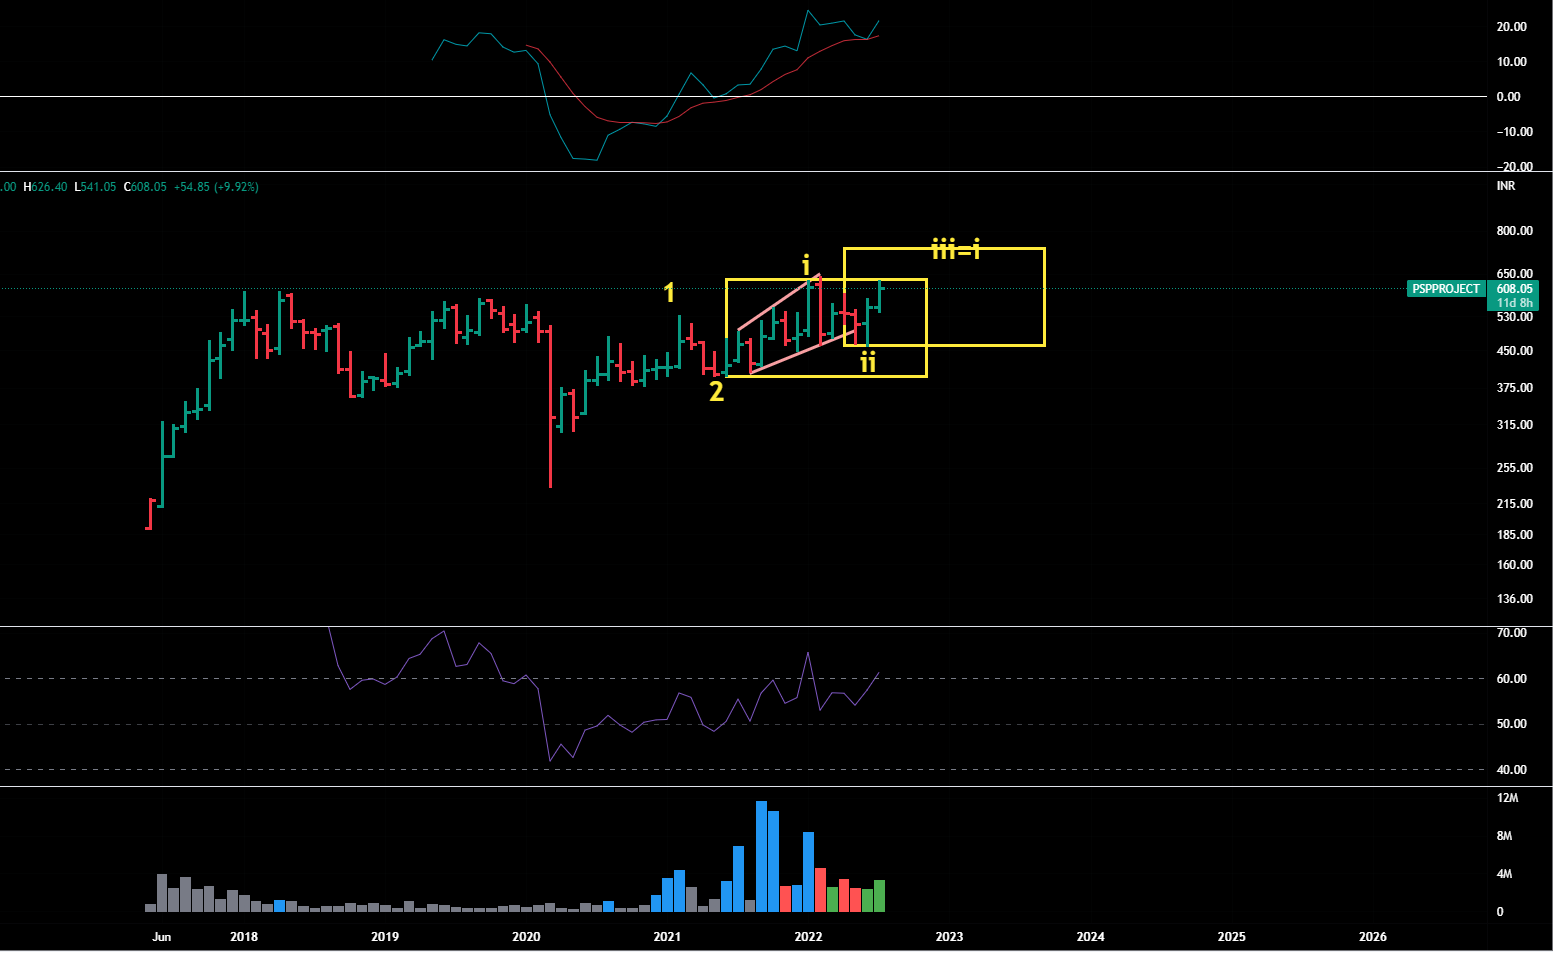
Seems to be stating iii of 3rd wave - further confirmation will come once it moves /closes above its ATH and 138 % of retracement of recent decline (near 710 )
@StageInvesting hello sir, am following this thread for some time and find it useful. thank you.
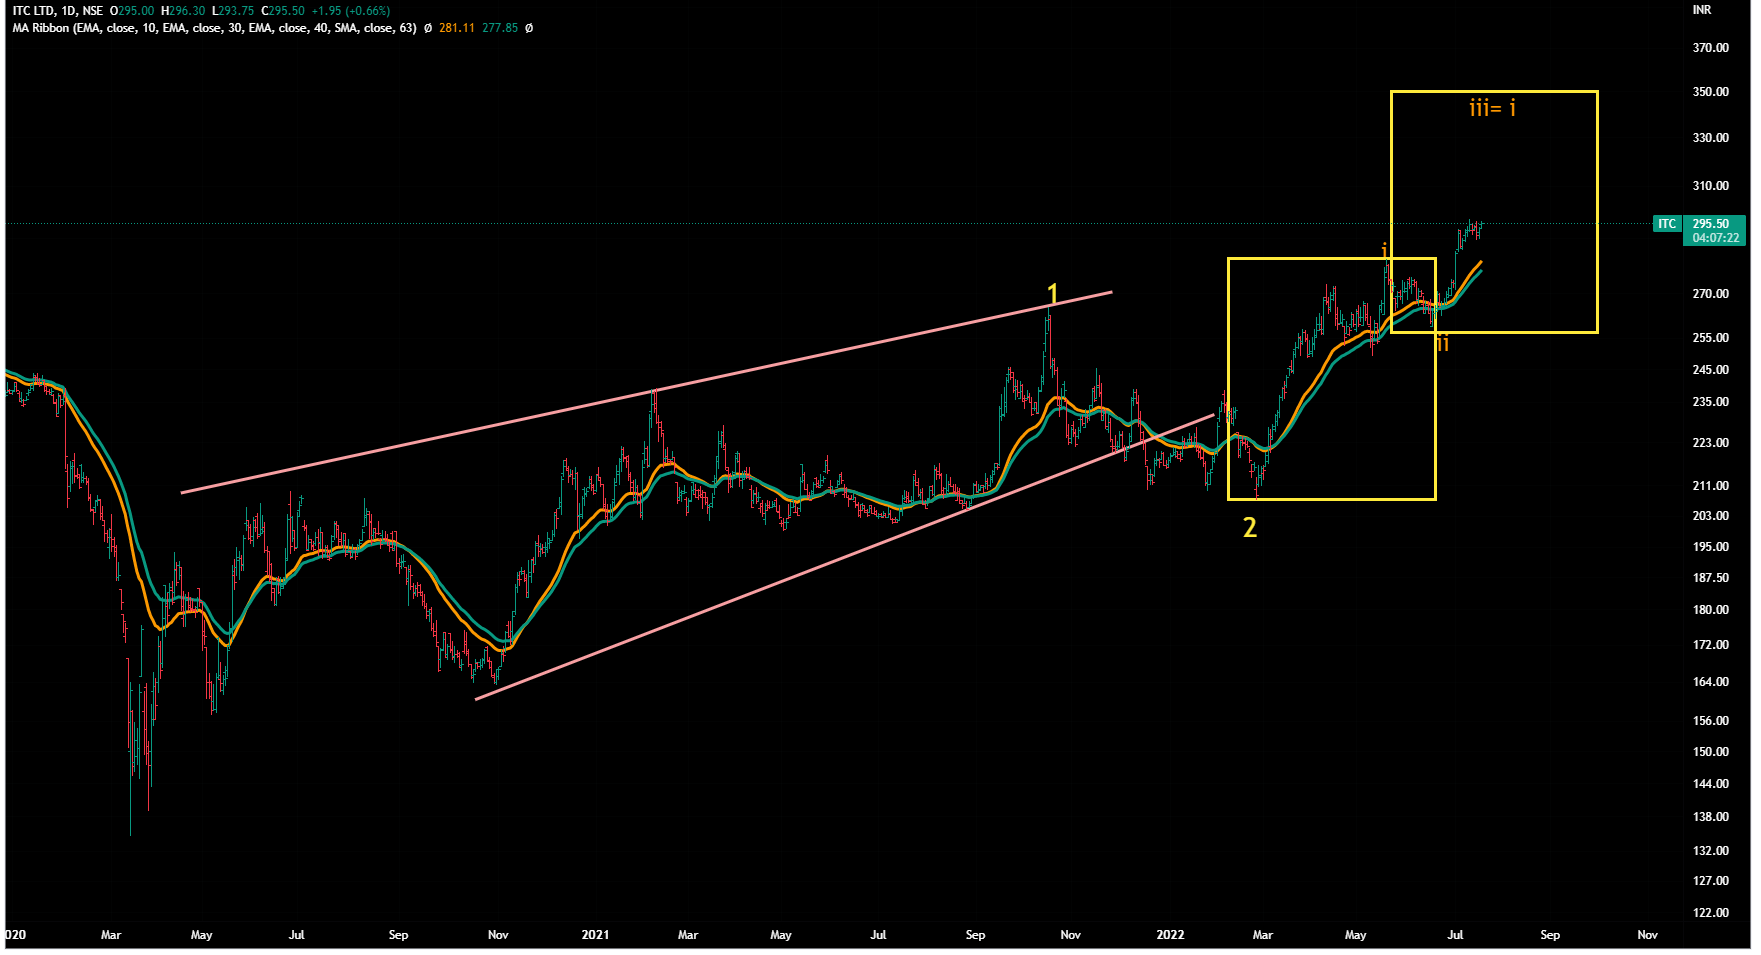
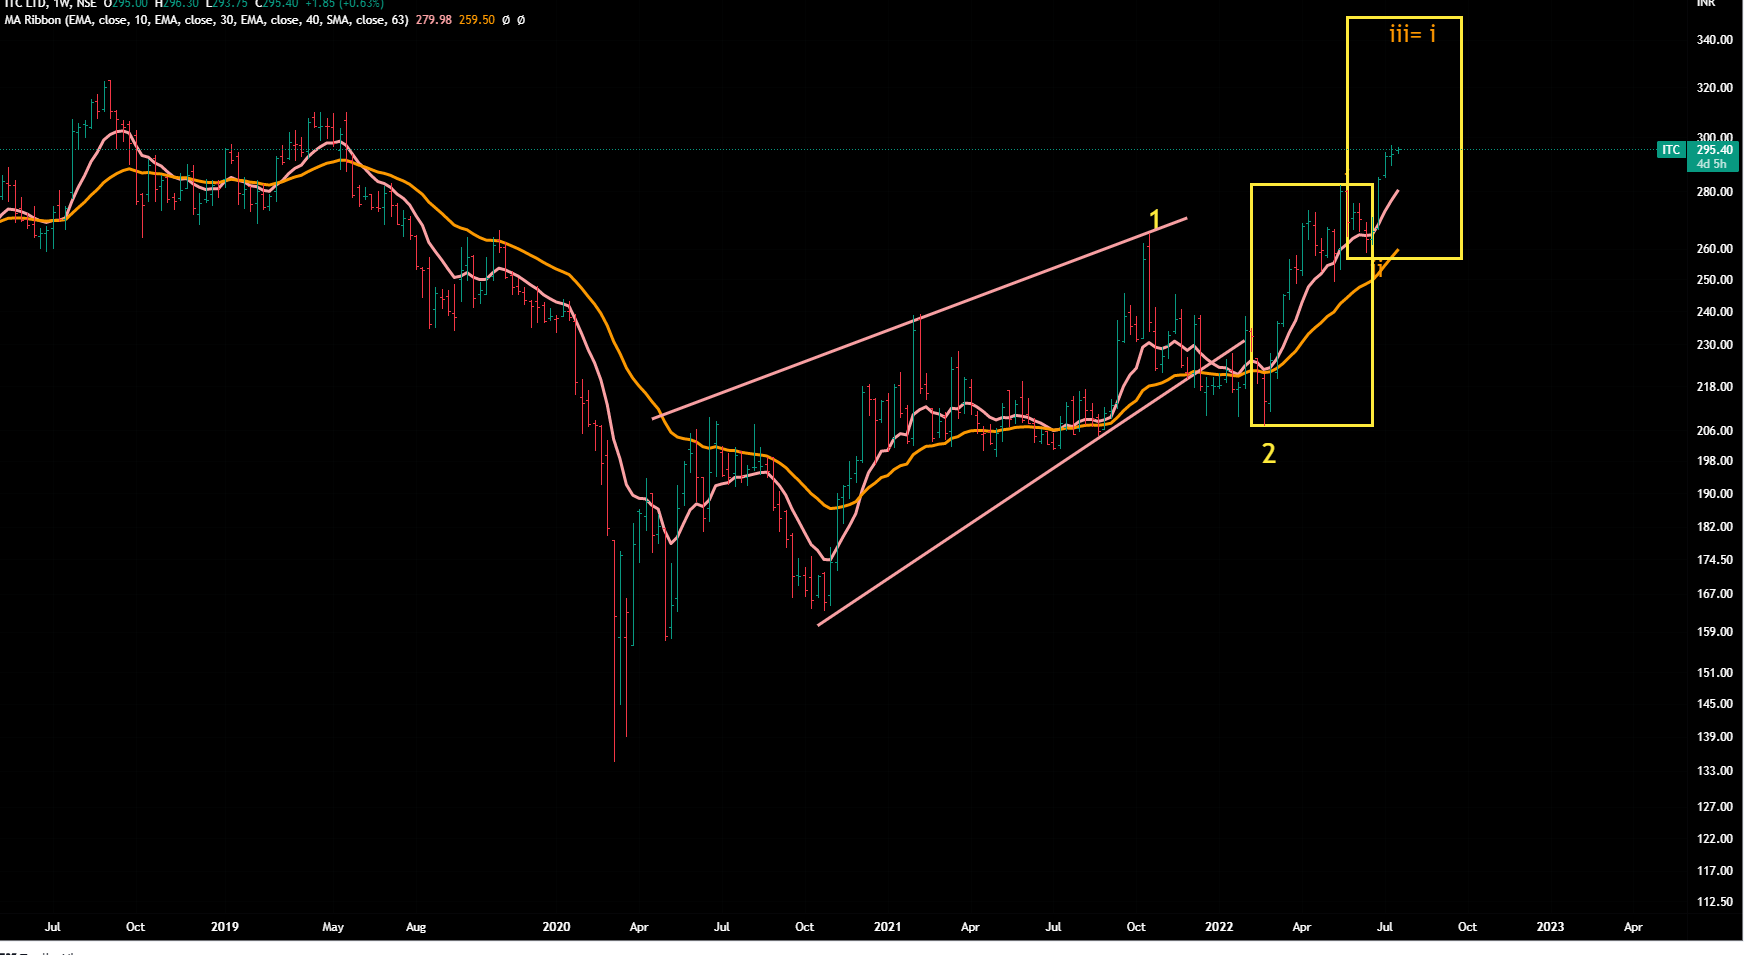
Am curious on how you can interpret ITC. The stock is showing lot of strength and seems to be out of a long consolidation of many years and is set for a next upword journey. The stock is relatively staying strong in the current downtrend.
what could be the current bottom on this counter and at what stage the stock is in as per the charts. thank you
Can it go to 300 (i=iii) and later on to 330 ( channel high -full 5th wave levels). Many a times 5th waves turncate, they don’t schive their targets.Would depend on overall market-sentiments.
Value investors were already picking the stocks in every dip.
Active investors like us are always active and keep increasing the allocation of cash based on market situations and keep investing in certain pockets /stocks . For us , market always gives opportunities either a bull rull or a tradable rally or shorting in a falling market.
The only issue happens with the guys who have not developed their own system, the people who follow too much news or have a borrowed conviction.
But no-one can help them as to make outlier returns in any field , one needs to put some outlier efforts to understand and learn the game.
By being a copy-cat, one can enjoy gull-cricket (average returns ) but to be an international player ( above average returns), one needs to learn,practice and develop a style suitable to his/her own aptitude.
I’m finding the approach of Fundamental Analysis+ price action theory extremely helpful. Who says it’s not possible to do bottom fishing. When you know fundamentals are extremely good and charts indicate resistance ahead it’s time to buy in large quantities with stoploss
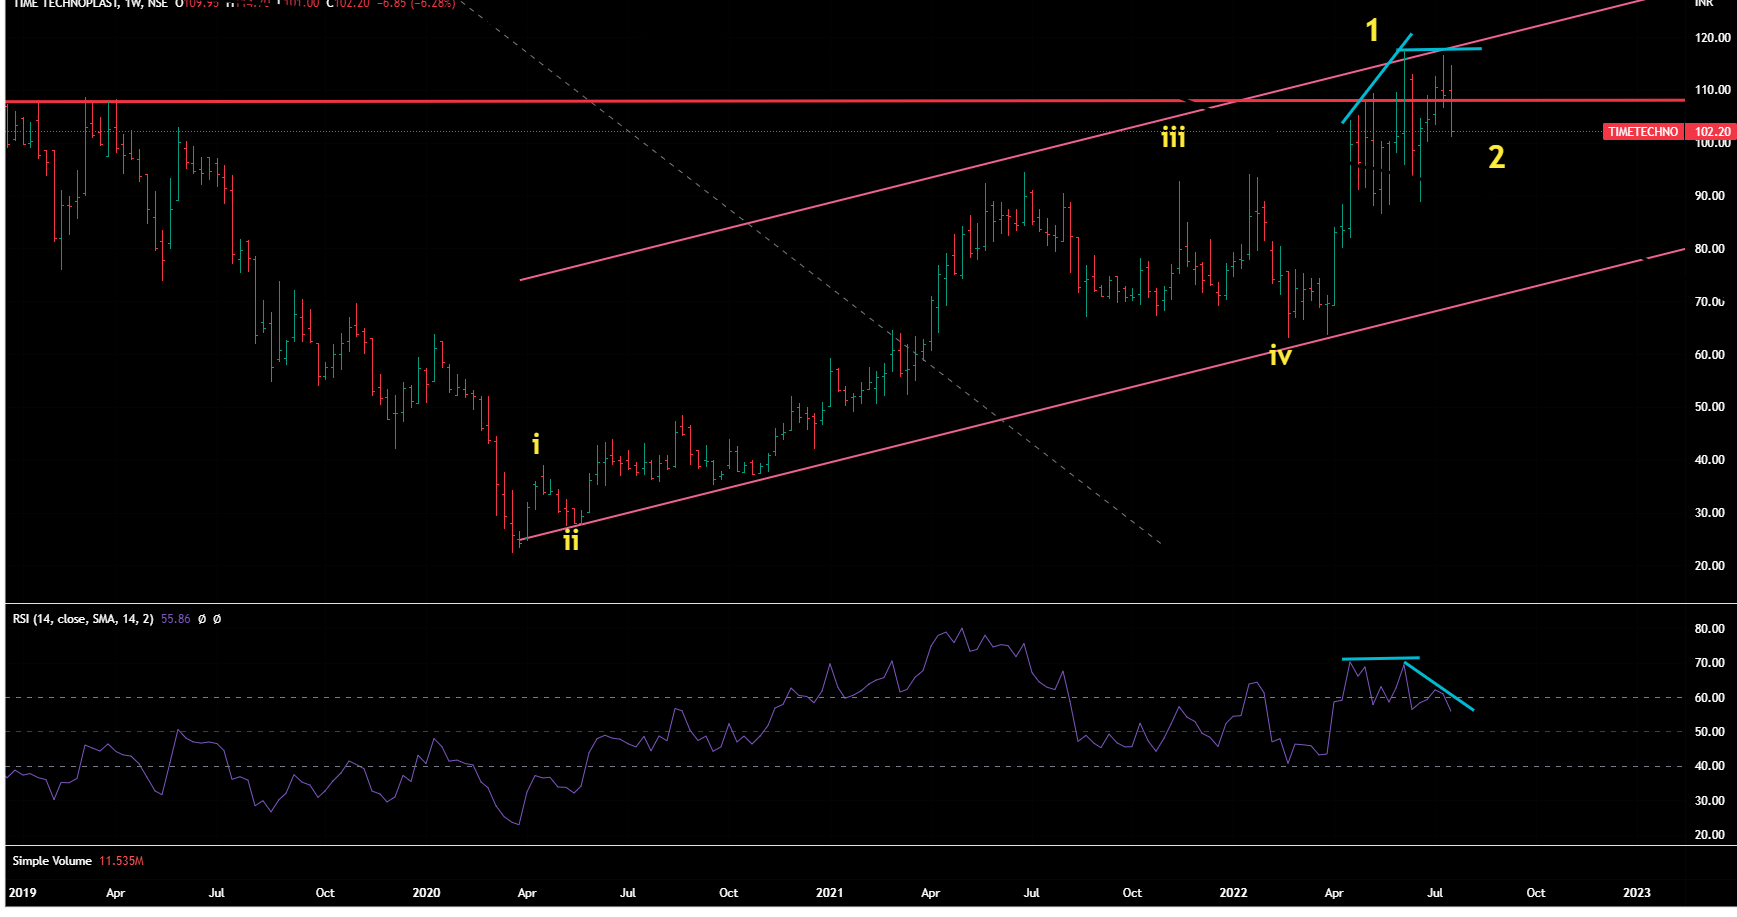
Time Technoplast - not so easy chart from technical point of view. ( someone can do short term trading but for a long -term ride, it does not give a good picture from EW prespective as of now)
RSI -Bearish Divergence on Weekly Chart
Stock price making higher high is not supported by higher high on RSI . That does not give much confidence.
Check the blue lines on price as well as on RSI. Ideally RSI should move in line with stock price- any divergence on RSI movement can indicate the future direction of the price.
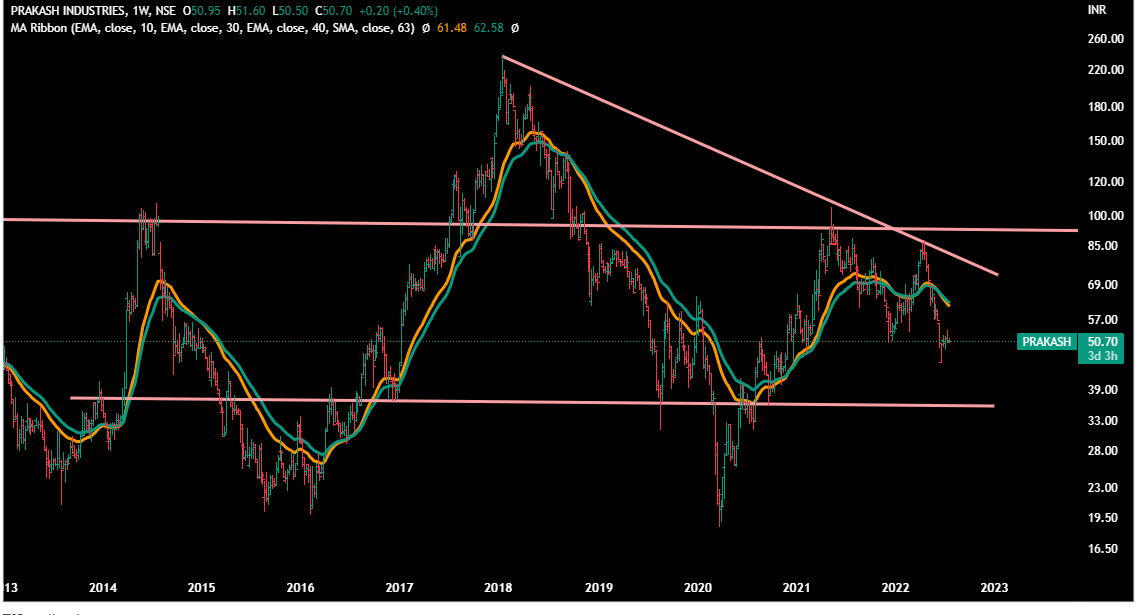
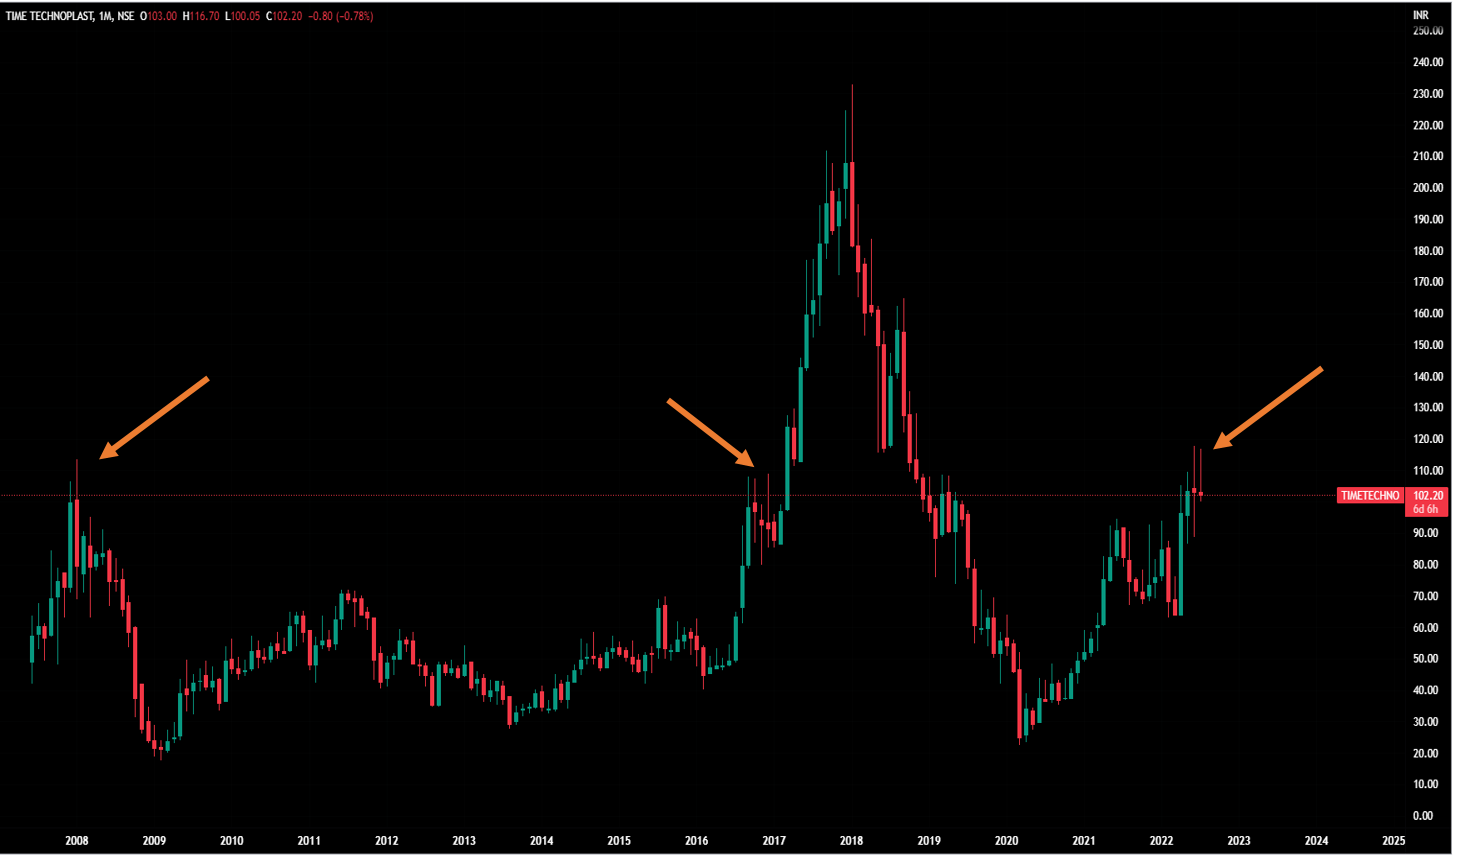
The following is the monthly chart. Look at the size of the upper wick of the candles at different periods of time at this price range (since 2009) .That means sellers come out in a herd whenever price reaches 100-110 range. To make any significant upside , it should close above 120 at least for 2 weeks . That would show that supply at this range has been absorbed.
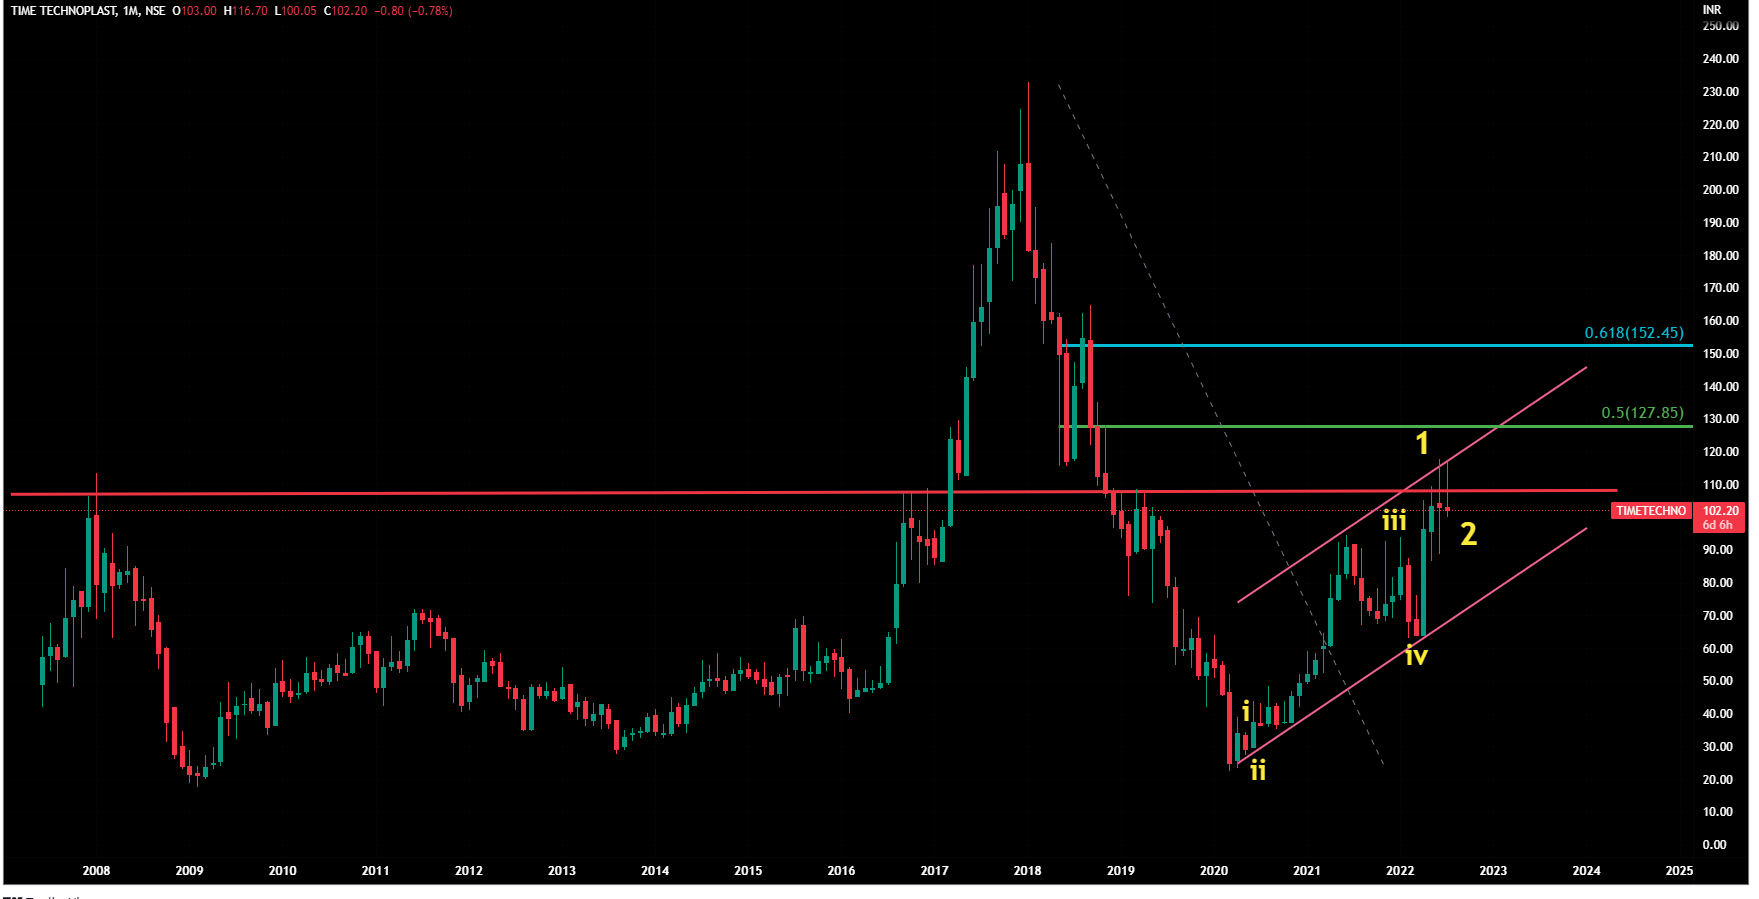
For any real upside, for long term investment and for significant position sizing in any stock , an EW praticioner looks at 3-4 conformation points :
i) Stock closing above 61.8% of recent decline (152 in this case)
ii) An impulse move (difficult to count the 5 clear waves in an impulse in this case, as there are many overlaps of daily/weekly charts -have tried to count an impulse but not so sure)
iii) Stock crossing ots previous high
iv) Stock crossing 138 % of recent decline
A EW practitioner keeps adding positions based on above conformations - one by one - may be 20-25% each at every step depending upon the risk-appetite.
Great admirer of your detailed Elliott and other Technical Analysis skills. I have also gone deep into Technical side of Stocks analysis since last 3 years and wanting to be a good analyst going ahead.
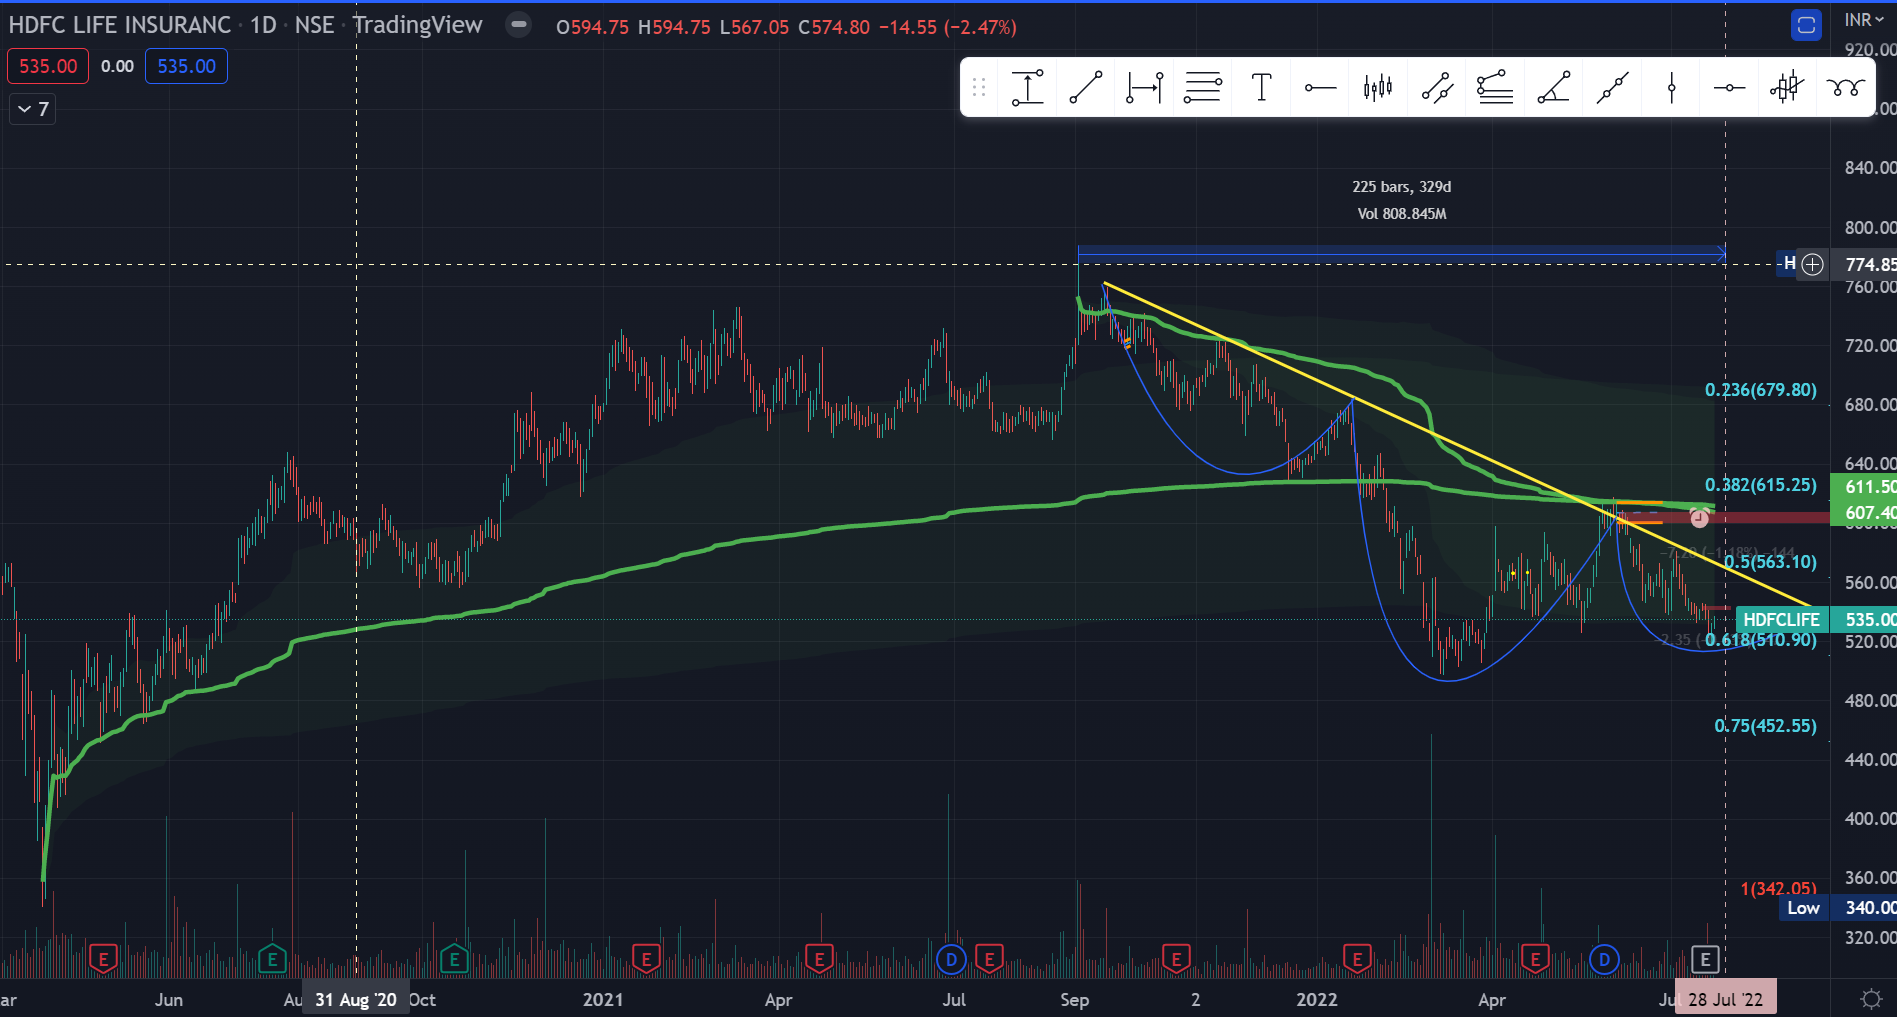
As per your convenience , could you please decode HDFC Life Insurance chart please.
As per my study, on daily chart, it is forming inverse head and shoulder (albeit in a diagonal fashion), there is a trendline breakout possible too. As per Fibo too, if it crosses levels of 577 and 625 (both Gann vibration numbers too), we may see some bullishness here? Post breakout in range of 610-625, I can see formation of impulse wave upwards confirmation too (as per Elliott Wave analysis).
Request you to please provide your valuable thoughts on this.
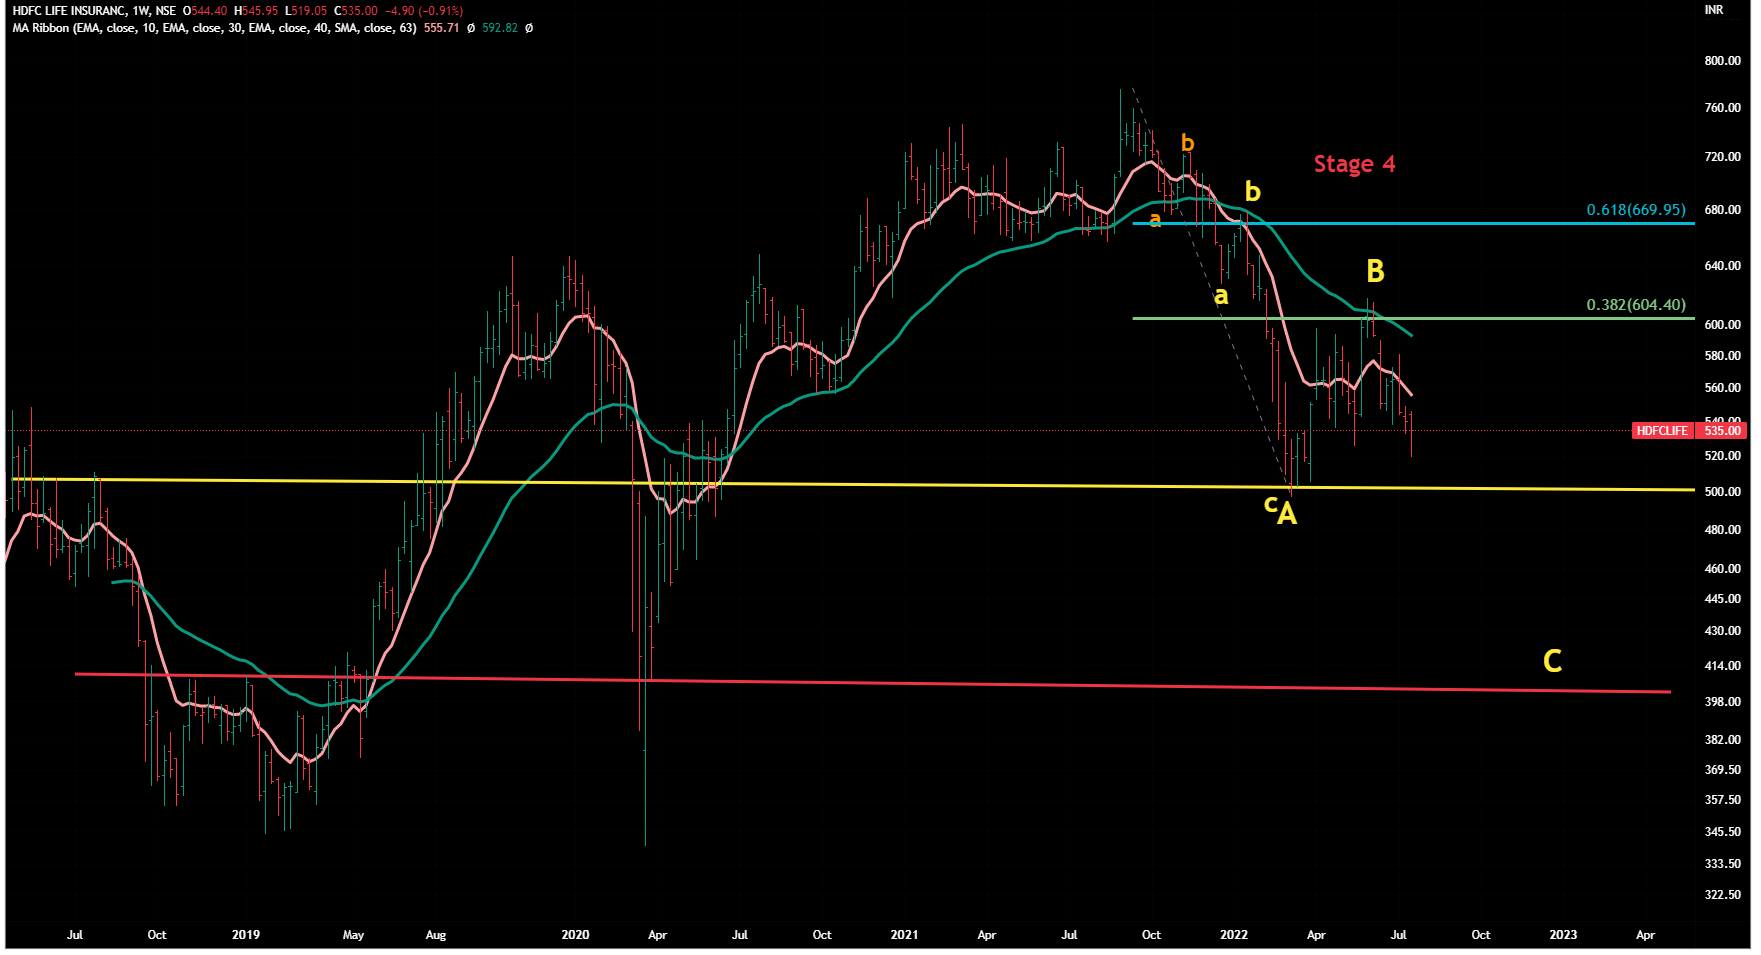
From Stage Analysis prespective, it represents worst case of Stage 4 stock where the price is moving below even 10 WMA and 10 WMA is lower than 40 WMA.
MACD is in sell-mdoe on weekly/monthly charts.
From EW prespective , it is still in correction and there has been no impulse wave .
To make any significant upward move , it should first cross and close above 61.8% retracement of recent decline. (near 670). But it seems to have retraced only near to 38% but could not close above the same in last few weeks ( sign of a weak stock) .
If market keeps moving above ( some part of bounce is still balance) , it might attempt to cross 38% level again and then may try to crorss 50 % or 61.8% levels of retracement ( very optimistic scenario, but I would put only 10 % probability on either of these scenario as it did not move in last one mont when Nifty gave a 10% bounce)
On the downside , 500 is an important support. If it fails to hold there and starts trading below that for few weeks, then it can go as down as 410/400 - where C =A (worst case scenario)
On IH&S - we don’t see any of that kind of pattern ( be careful, sometime we get an illusion of a pattern in line with our bullish/bearish bias wrt a stock/index.)
Disclaimer: Chart for study purpose only. No recommendation, no siggestion. All of the above opinion might go completely wrong.