FREE Excel Template for Screener.in

I am sharing an Excel Template for screener.in which will allow an investor to do the following:

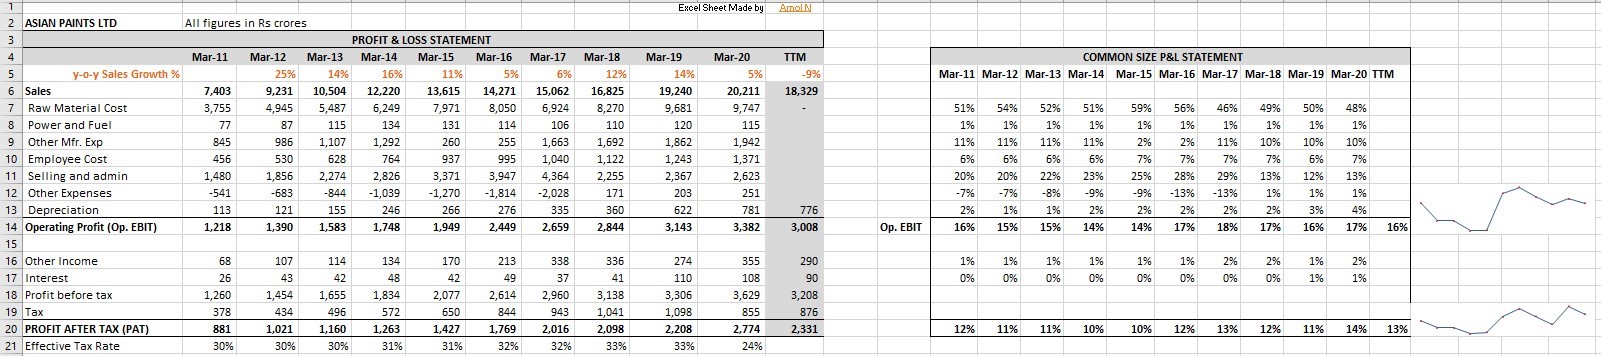
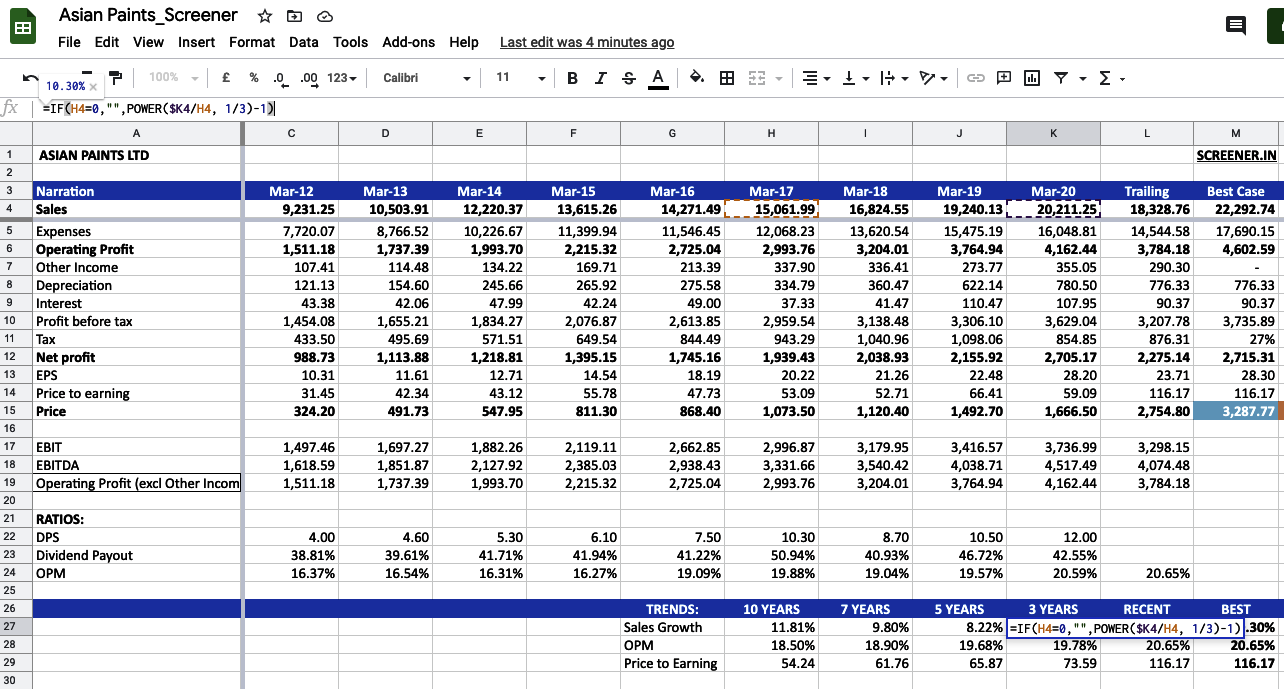
1. Income Statement Analysis
The template provides margin analysis of Income Statement items for the past 10 years

2. Growth Analysis
The template calculates the growth of Sales, PAT and EBIT over a period of 9 years, 7 years, 5 years, 3 years and TTM.

3. Debt and Solvency Ratios
The template calculates D/E and Interest Coverage Ratios for the past 10 years

4. Free Cash Flow Analysis
The template calculates Free Cash Flow to Firm (FCFF) and Free Cash Flow to Equity (FCFE) for the past 9 years. It also calculates Cumulative FCF over the course of 9 years, which will help an investor to understand whether the company has earned any positive FCF over that period. In case a company has paid dividends but without earning FCF, the template will give out a comment that the dividends have been paid out of debt (and not FCF).

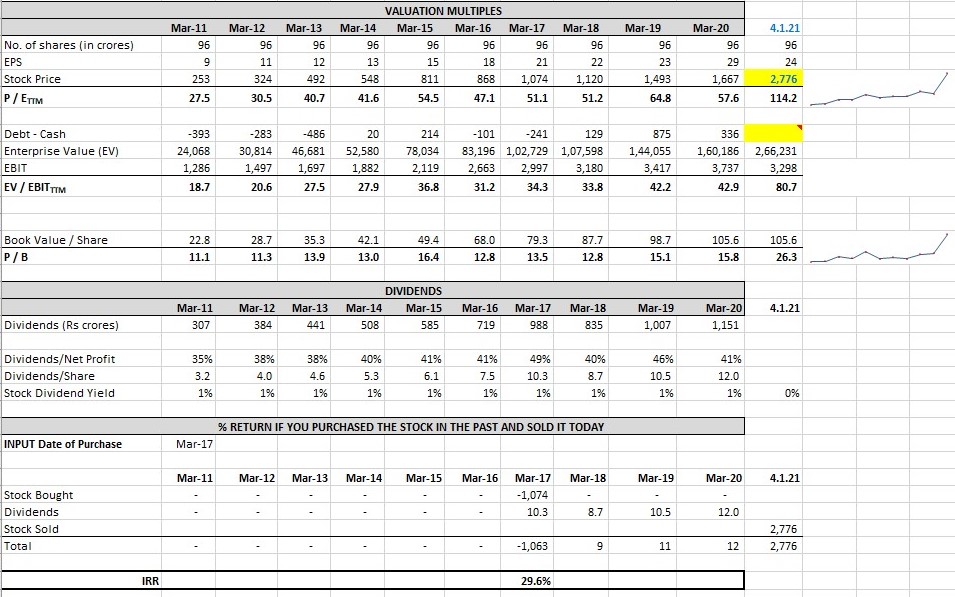
5. Valuation Multiples
The P/E, EV/EBIT, P/B multiples are calculated for the past 10 years.

6. Dividend Analysis
The dividends of the past 10 years are displayed. The template calculates Dividends/Net Profit and Dividend Yield. This will allow an investor to understand how the current dividend yield compares to that in the past 10 years and accordingly understand whether the current dividend yield is sustainable or not.

7. Return on a stock including dividends
Most websites calculate the return an investor made on a stock based on its price and do not account dividends. The template calculates the returns an investor has made including the dividends paid by a company

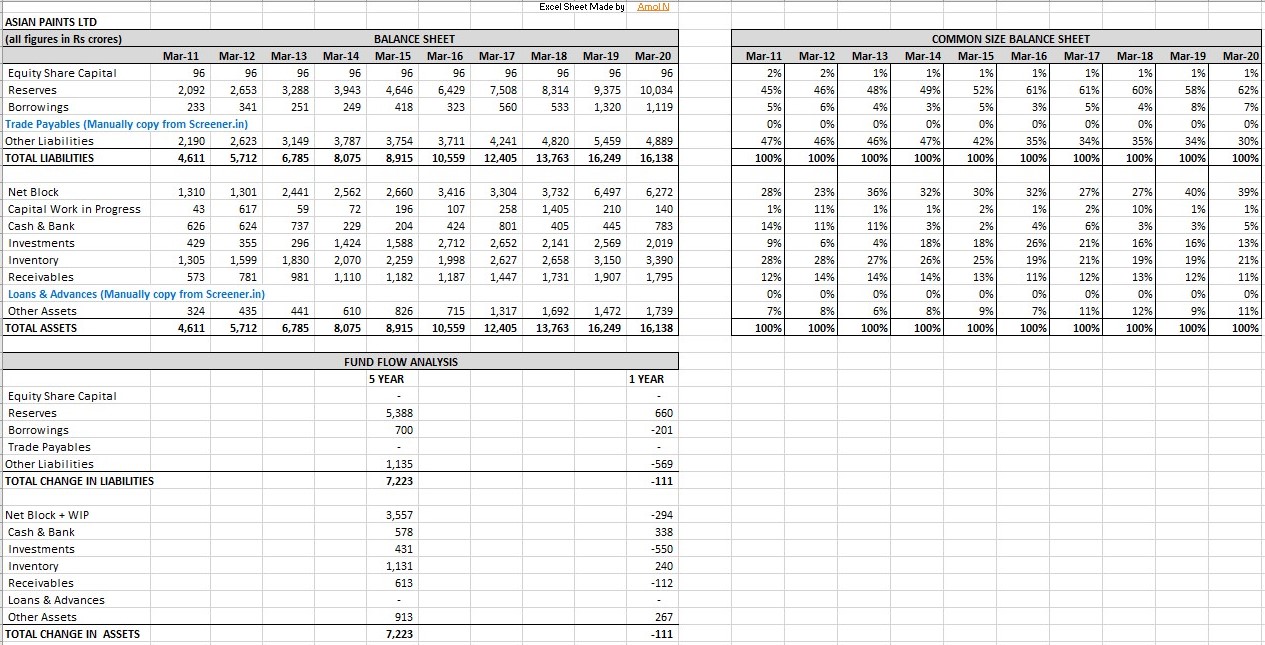
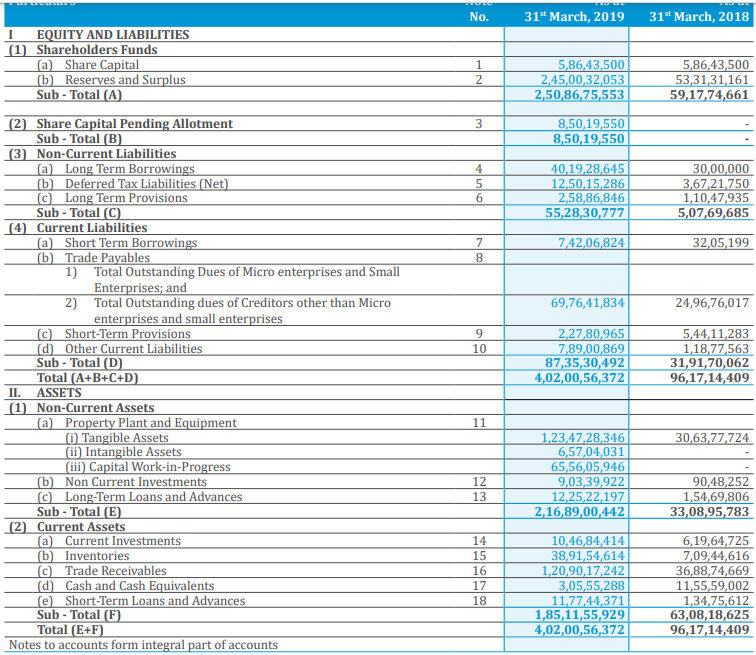
8. Balance Sheet Analysis
The template provides analysis of the Balance Sheet items by common sizing them for the past 10 years. This will aid for easy comparison of balance sheet items over the course 10 years.

9. Fund Flow Analysis
The template shows how a company has utilized its funds and how the company has raised these funds over the past 5 years and over the course of the past 1 year.

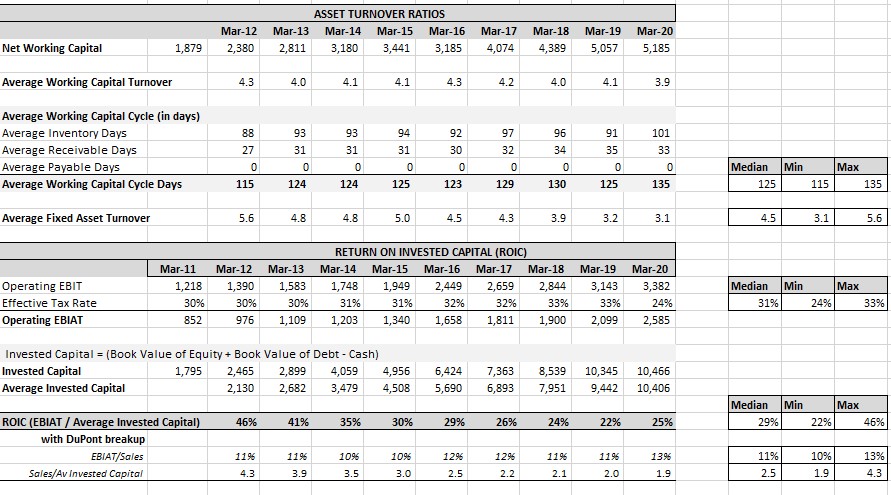
10. Asset Turnover Ratios
Working Capital Turnover and Fixed Asset Turnover for the past 10 years are calculated. Also calculated are the inventory days, payables days and receivable days.

11. Return on Invested Capital (ROIC)
For non-financial companies, ROIC is better measure of return than ROE or ROA. The excel template calculates ROIC for the past 10 years. Thus an investor can understand how the ROIC of a company has evolved over this time period.

I am offering this template for free. To download it click HERE

38 Likes

UPDATE: I have made some minor changes in the template and the revised one is called “asian-paints.xlsx” and if you have not downloaded this one, then please feel free to downloaded this updated file

Those of who have downloaded the file called “asian-paints.xlsx” you need not do anything as you already have the latest version

2 Likes

TFS. I wonder if we can collect all such excel template shared in a common thread together? : )

1 Like

Can you please share the result screen?

Here are the screenshots of the template:

Income Statement Analysis

FCF Analysis

Valuation Multiples and Equity Returns

Balance Sheet Analysis

Return on Invested Capital and Asset Turnover Ratios

3 Likes

Suggestion - is it possible to color code (Green/Red) to narrow down the key metrics and its performance. It would make it much more useful to rookies like me :slight_smile:

1 Like

good one and helps as it gives lot of information at a glance.

thanks for sharing. good work.

Thank you for the kind words.

I had observed that there are a lot of paid excel templates out there that charge as high as Rs 5000 and still do not give adequate analysis! Moreover in most of these paid versions, the FCF calculation is “technically” incorrect.

Hope everyone can benefit from this template and do share if you like

5 Likes

Hi all,
Attaching the excel template which I use (it was shared by Donald here VP Productivity 2.0: Emerging Moat Deep-Dive Template - Processors - #23 by Donald)

I’ve just added the common size analysis tab to Donald’s template (also attached below), rest all is same. Some tabs like ‘Price Implied Expectations’ and ‘Business Robustness’ are truly commendable!

Asian Paints_Screener.xlsx (238.0 KB) (the one I use)

Note: Both are compatible with www.screener.in/excel

4 Likes

Some of the things in the sheet that you are using are not correct

For e.g:
The FCF calculation in the ‘Cash Flow’ Tab fails to deduct Capital Expenditure and thereby HUGELY overestimates the FCF generated. Also it does not specify which FCF it is - FCFF or FCFE. In case of FCFE there are additional steps to calculate the same
The CAGR calculations displays 10 yrs, 5 years, 3 years but the formula calculates it for 9,4,2 years respectively.
I suggest that should carefully check all the items in the sheet

Also, IMHO it is better to analyze historical performance and perform DCF valuation seperately because, in order fit everything in one file, one ends making over simplfying assumptions

1 Like

Amol,
this is impressive. Thanks

Most welcome.

Over 500 downloads of the template in 4 days from users of valuepickr and twitter

Truly humbled by the response :pray:

1 Like

Thanks for sharing the excel to analyze balance sheet

a noob question, i downloaded the template and uploaded in excel section of the screener, then what next? can you please guide me :frowning:

Hi, appreciate you taking the time to go through the excel.

Agreed, but in ‘VP type of businesses’, which are mostly small/midcap (which I’m more interested in), FCF is hardly useful.
Yes, for bluechip strong businesses, you need to see FCFF, FCFE especially for modelling which are missing in the excel I shared.

Can you tell me which calculations are you referring to? Attaching the screenshot, with highlight on the 3 year sales growth, which seems to be correct.
Also, trends in OPM are simple averages, not CAGR.

Ansh,
Most happy to help out.

  1. In regards to FCFF/FCFE, I believe it is important even for midcaps & small caps. Firstly mid-caps, as defined by SEBI, are companies between the ranks 101-250 of market capitalization. The 250th company in the list (i.e. the smallest mid cap company) had a market cap of 8,389.14 crores! Thus mid caps are not small businesses and understanding their free cash is an important part of analysis IMHO.
    Secondly, small caps (defined as companies having rank 251 and beyond) is a very large group. Now, admittedly the “smaller” small cap companies have low/negative FCFF/FCFE due to their high reinvestments which are needed for their growth. However, analyzing the FCFF/FCFE vis-a-vis their reported profits will aid one to understand where the reinvestments are going and how they are financed. My point is that the METHOD of analyzing a FCFF/FCFE for a “small” small cap company differs from the method of analyzing the same for larger companies but an analysis of the same is helpful.
    As a side note, if you want to know exactly which companies are defined as large cap, mid cap, small cap you can visit the AMFII website HERE

  2. The calculation issues that I was referring to are in the “Customization” tab of your excel sheet.

1 Like

rshankv,
Its very easy and the screener team must be given huge credit for this!

Search for any company that you would like to research. Once the financials are displayed, there is a button called “EXPORT TO EXCEL” near the top right corner of the screen. Click that and you are done.

1 Like

Thanks, Amol and Ansh both are doing a great thing, you guys helping a lot for a small investor like me. it’s helping me a lot. Screener team you guys are simply amazing.

1 Like

I have a question regarding calculation of ‘Operating assets’ and ‘Operating liabilities’. Can someone throw some light on this? I believe, it is a good addition to the template to determine operational excellence of the company.

Sample AR (Valiant Organics)

My understanding is;

Operating Assets

  1. Inventories
  2. Trade receivables
  3. Fixed assets
  4. cash and cash eq.
  5. Short term loans and advances
  6. Long term loans and advances (???)

Operating Liabilities

  1. Trade payables
  2. Deferred tax liability (both short and long term ???)
  3. Short term provisions (employees salary, dividends)
  4. Other current liabilities (???) - Current matruirty of long term debts, statutory dues