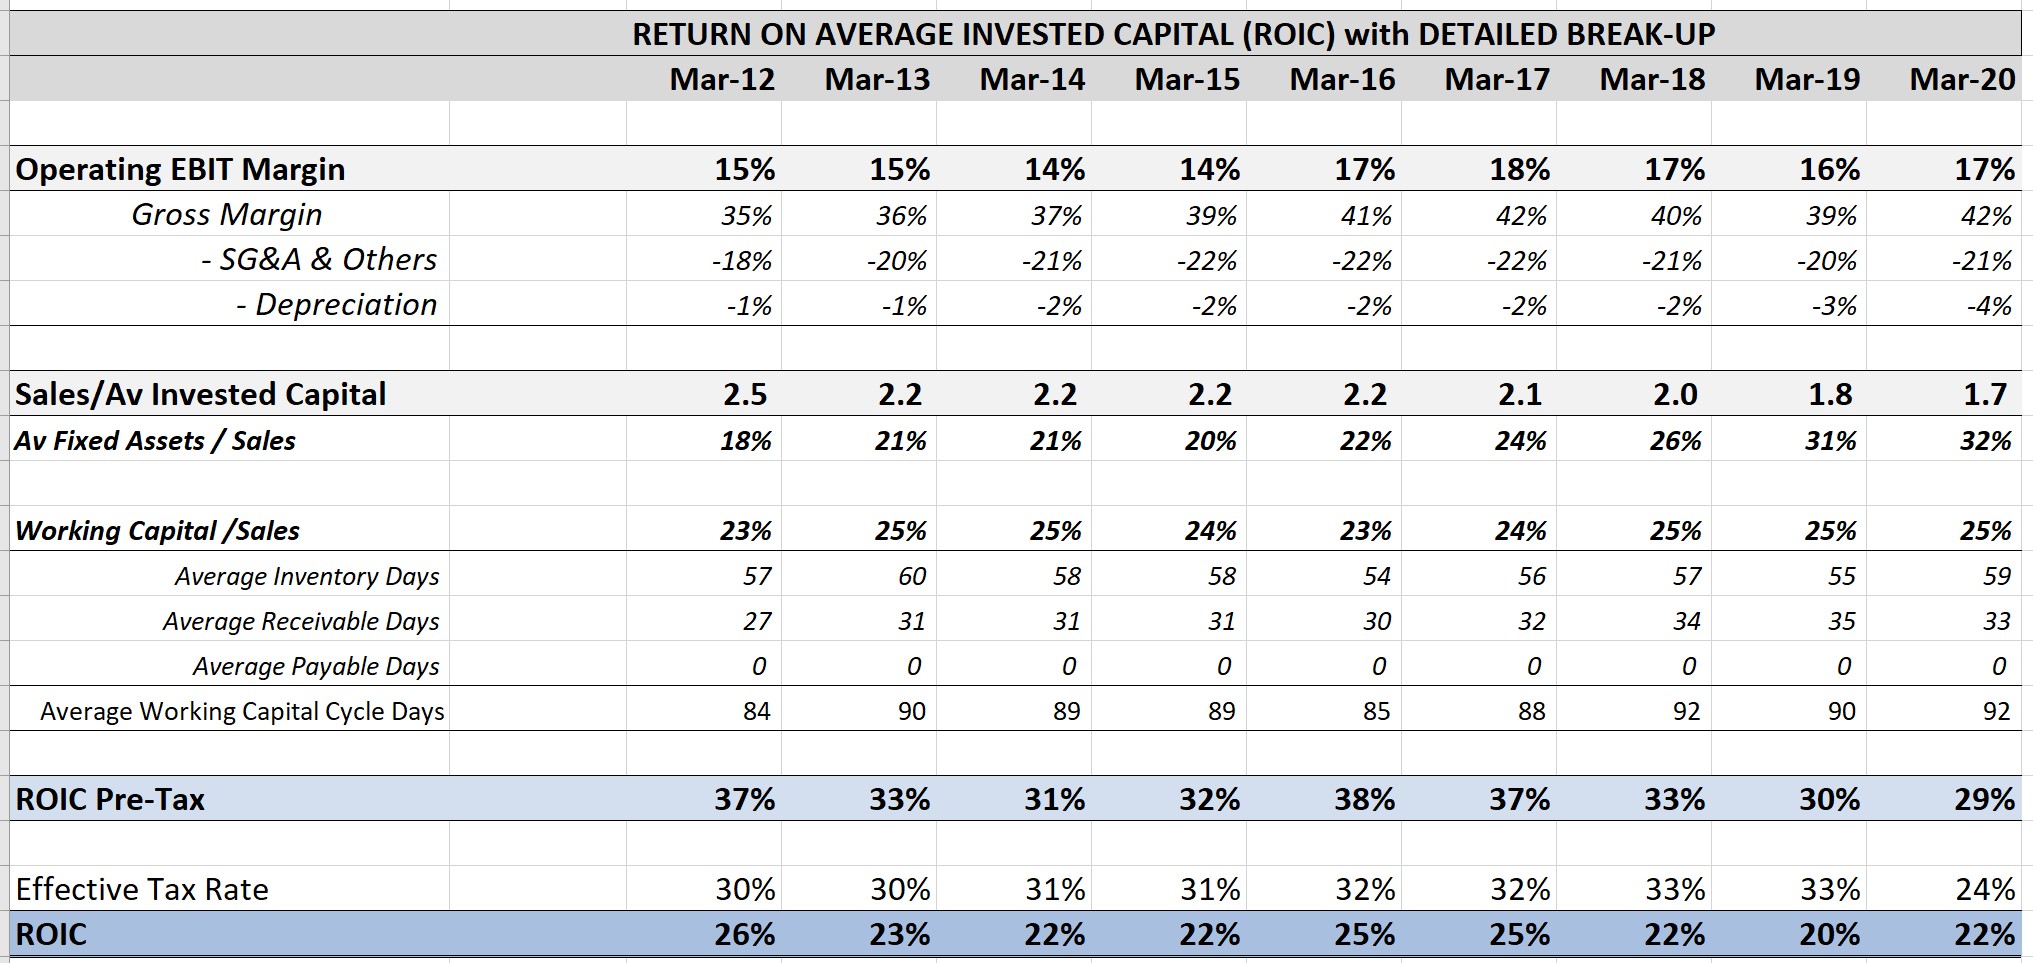
I have updated this free template. The KEY changes in the new version is that it uses Return on Invested Capital (ROIC) to analyze operating performance of a company by breaking ROIC down into its components. Thus you can have one ratio - ROIC to analyze all the operating parameters of a company.
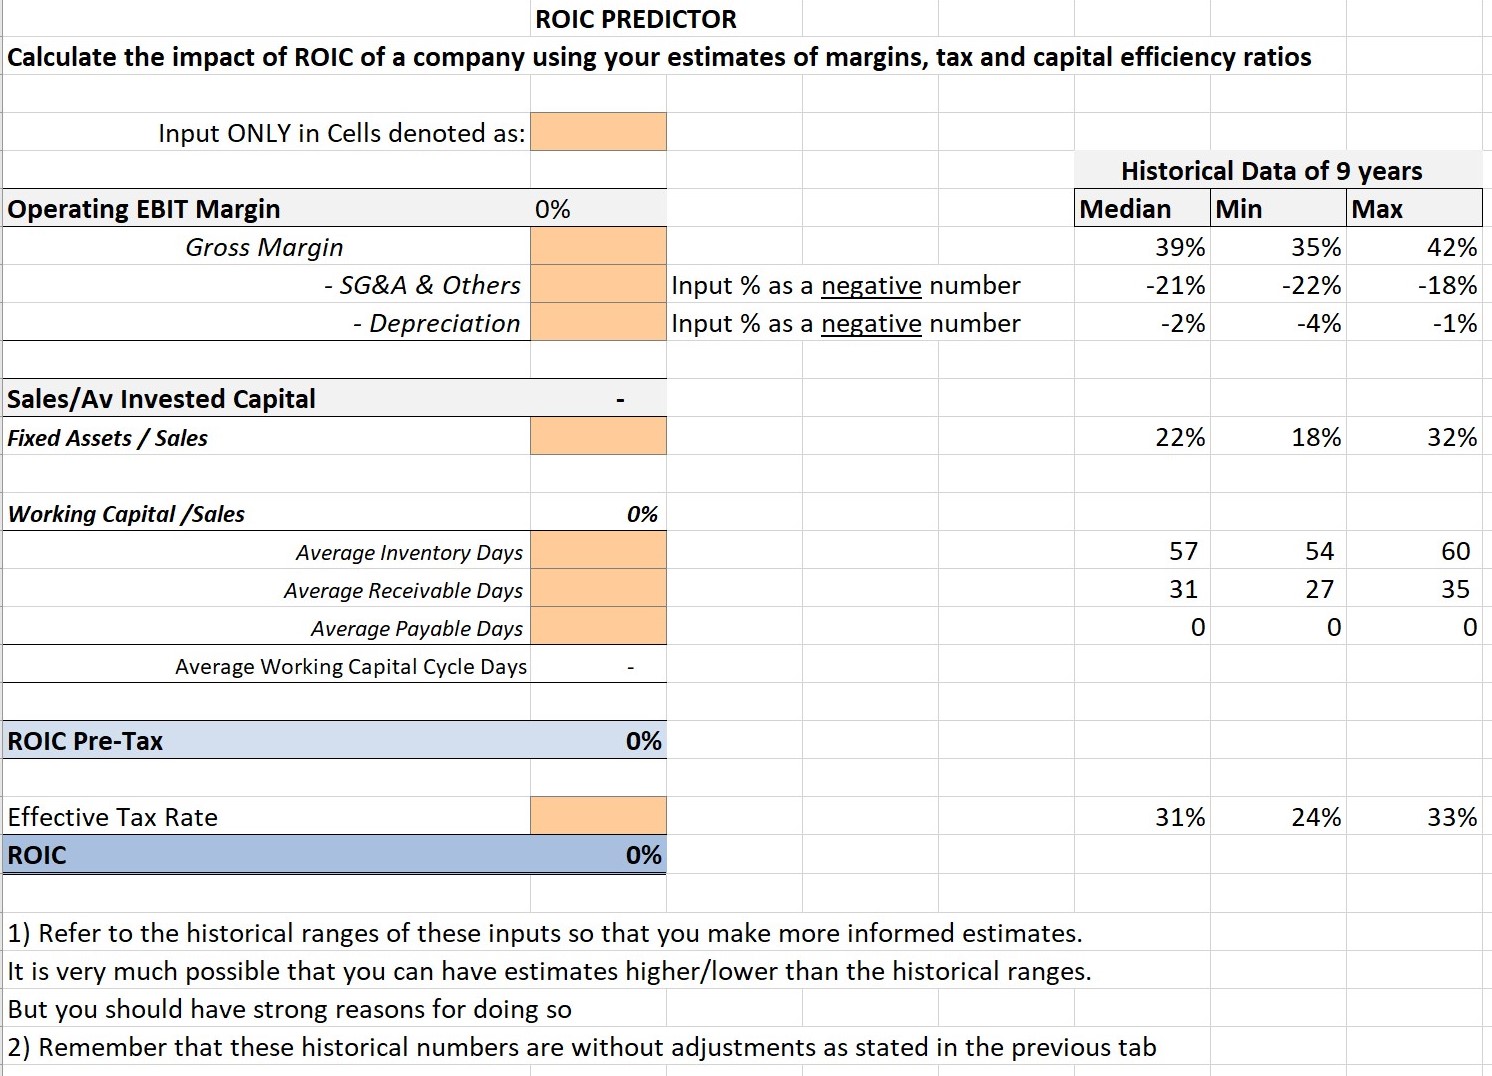
You can also use your own estimates of Margins, Fixed Asset Turnover, Working Days, etc and see what impact your assumptions have on the ROIC. I have given historical ranges of these inputs so that one can make informed estimates.
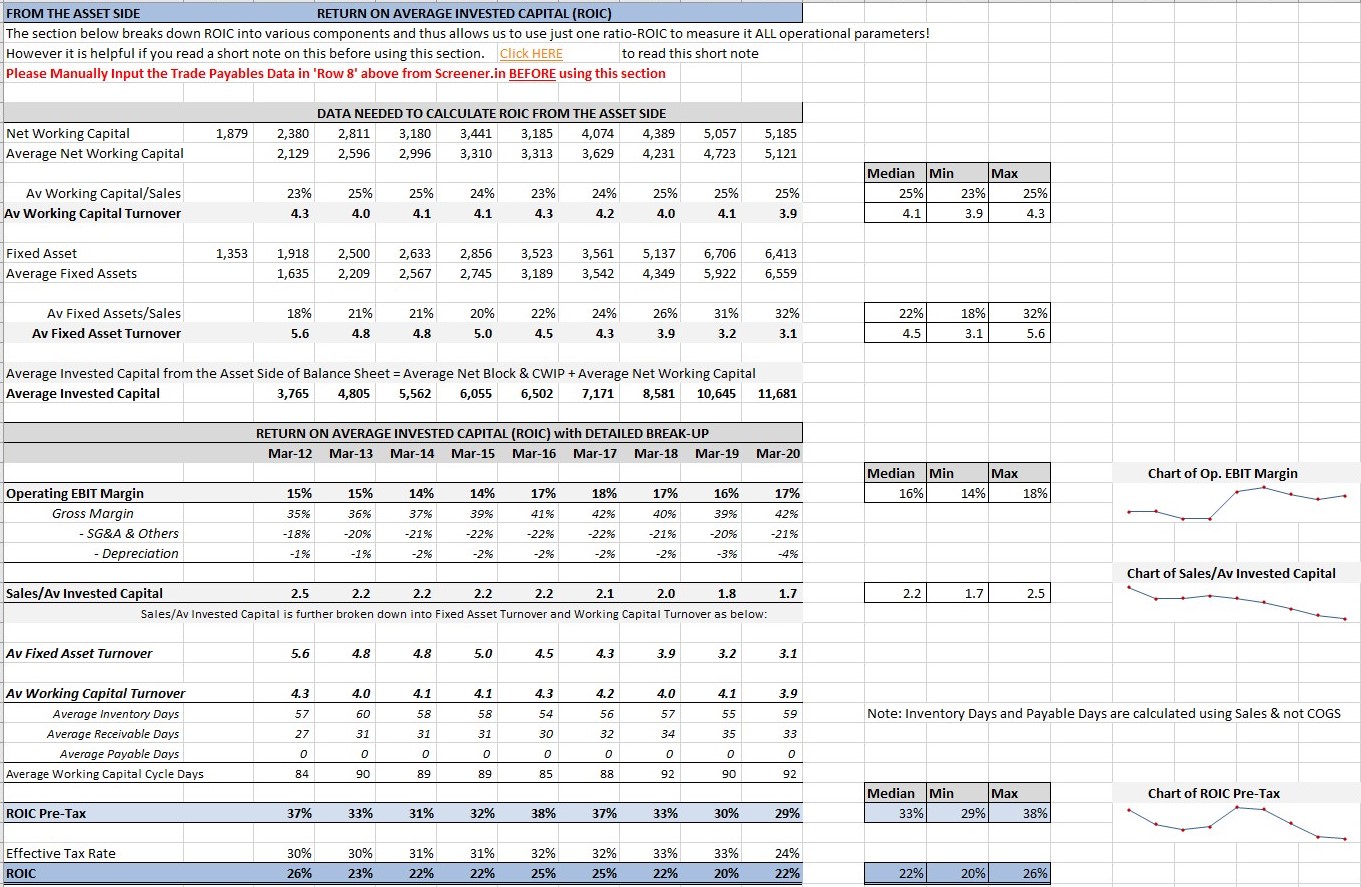
Have inserted some charts for the relevant data so that it can be analysed visually. Also, ROIC is calculated using Fixed Asset/Working Capital turnover (Asset/Sales) instead of %s used earlier.
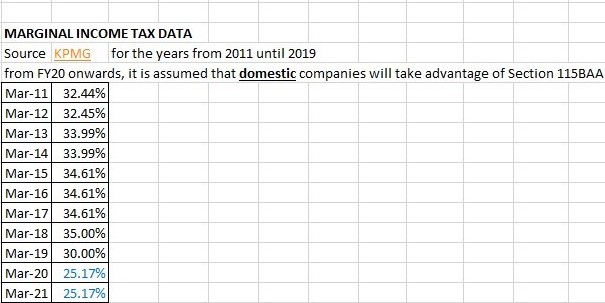
As a side note: You will observe that Income Tax rates have declined by 10% in the past 3 years! Hence part of the reason net profits have increased for many companies is because of this huge deduction in IT rates. Thus, it makes sense to analyze operational performance using pre-tax ratios
Hi Amol. Very well thought-out Excel. Greatly appreciate that you have shared it here for free. One question - does Screener allow use of more than one template? I also have one from Dr. Vijay Malik and would like to use both for some time…
This is good.
However, in row 86 in “Financial statement” tab, note that interest tax shield need not be deduced separately while calculating FCFF because interest is already added back in CFO calculation (you can verify this in firm annual report). So, since you are not getting a tax break on interest expense in CFO, you need not subtract this explicitly in your calculations. This would lead to double counting.
Above extension is very usefull can you upload more screener extension like this which same time and give all ratios and analysis in it self only in screener.
Thank you for sharing this type of useful extension and all above templates.
Hi Amol, Thanks for your wonderful excel template. Its really a great help. One thing wanted to ask was in FCFF calculation, shouldn’t we add Interest benefit to CFO rather than reducing it?