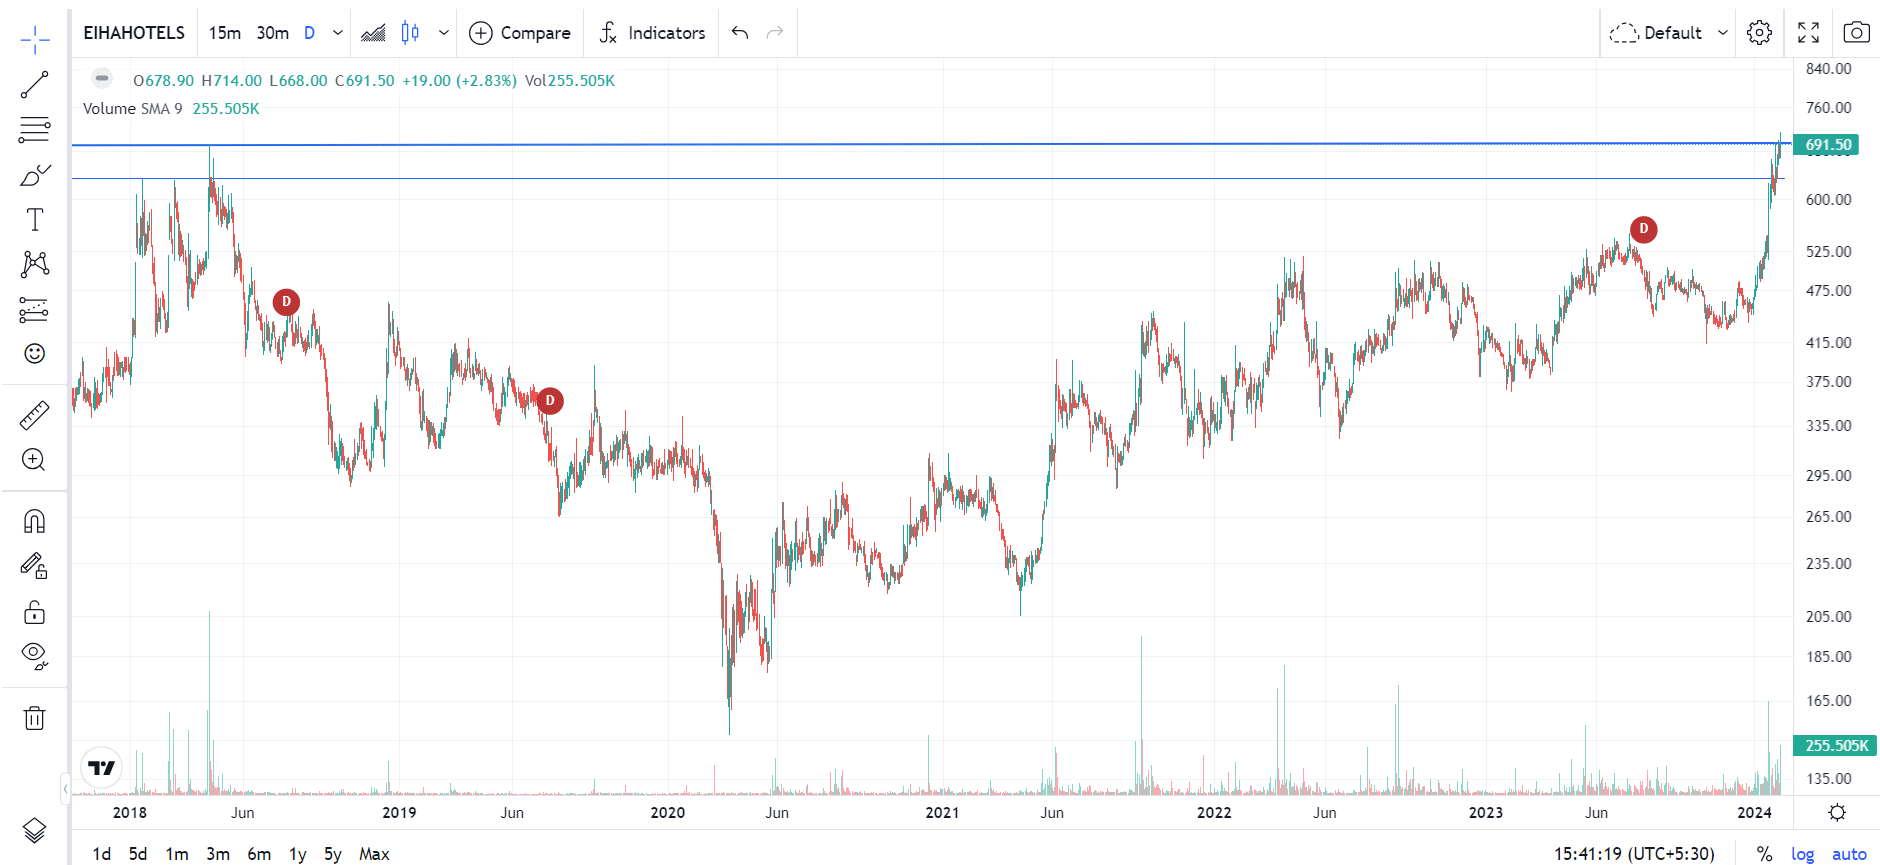
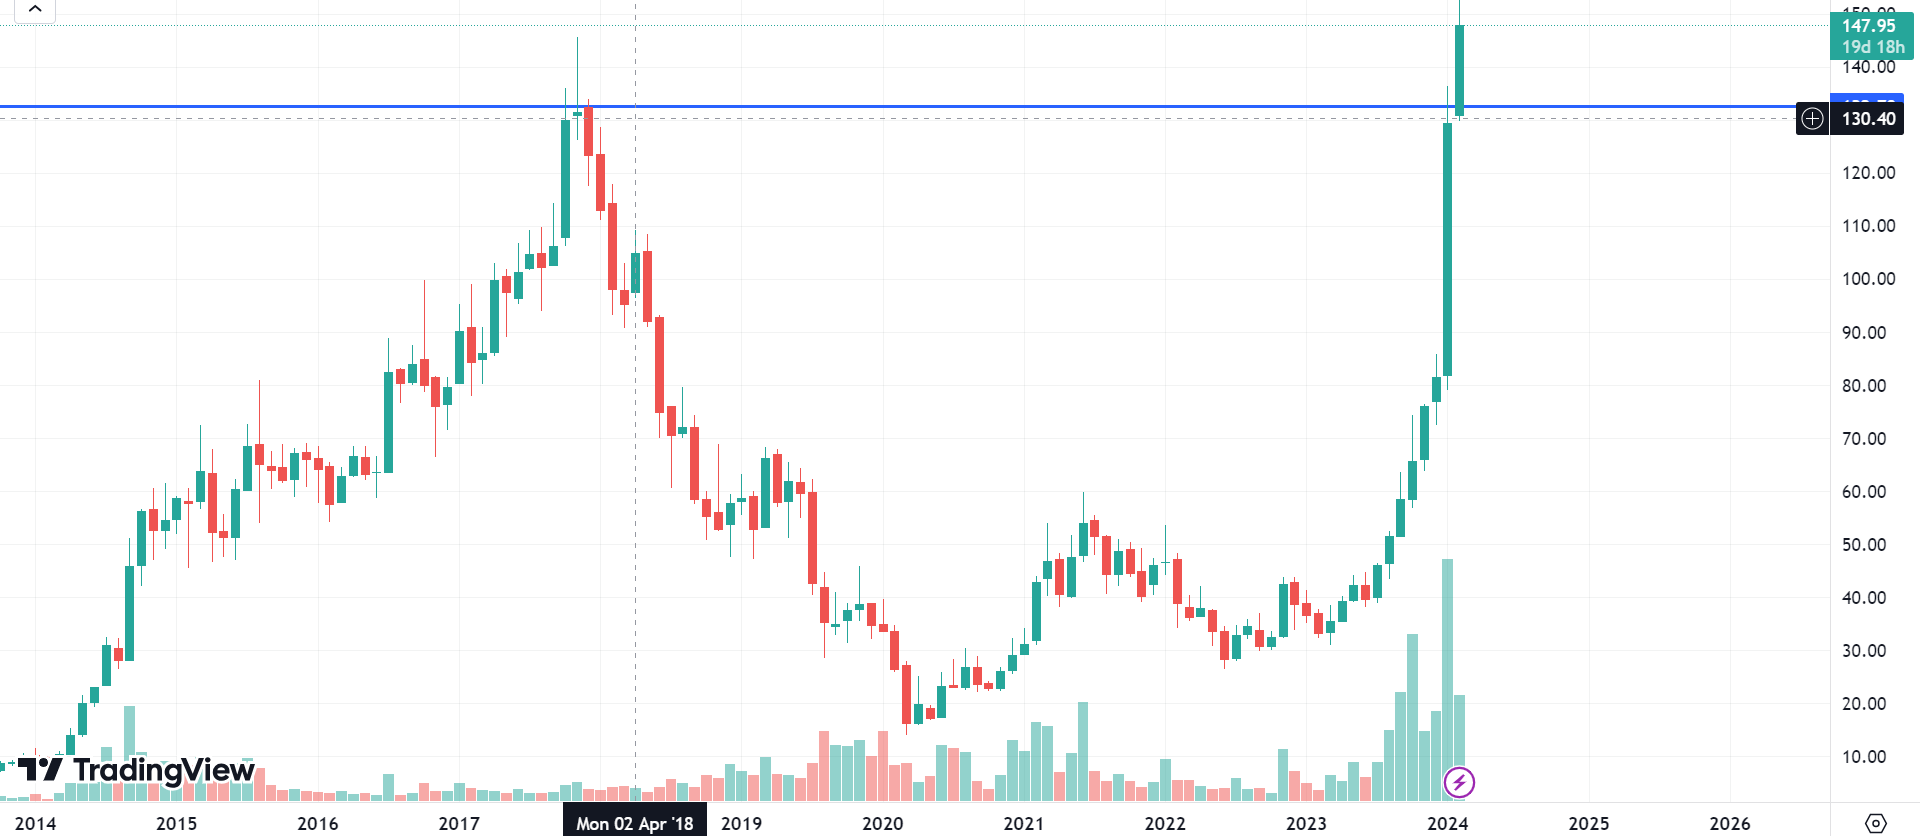
EIH Associated Hotels (CMP 691.50) owns and operates luxury five star hotels under brand names Oberoi and Trident. Its a JV between Oberoi (EIH Ltd) and Rajan Raheja Group. Today EIH Associated Hotels came out with Q3 numbers which were good. They usually make most of their profits in Q3 & Q4. As the wedding season and travel and tourism industry has gathered momentum, the same is reflected in the stock price of EIH Associated Hotels as today it has hit a All time high of 714 rs and is at an interesting level. The chart below has formed a rounding bottom and its previous high was back in mid April 2018. The stock has come out of a 6 year consolidation.
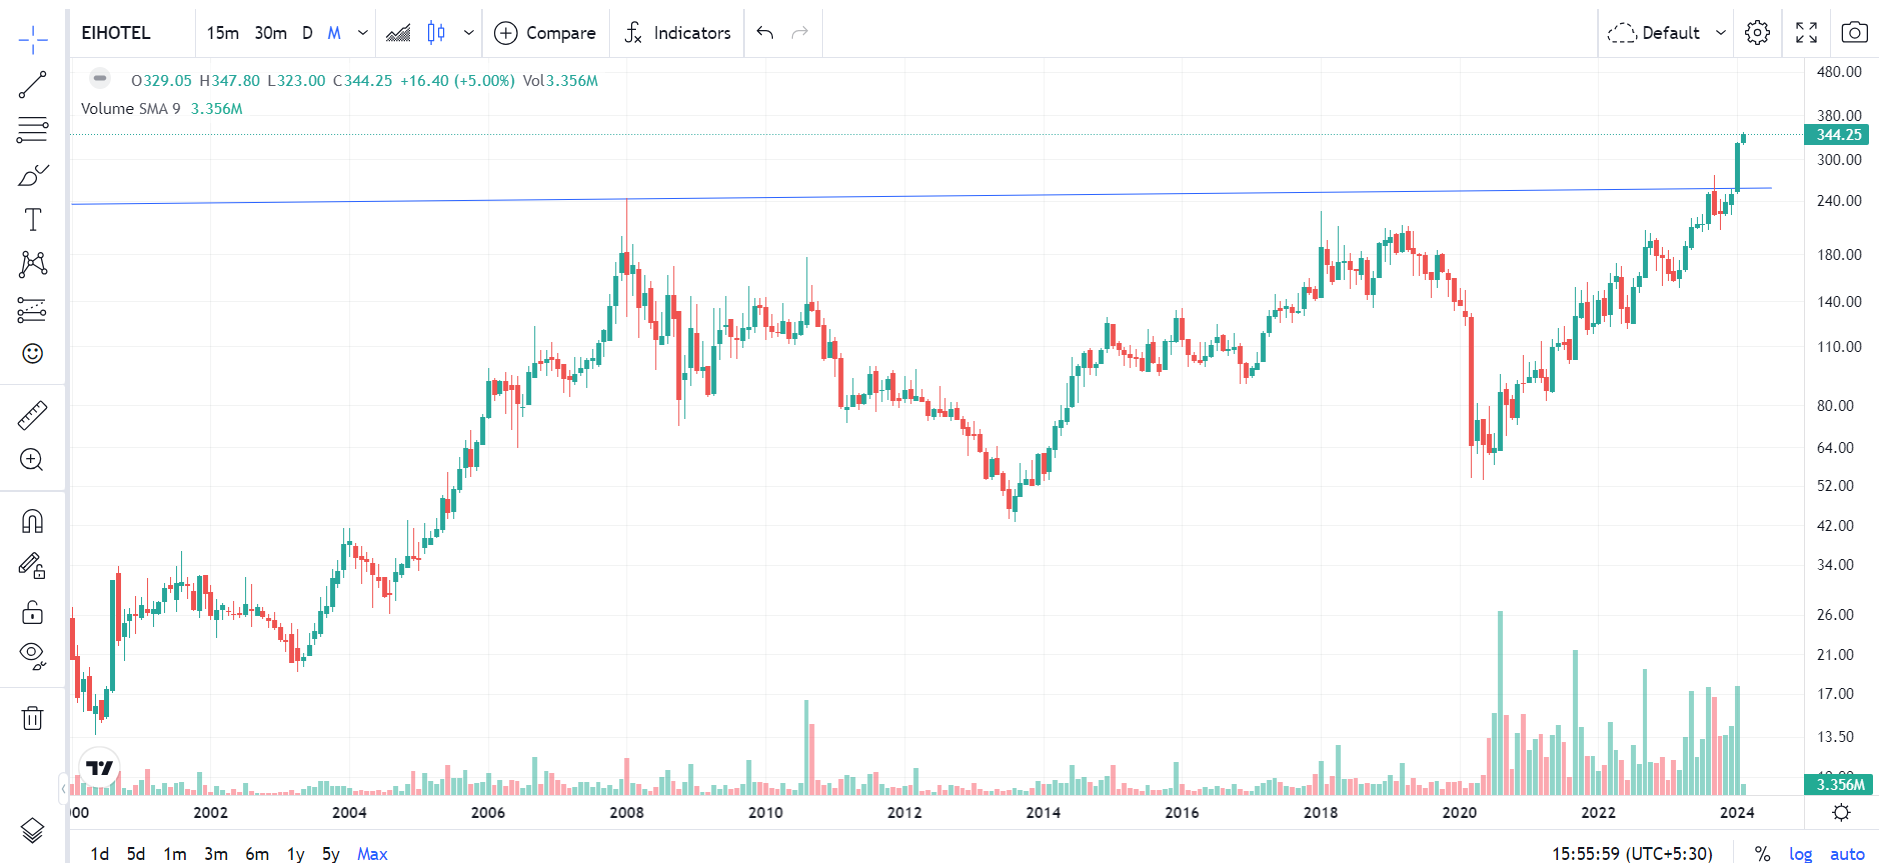
Similarly EIH Ltd (CMP 344.25) is also hitting All time high on a daily basis, on the back of strong earnings. Also better Q3 & Q4 performance is expected due to revival of hotel industry and all Q3 performances by peers were good. In case of EIH Ltd the stock cleared its previous peak of 240 which was created back in Jan 2008 and has come out of 16 year consolidation.
Sector usually trades at 60 PE X.
Disclosure : Invested in both stocks. (not a recommendation, anyone contemplating investing needs to do their own diligence).
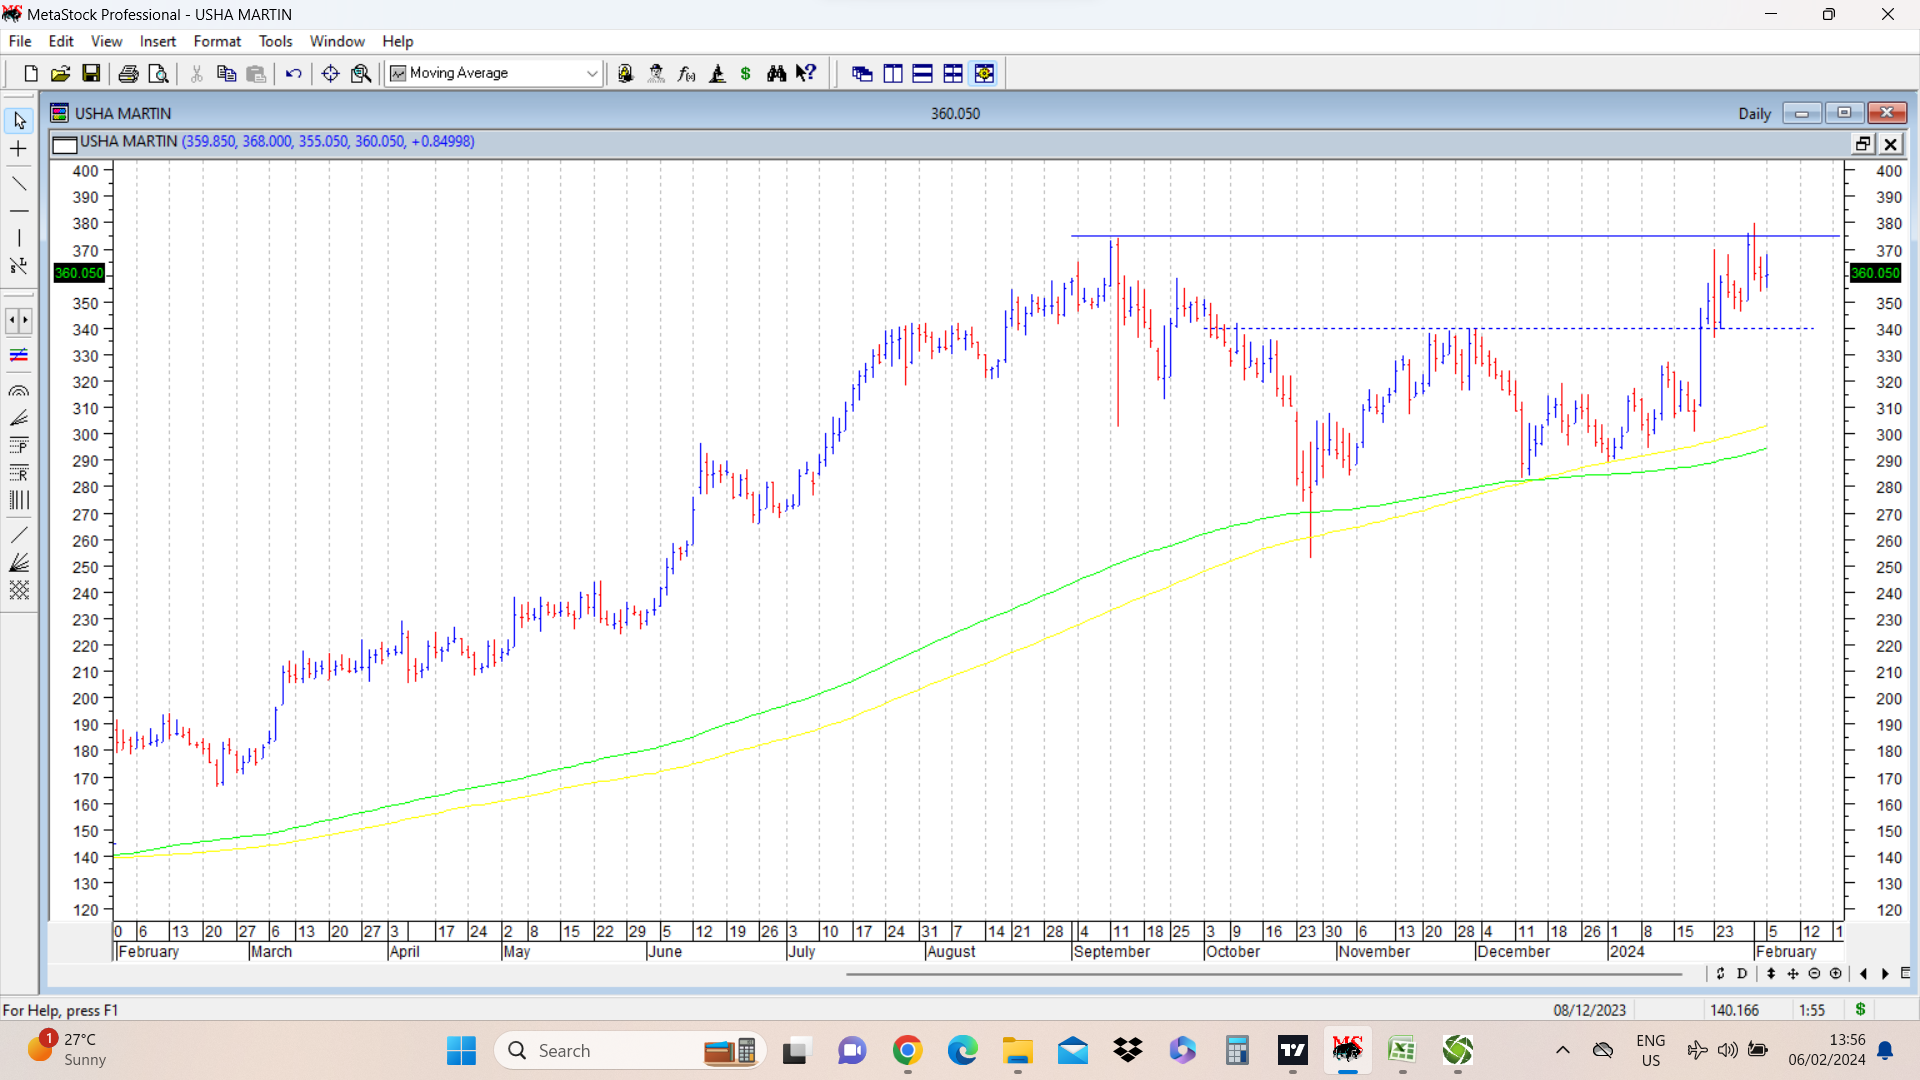
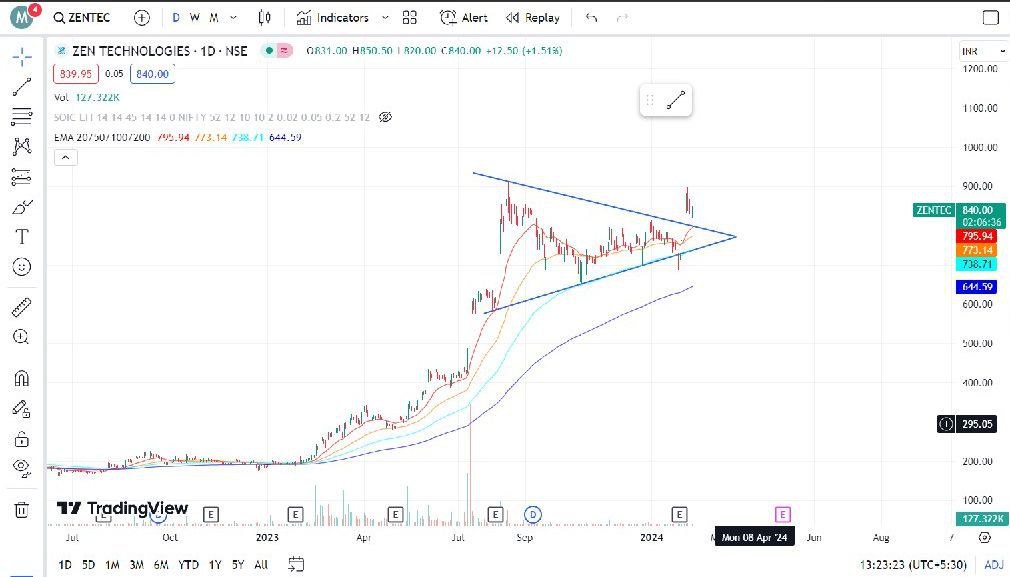
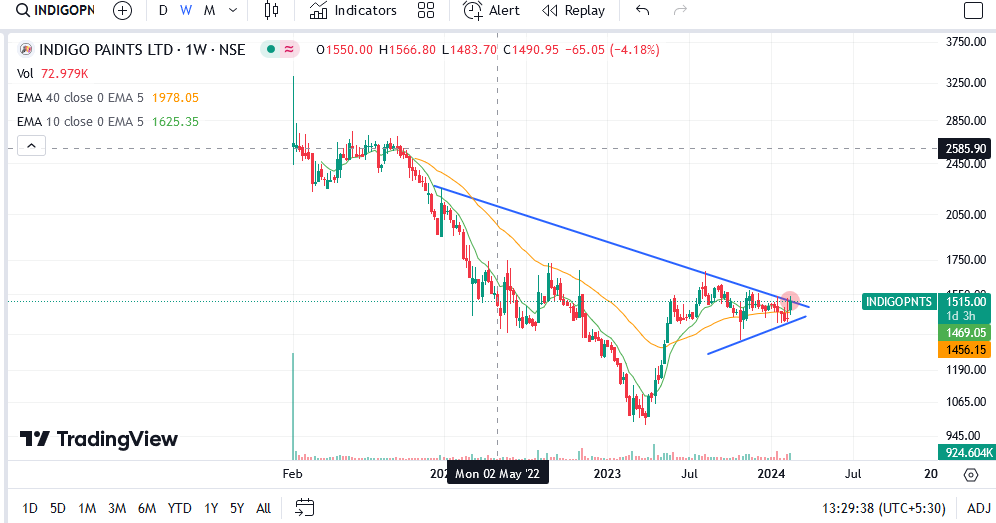
Usha Martin today came up with a decent set of Q3 FY 24 numbers. (results file attached.) The chart provides an interesting range in terms of support and resistance in the near term. Support is in vicinity of 340 (marked in dotted blue lines) and resistance is in vicinity of 370-375 (in solid blue lines). If and when stock price clears 370-375 conclusively technically target can be in vicinity of 450, based on rounding structure formation.
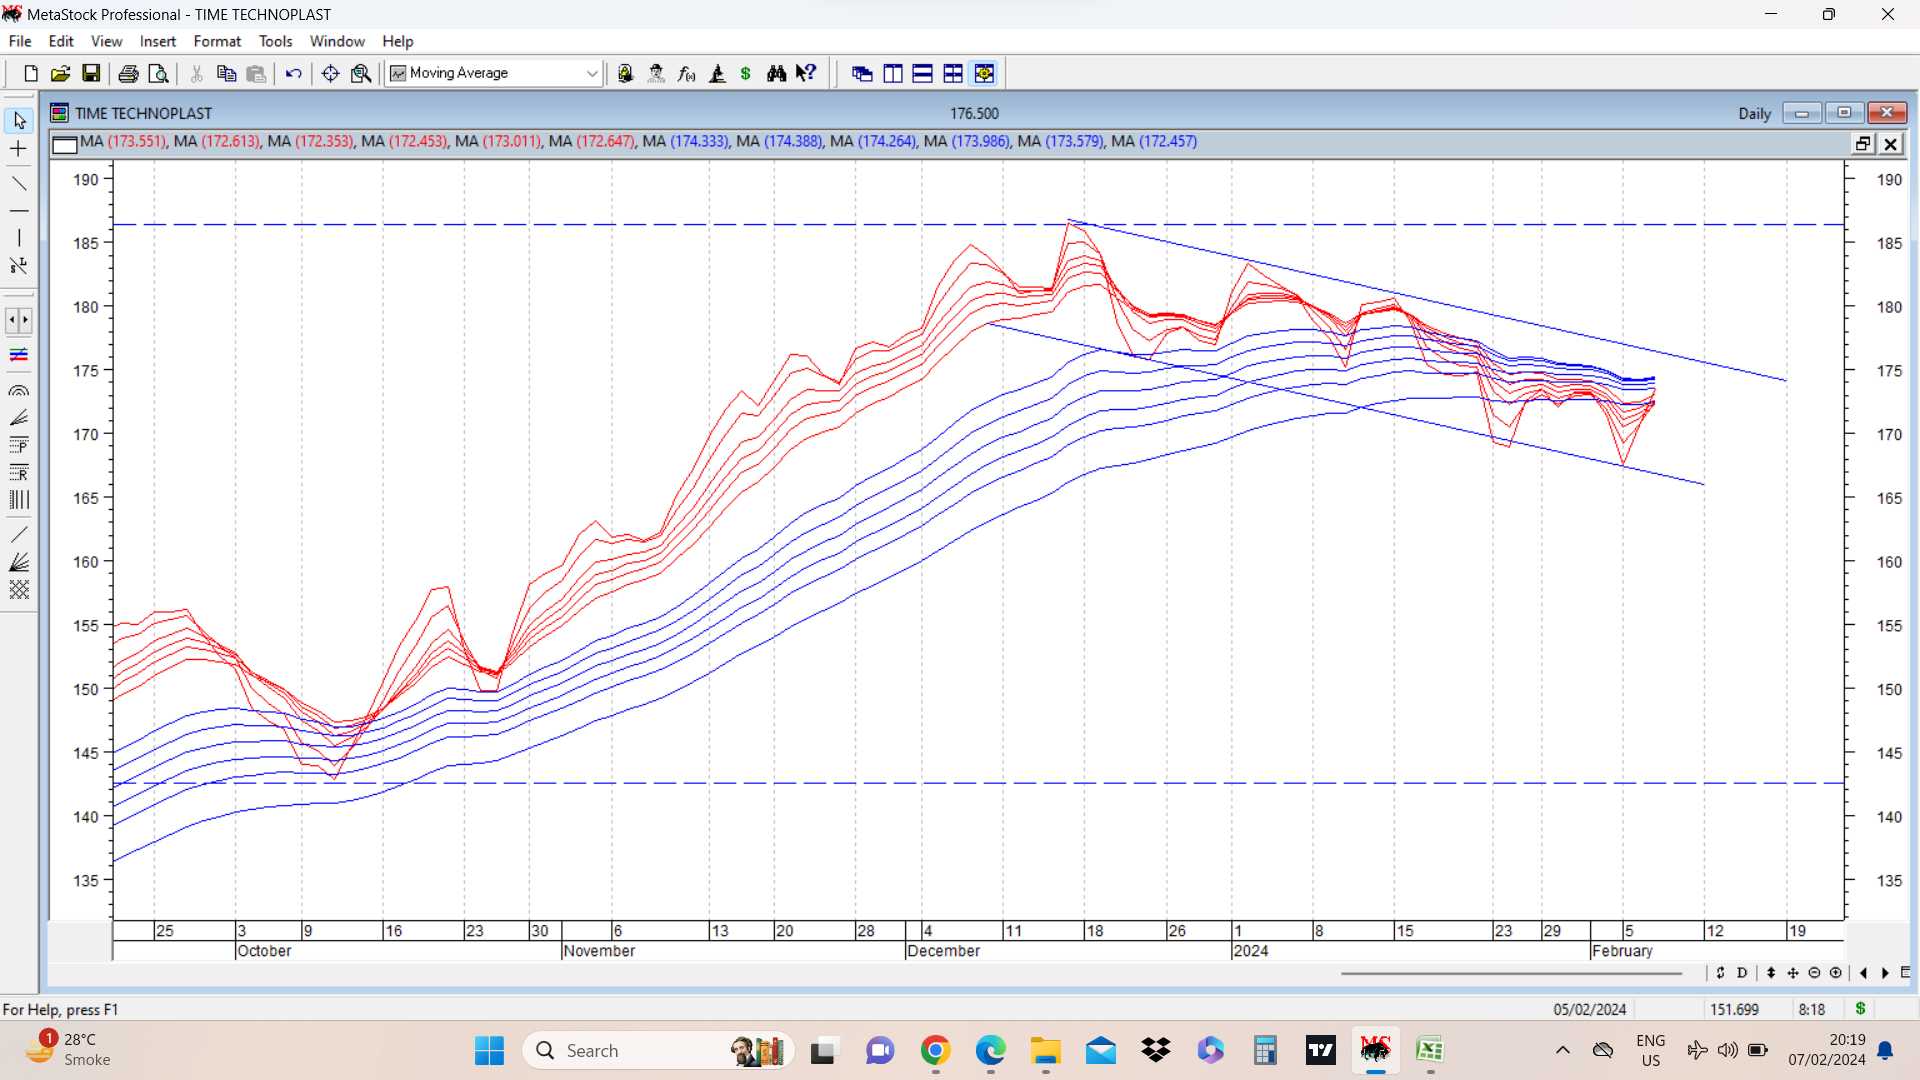
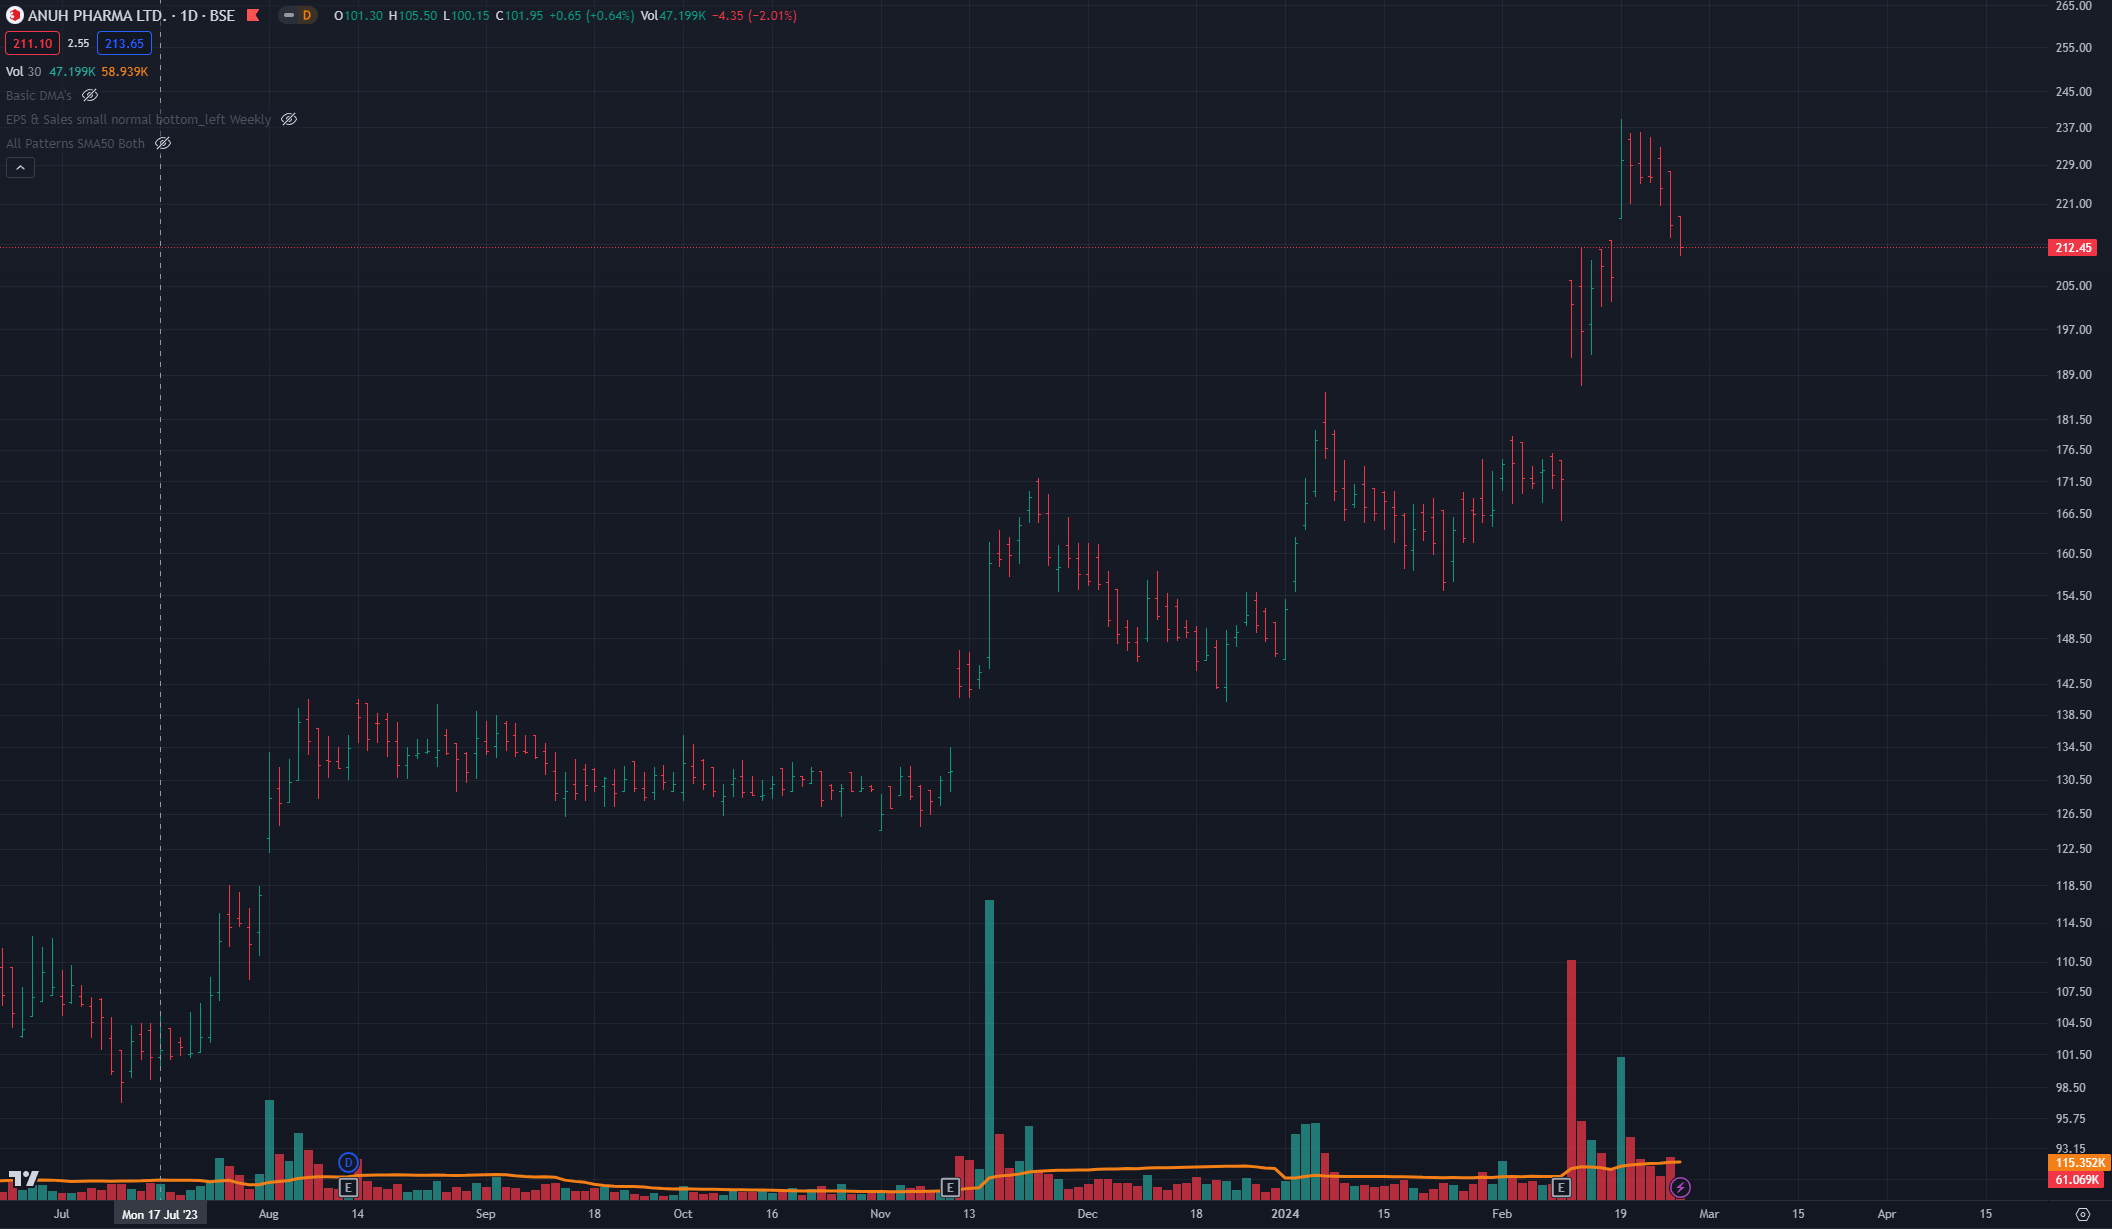
Time techno cmp 175 has been making a variety of technical patterns without going up meaningfully. Keeps giving knowledge on technical analysis without significant returns since past few weeks… Sometimes it takes a long time for markets to forgive a company with respect to its past sins.
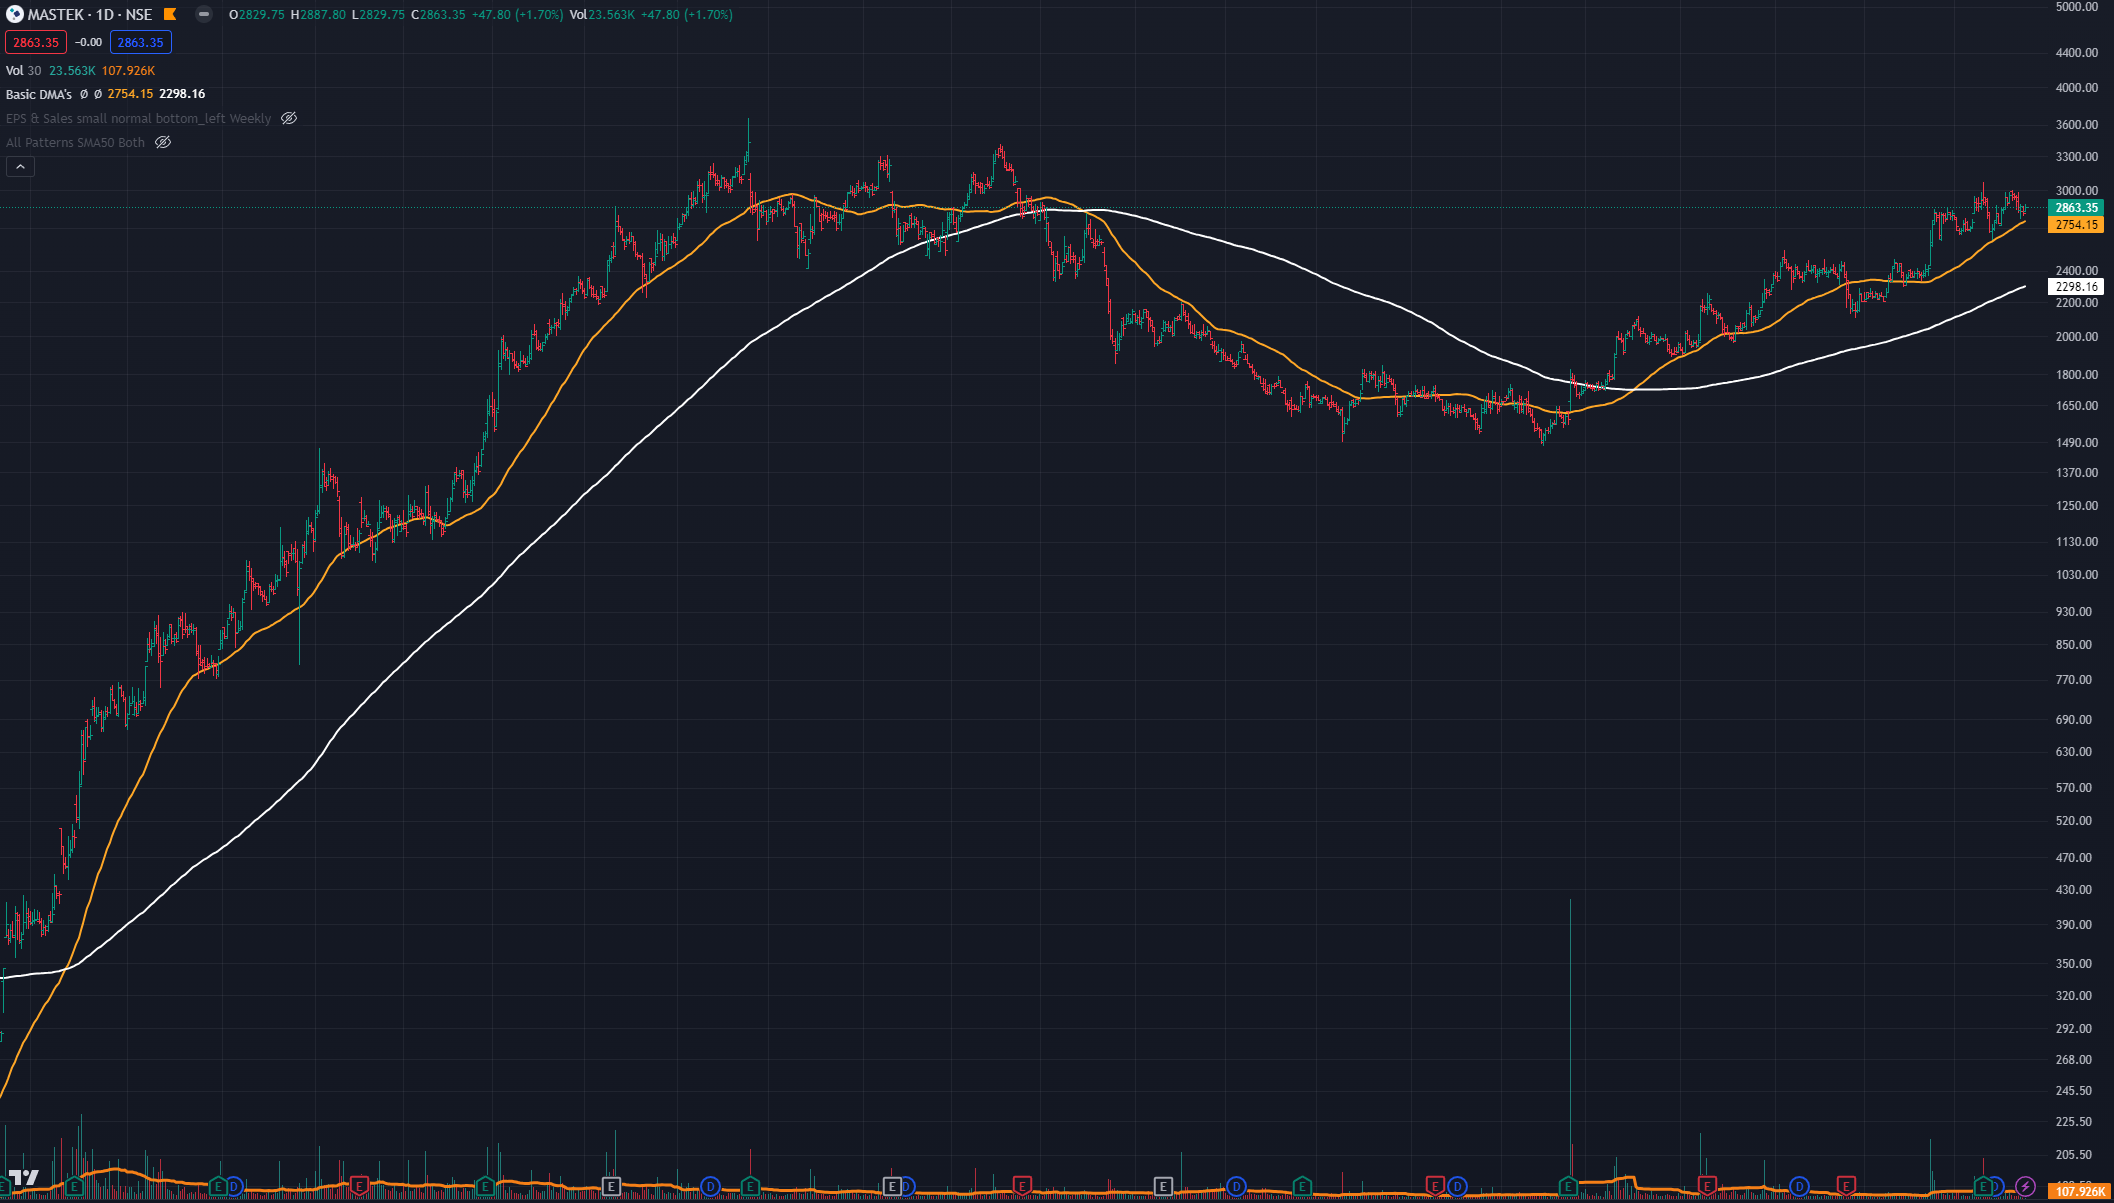
To add to the list of patterns, a flag like pattern is viaible on GMMA ( guppy multiple moving averages) charts. Attached below. Flag extends from 145 to 185, a distance of 40 rs. Breakout point is at 175. There is compression of long term (blue) and short term (red) moving averages. Successful breakout can provide near term target of 215.
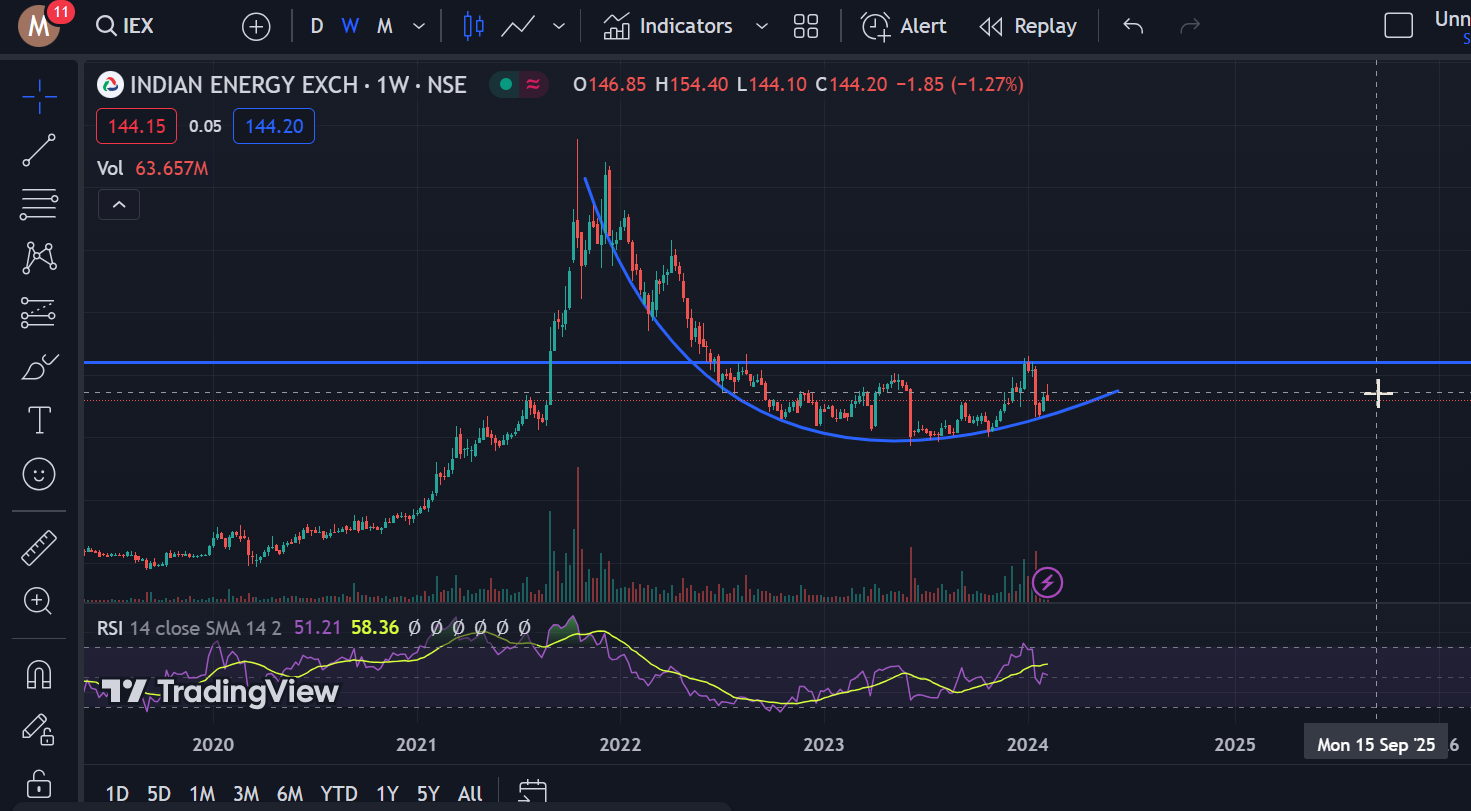
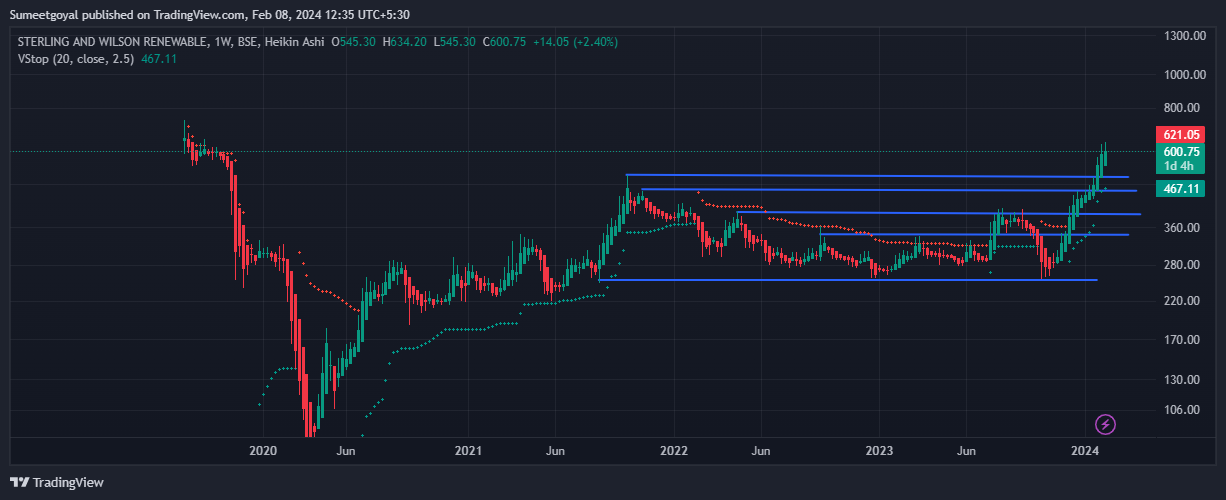
Chart of Sterling & Wilson Renewable
Crossing all its hurdles. Last hurdle now almost 100 points away. Continuously outperforming and can prove to be great turnaround story. In December, it successfully reduced its debt by successfully raising funds through QIP. Company was underperforming due to heavy debt and which led to default on loan installments last year which affected its order inflow as well. Now in the con-call the management has stated that in Q4 they will be able to catch up the revenue loss in the Q3 and whatever anticipated earlier to be complied with.
Tailwinds are visible in the sector for longer period of time.
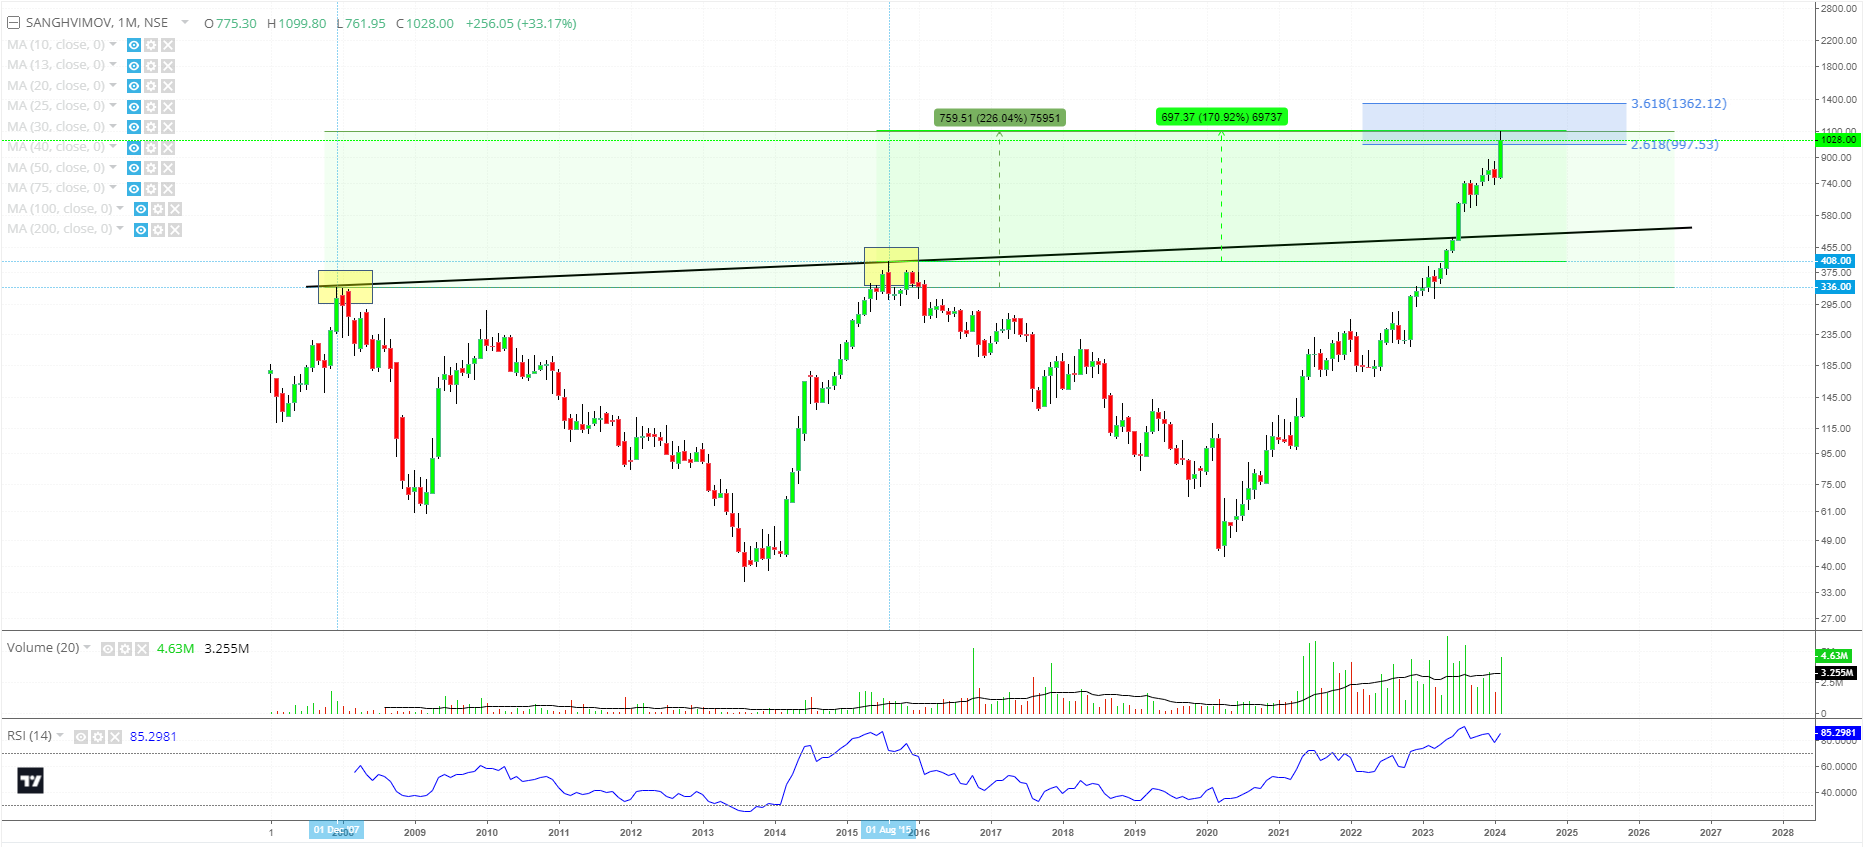
Shakeouts at multiple junctures along with positive RSI divergences
A multi year upward slant breakout.
Has all led to it making an ATH. Monthly chart below
Returns from Dec 2007 Top to 1099, 3.2x in 17 years…
Returns from Aug 2015 Top to 1099, 2.8x in 9 years…
If business performance continues and narratives around wind energy and infra continue, assuming 30-40% drawdowns ( if and when they come), longer term bullish bias still maintained.
Many thanks for spreading knowledge. After your last assessment about NBCC, the stock has been on a non-stop rally reaching to the highs of 168 and now is cooling down. It seems that the stock has run quite a lot and has also reached a 6 year high backed by good volumes however as the results will be coming on 13 Feb. Do you think that the earnings will be able to justify this sharp rally or this was due to the craze built on the PSU theme. Please can you share your current assessment of the stock, whether it has still some steam left or is it time to be cautious? Many thanks in advance.
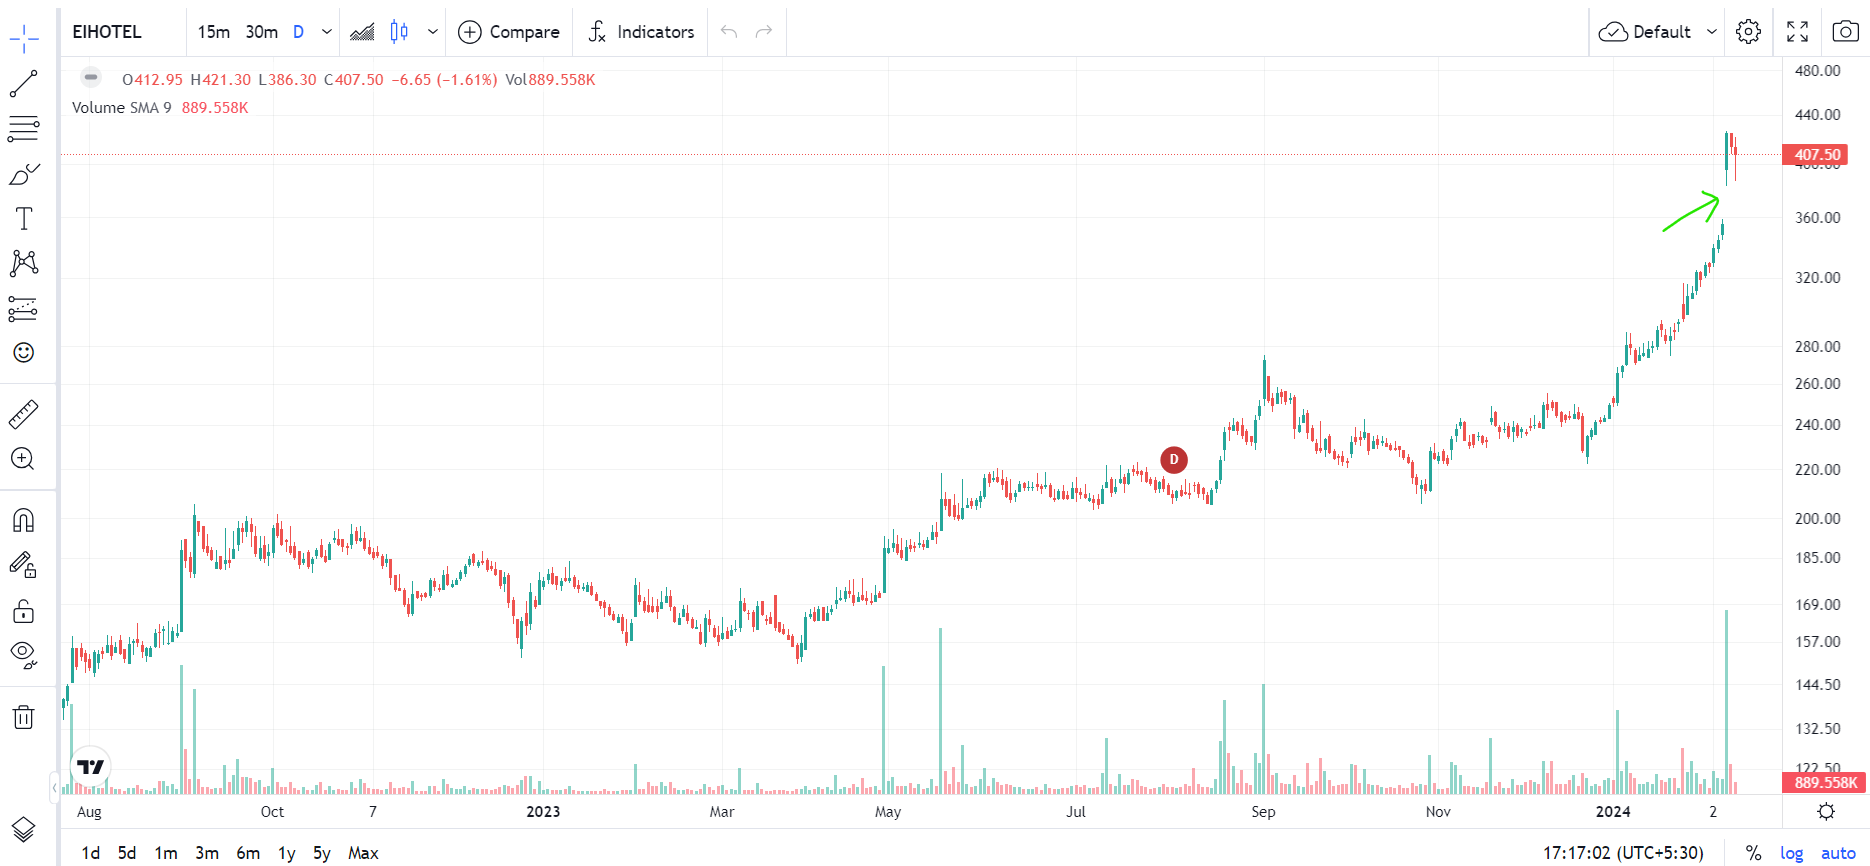
EIH Ltd (CMP 407.50)- Update. EIH ltd came up with good Q3 earnings and the stock price gapped up almost locking in upper circuit, this gap up opening is also known as a “runaway gap” which is new to me as I am also learning. The same is explained below and shown in the image below.
Runaway gaps are also called measuring gaps, which are caused by increased interest in the stock. For runaway gaps to the upside, it usually represents traders who did not get in during the initial move of the uptrend and while waiting for a retracement in price, they decided it was not going to happen.
There is increased buying interest all of a sudden and the price gaps above the previous day’s close. This type of runaway gap represents an almost panic state among traders and a good uptrend can have runaway gaps caused by significant news events that cause new interest in the stock. There is a significant increase in volume during and after the runaway gap.
It will be interesting to see how this Runaway gap plays out.
Disclosure : Invested in EIH Ltd. (not a recommendation, anyone contemplating investing needs to do their own diligence).
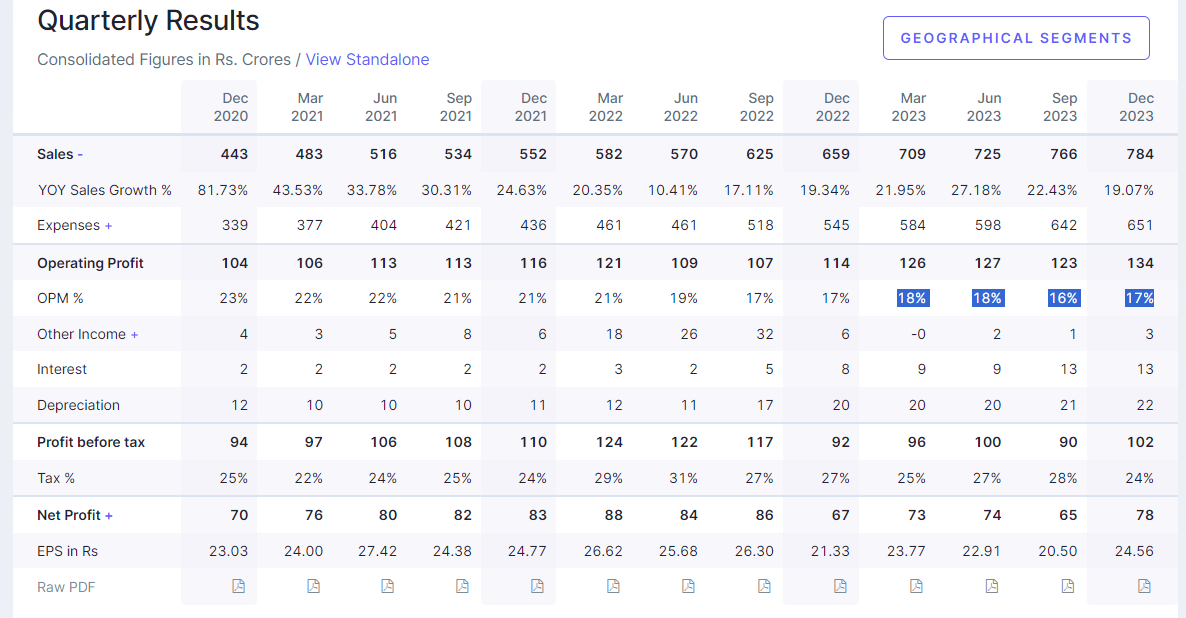
Time techno q3 fy 24 results out and finally seems there is something to cheer about. Good q3 fy 24 results with good growth in both segments, the polymer and composite segments. And the subsidiary stake sale gathers pace with divestment of 50% stake in the Middle east (which accounts for 7.5% of total revenues) for an amount valued at 25 million USD.
Other non core assets sale of 125 crores plus approval to sale of Southern India based assets (already mentioned in an earlier announcement on the bourses) worth 26 crores.
Management commentary related to the business in presentation comes across as strong. Need to listen in to concall to get a better idea about how things are panning out.
Very interesting chart with almost 3 years of consolidation taking place. The OPM has been steady at 17% during the negative IT cycle. The sales growth has been quite healthy. When the cycle turns hopefully the stock would get back to 20-22% OPM.
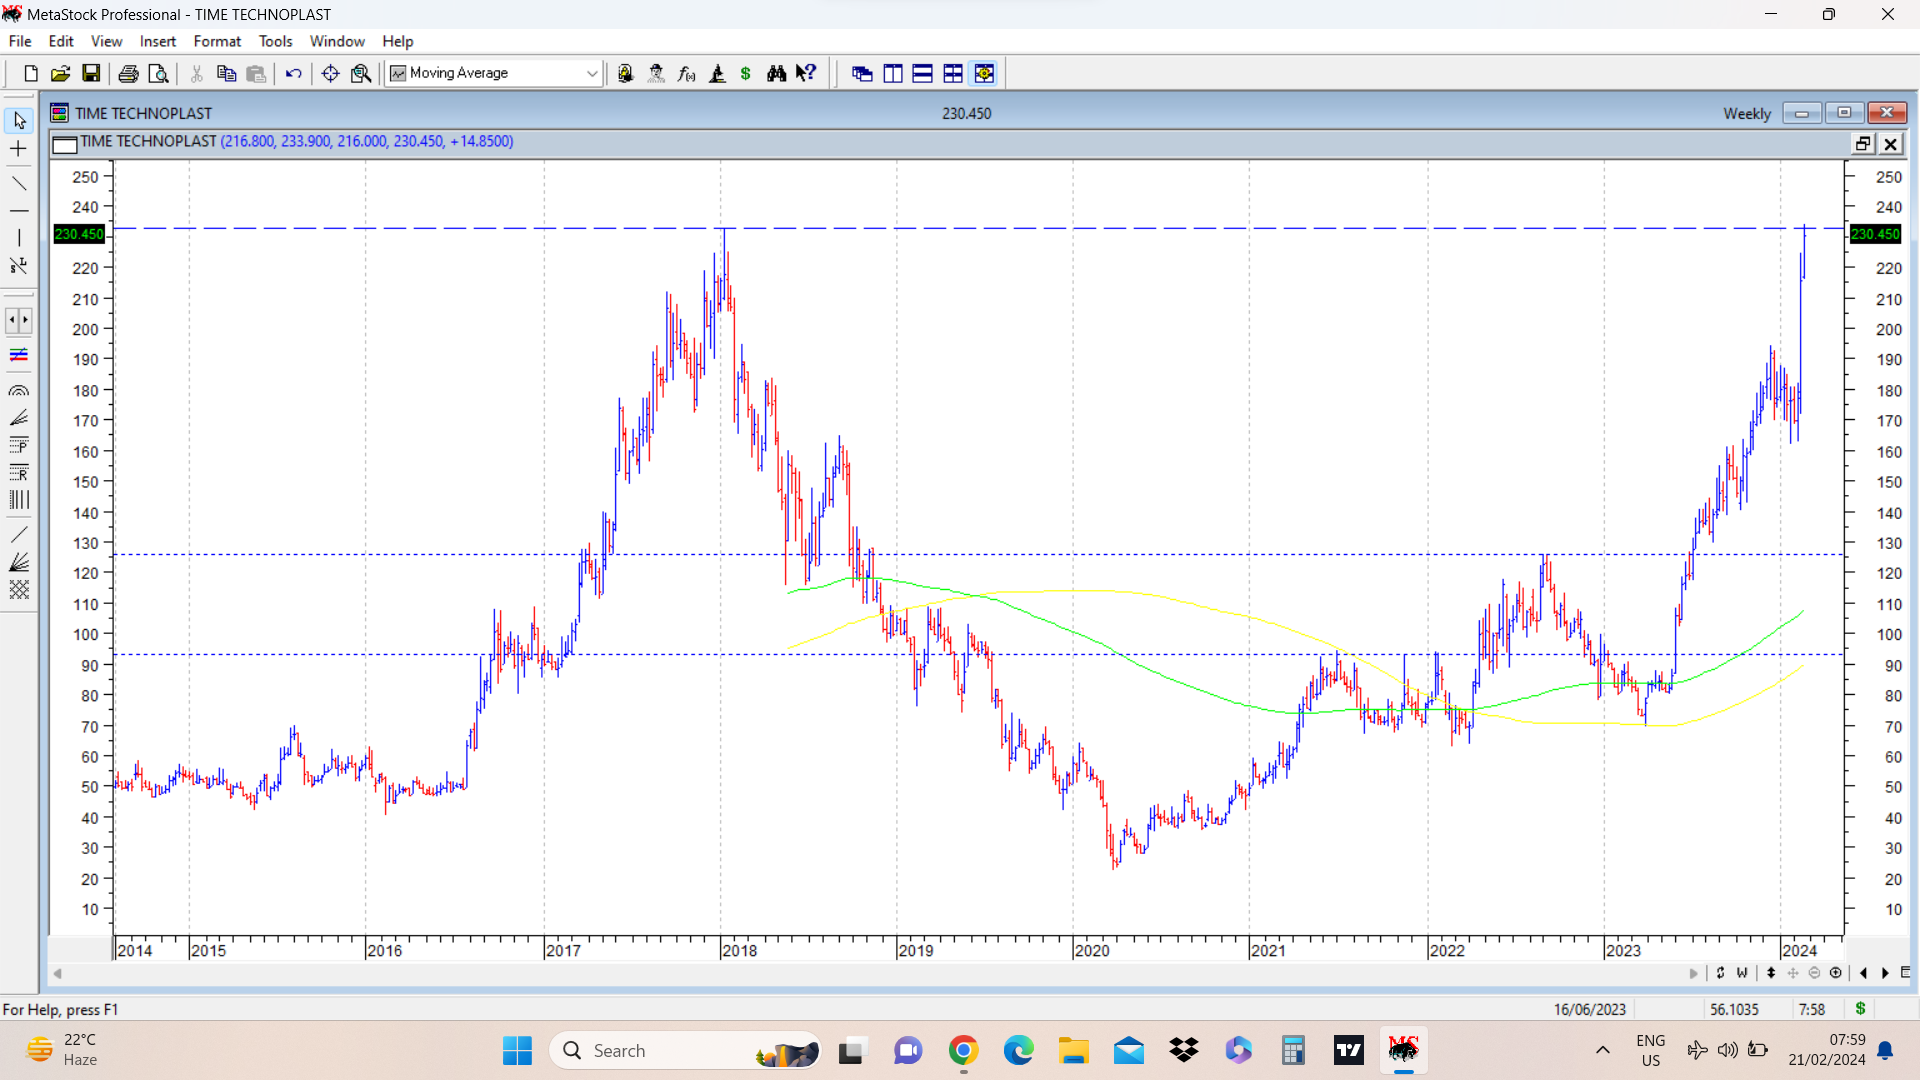
Time Techno update. cmp 230. Stock price managed to post a fresh all time high this week after 6 years. Previous ATH was 232.80 in Jan 2018. Previous important resistances marked in dotted lines
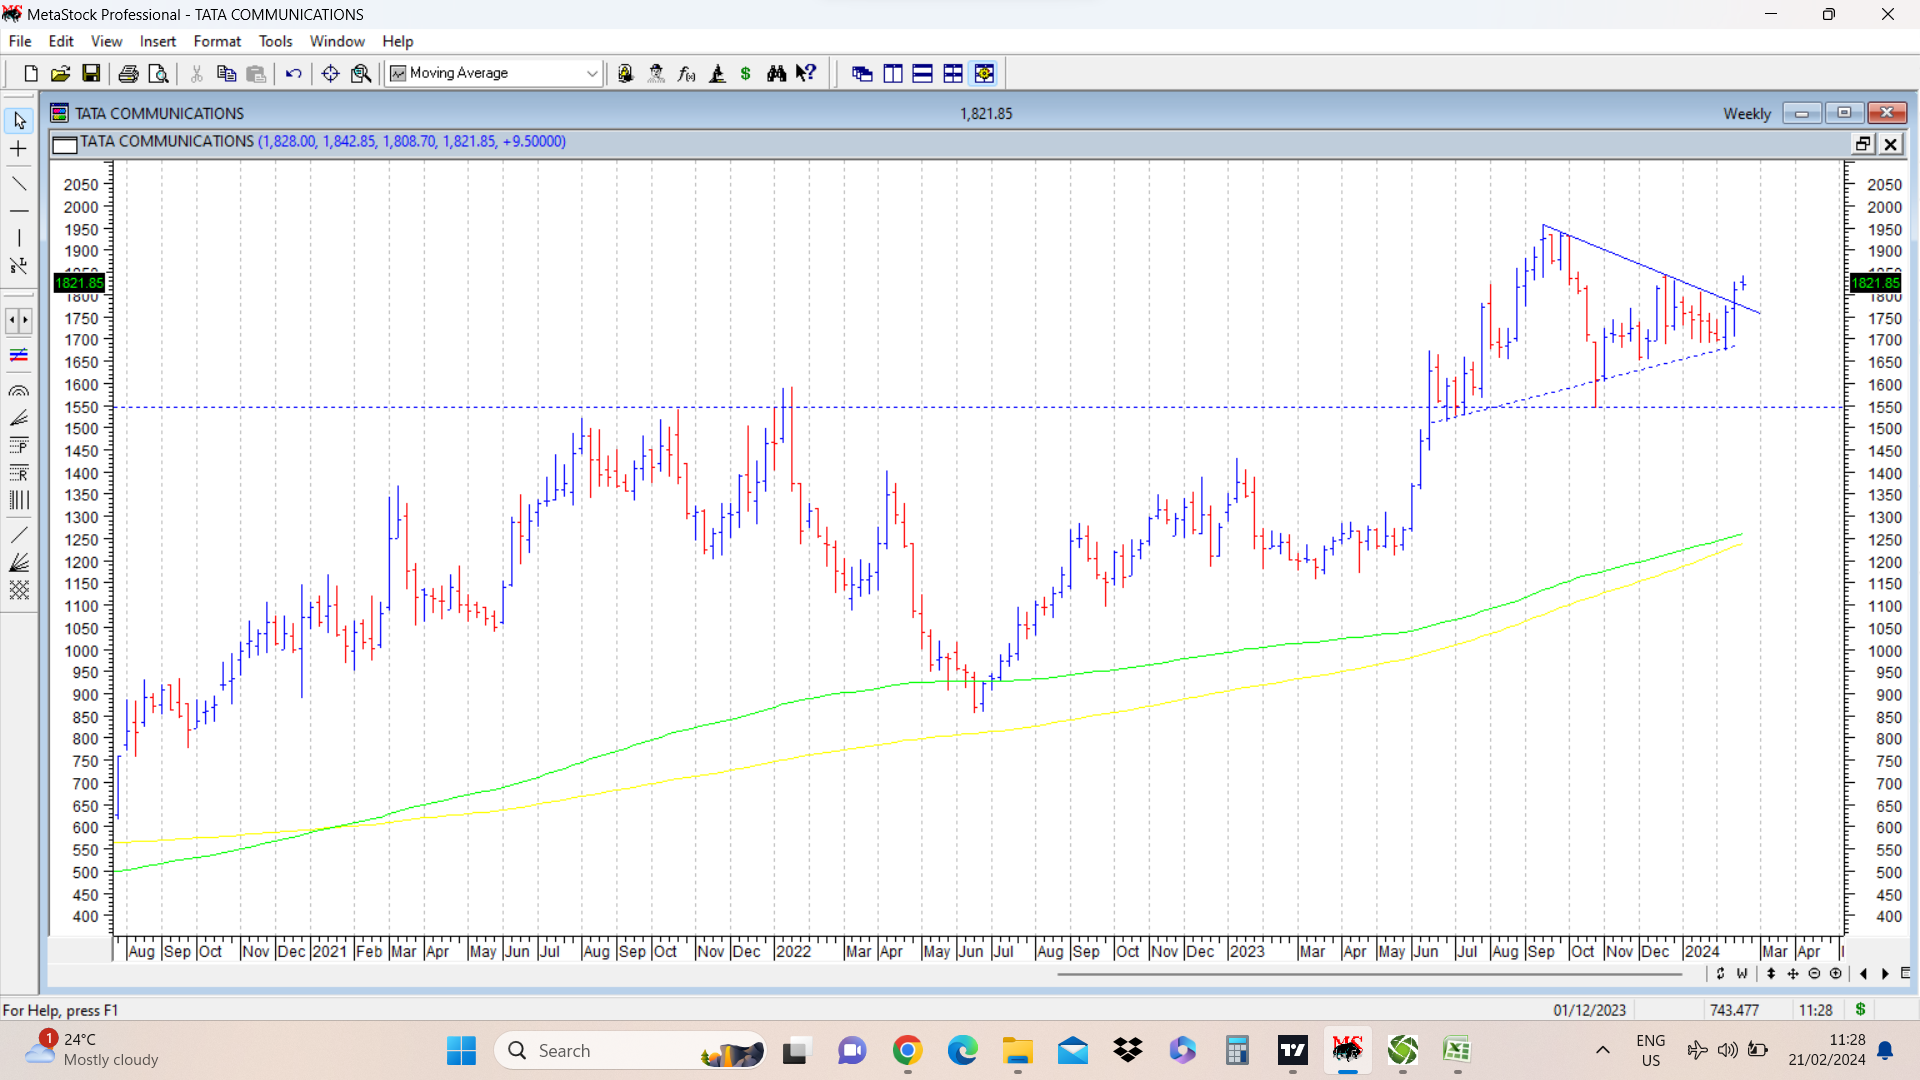
Tata communications. cmp 1818. Stock price crossed its previous major top region of 1550 and went up to post a fresh all time high of 1957. It then went into a triangular consolidation above 1550 and last week broke out from this consolidation. Currently consolidating around same levels. Fundamentally one needs to do due diligence by going through presentations, concalls etc. disc: invested as a techno funda bet.