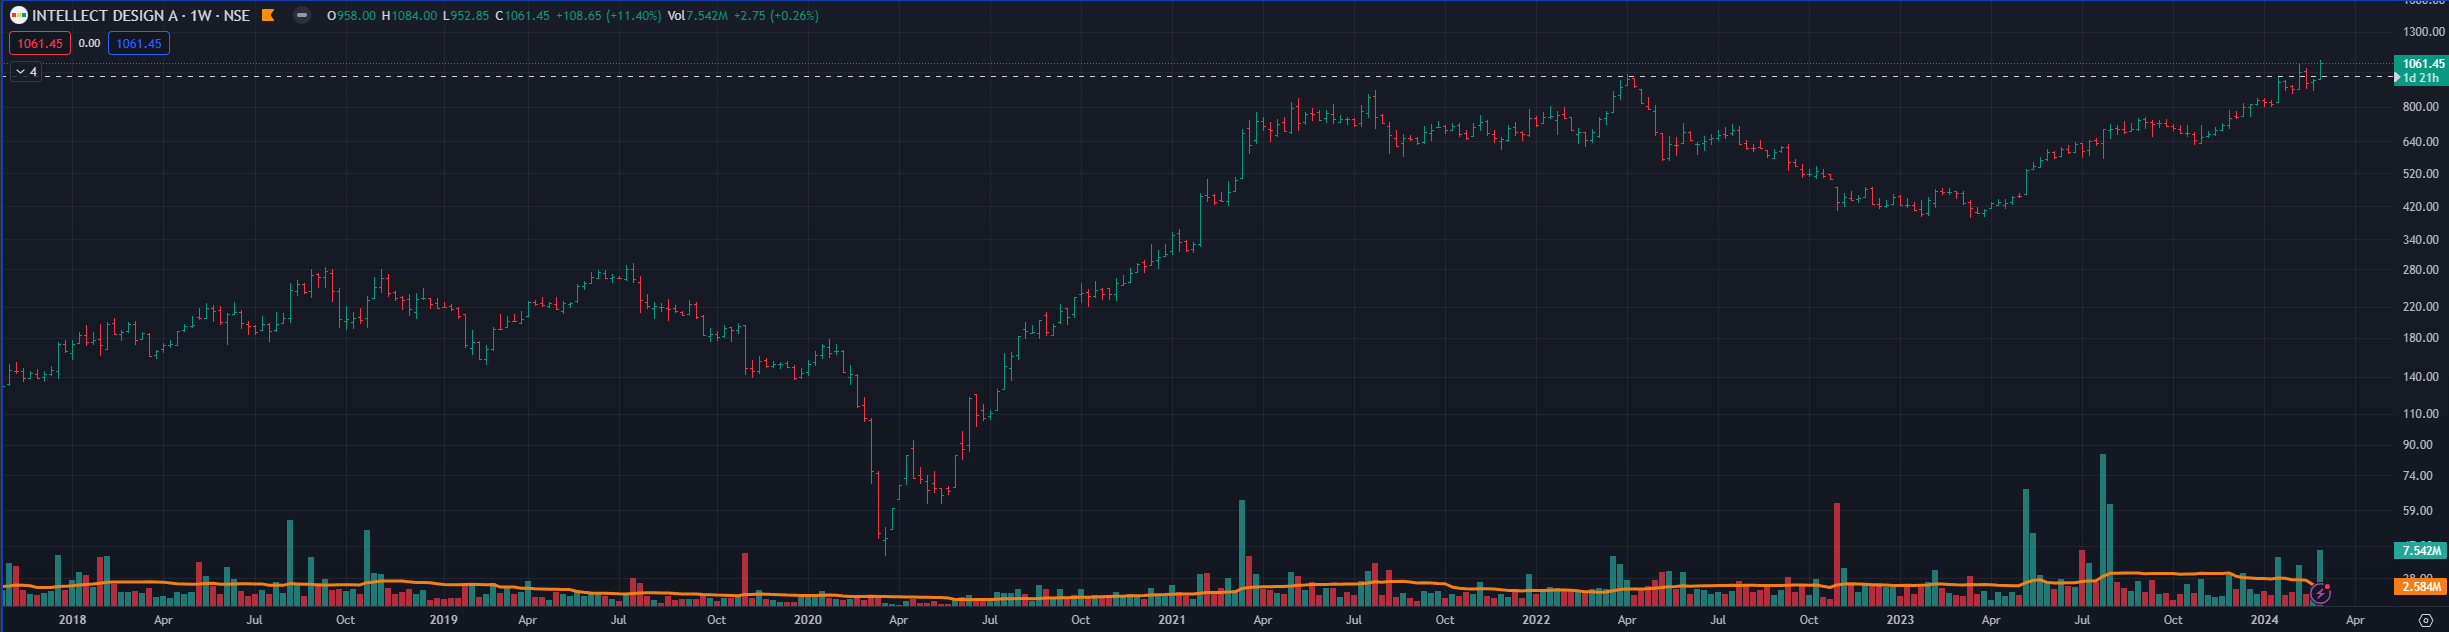
Intellect has been testing the resistance around 980 levels and have broken it with good volumes. If the supply gets absorbed at 1080 levels, we will see a good run.
Intellect provides IT solution for the banking, financial and insurance industries. The thread on Intellect covers the upcoming triggers comprehensively.
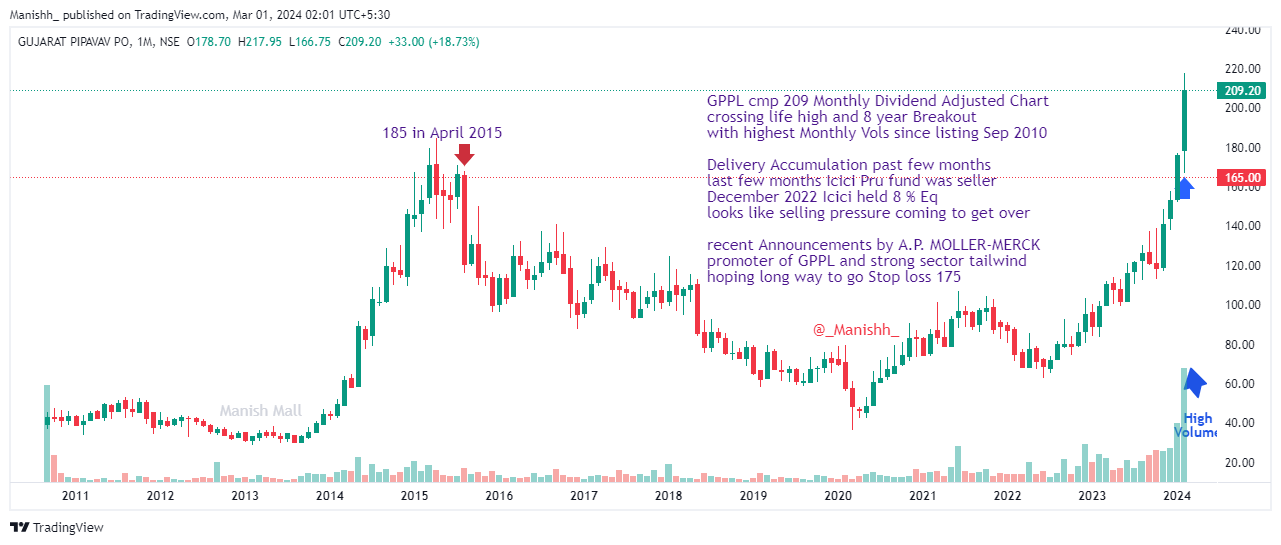
GPPL cmp 209 Monthly Dividend Adjusted Chart
crossing life high and 8 year Breakout
with highest Monthly Vols since listing Sep 2010
Higher Delivery Accumulation past few months as per Nse Data
Feb 2024 saw one of the highest delivery markings too
last few months Icici Pru fund was seller
December 2022 Icici held 8 % Eq
looks like selling pressure coming to get over
recent Announcements by A.P. MOLLER-MERCK
promoter of GPPL and strong sector tailwind
hoping long way to go… Stop loss 175
Sir, I have been reading this thread and trying to develop my understanding around “52 week highs and ATH strategy” and I must say this thread is helping me immensely. Thanks a lot for sharing so much of information. Much appreciated.
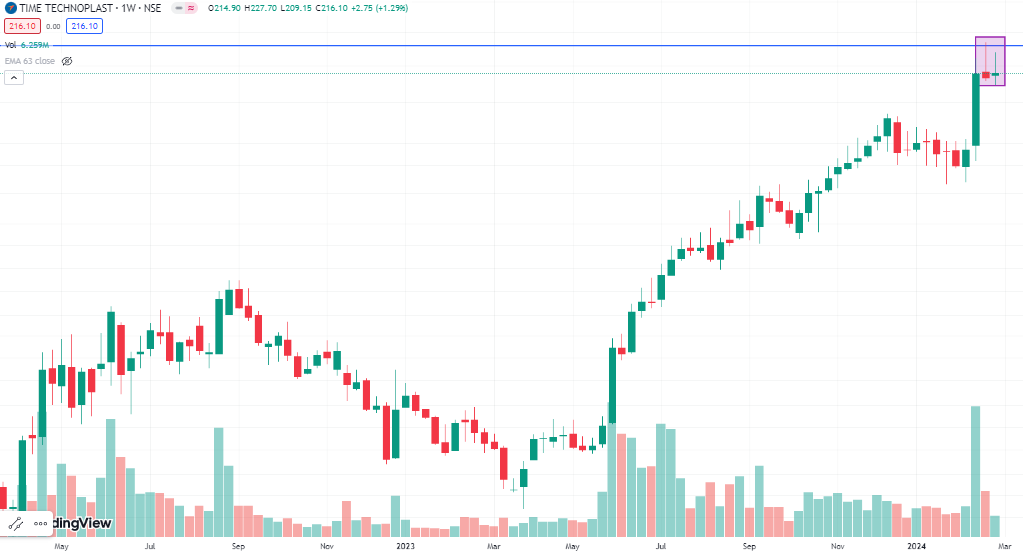
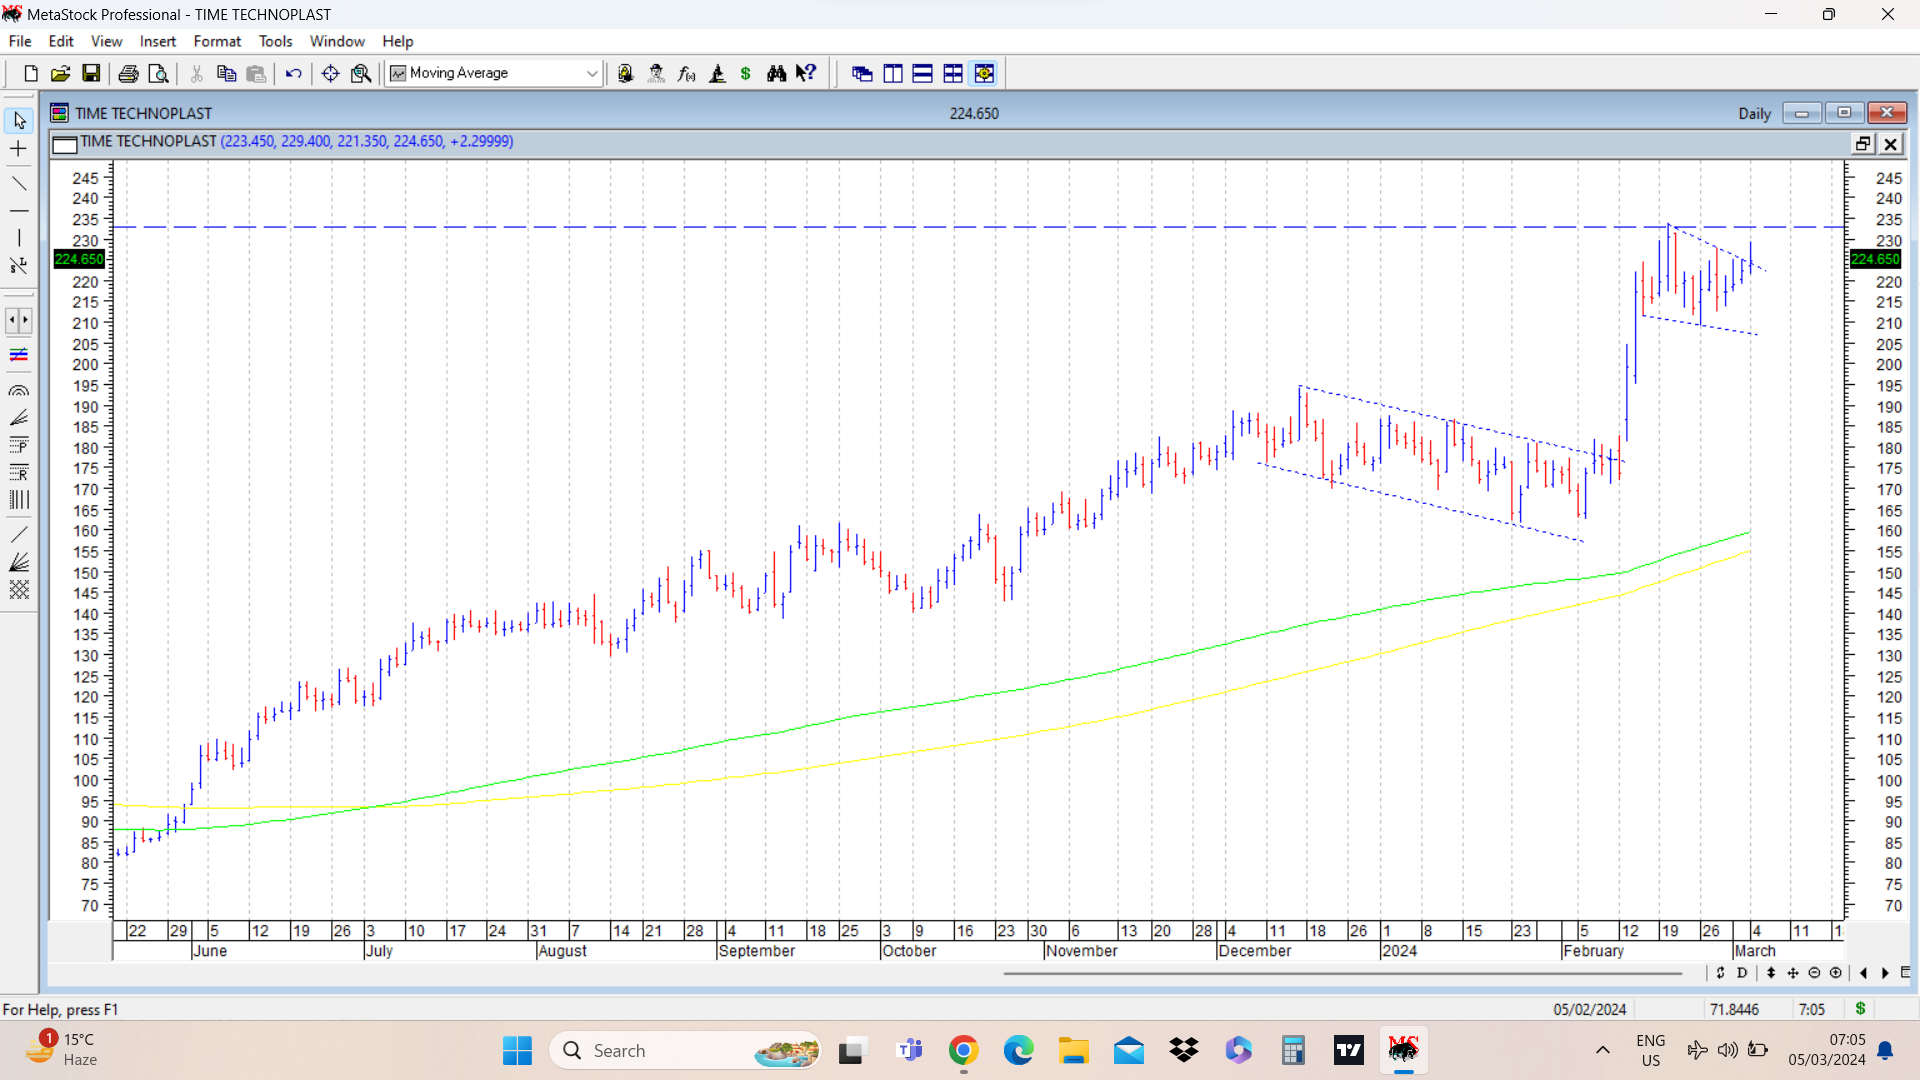
Now coming to the query that I have on Time Technoplast: The stock tried crossing ATH and managed to cross it as well (made a high of 233.90) however it could not sustain there and the weekly candles which are getting formed are looking somewhat bearish. Does this mean the breakout failed?
Hi @hitesh2710 Bhai,
I am learning technical analysis observing the examples that you share in this thread. Wanted your view point on this chart whether I am thinking in the right direction or not.
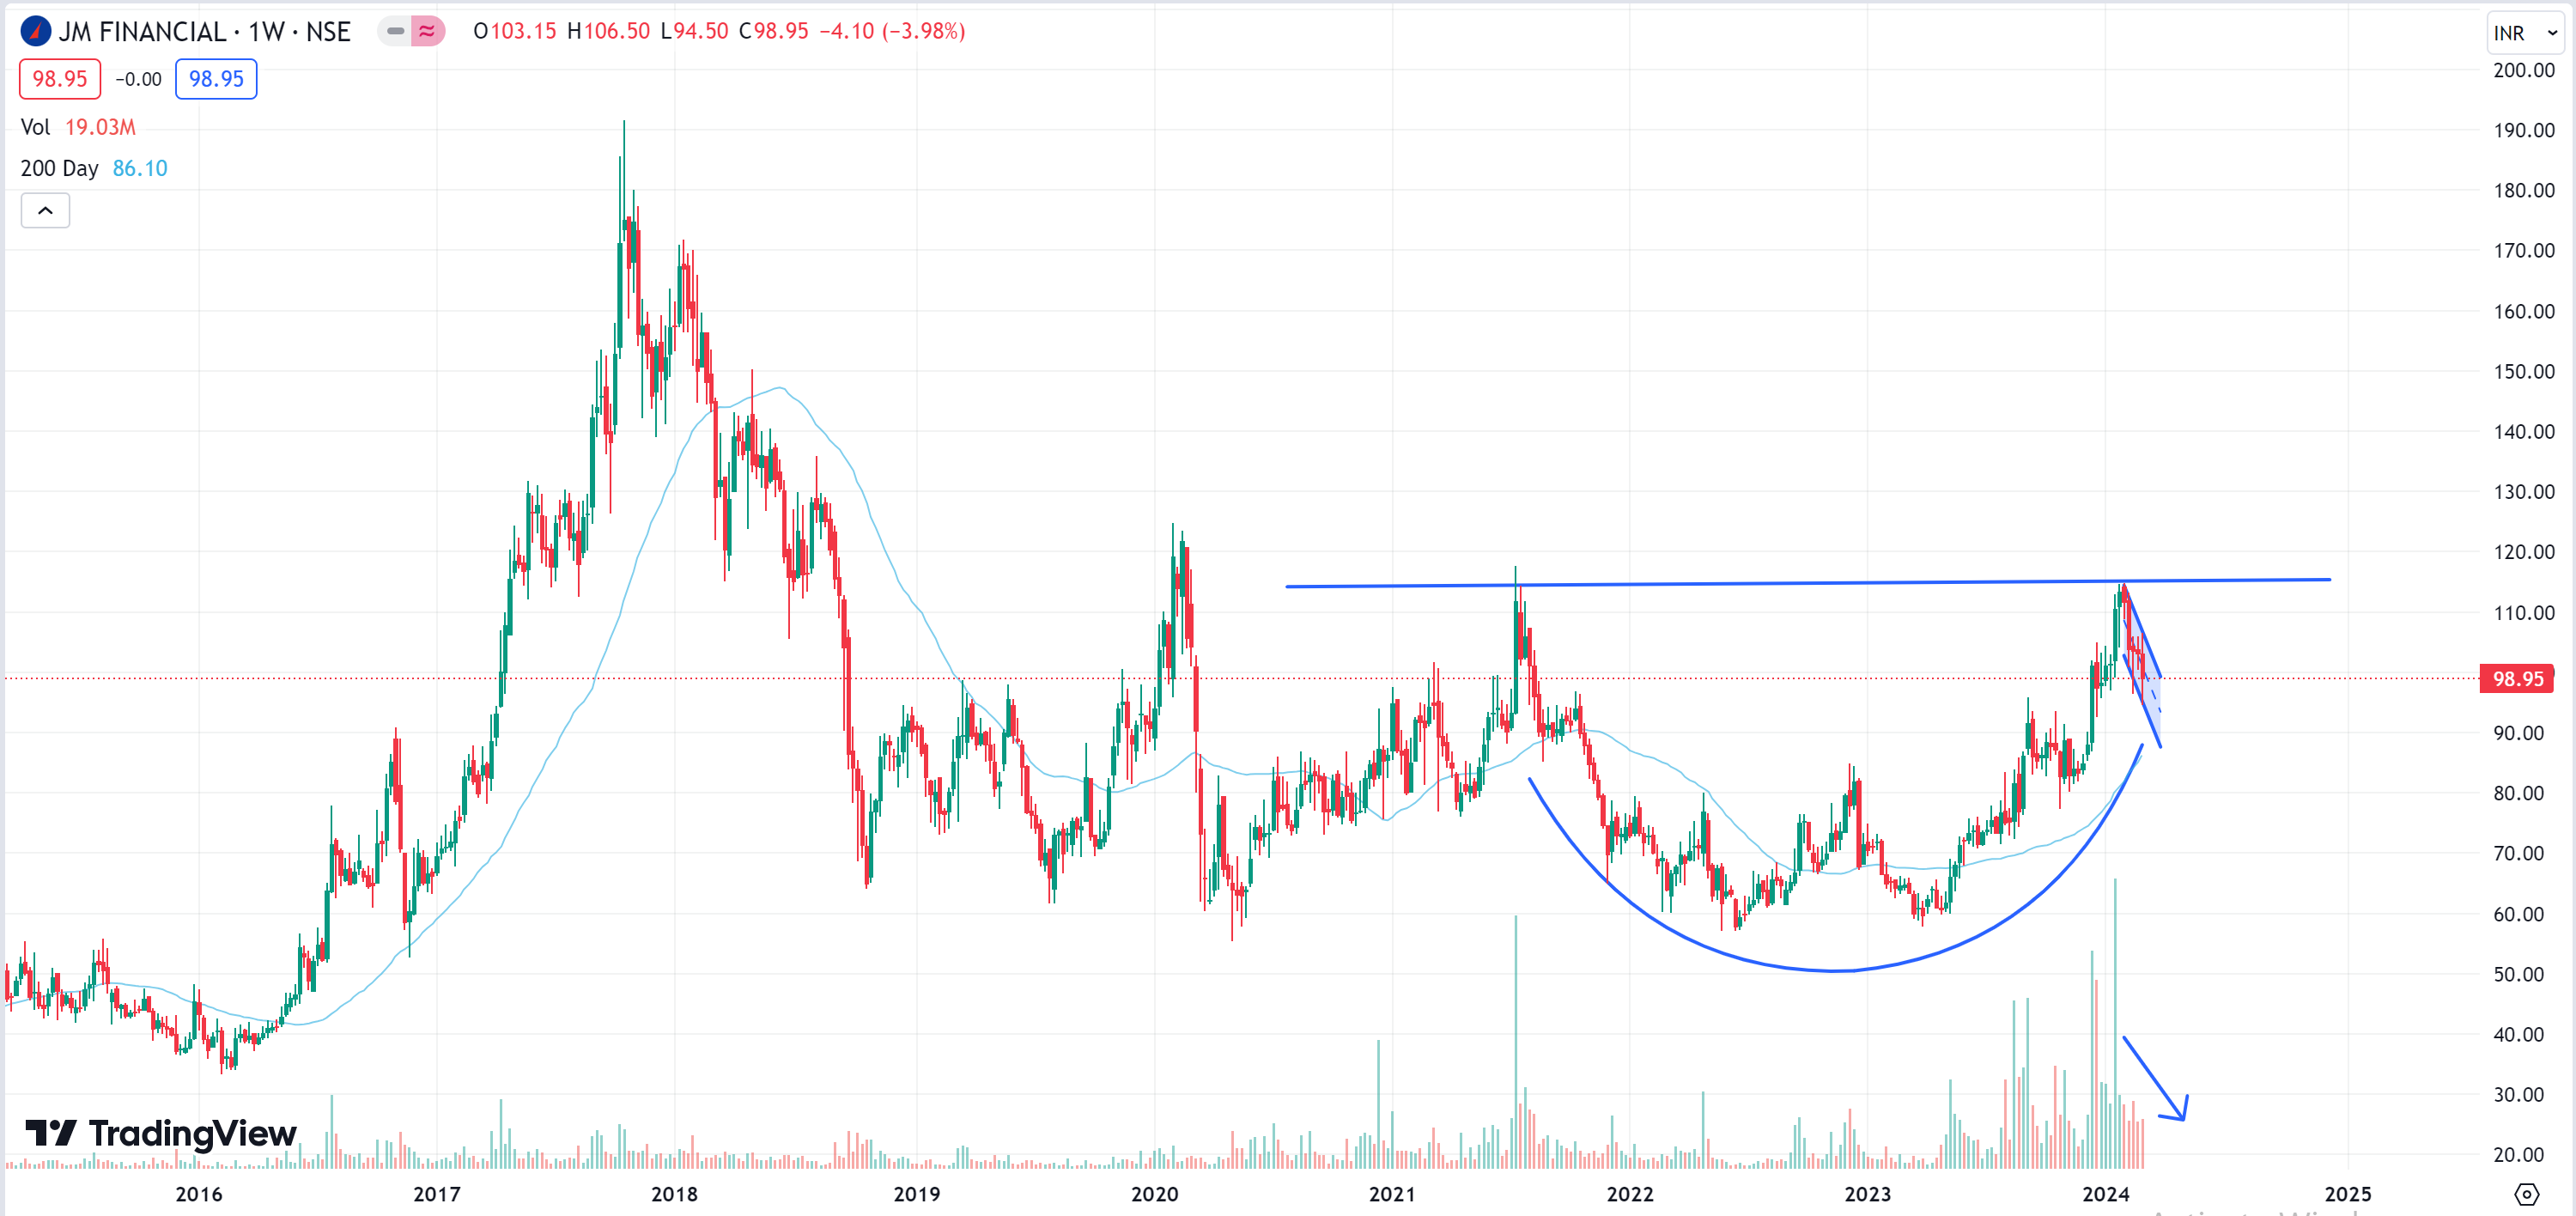
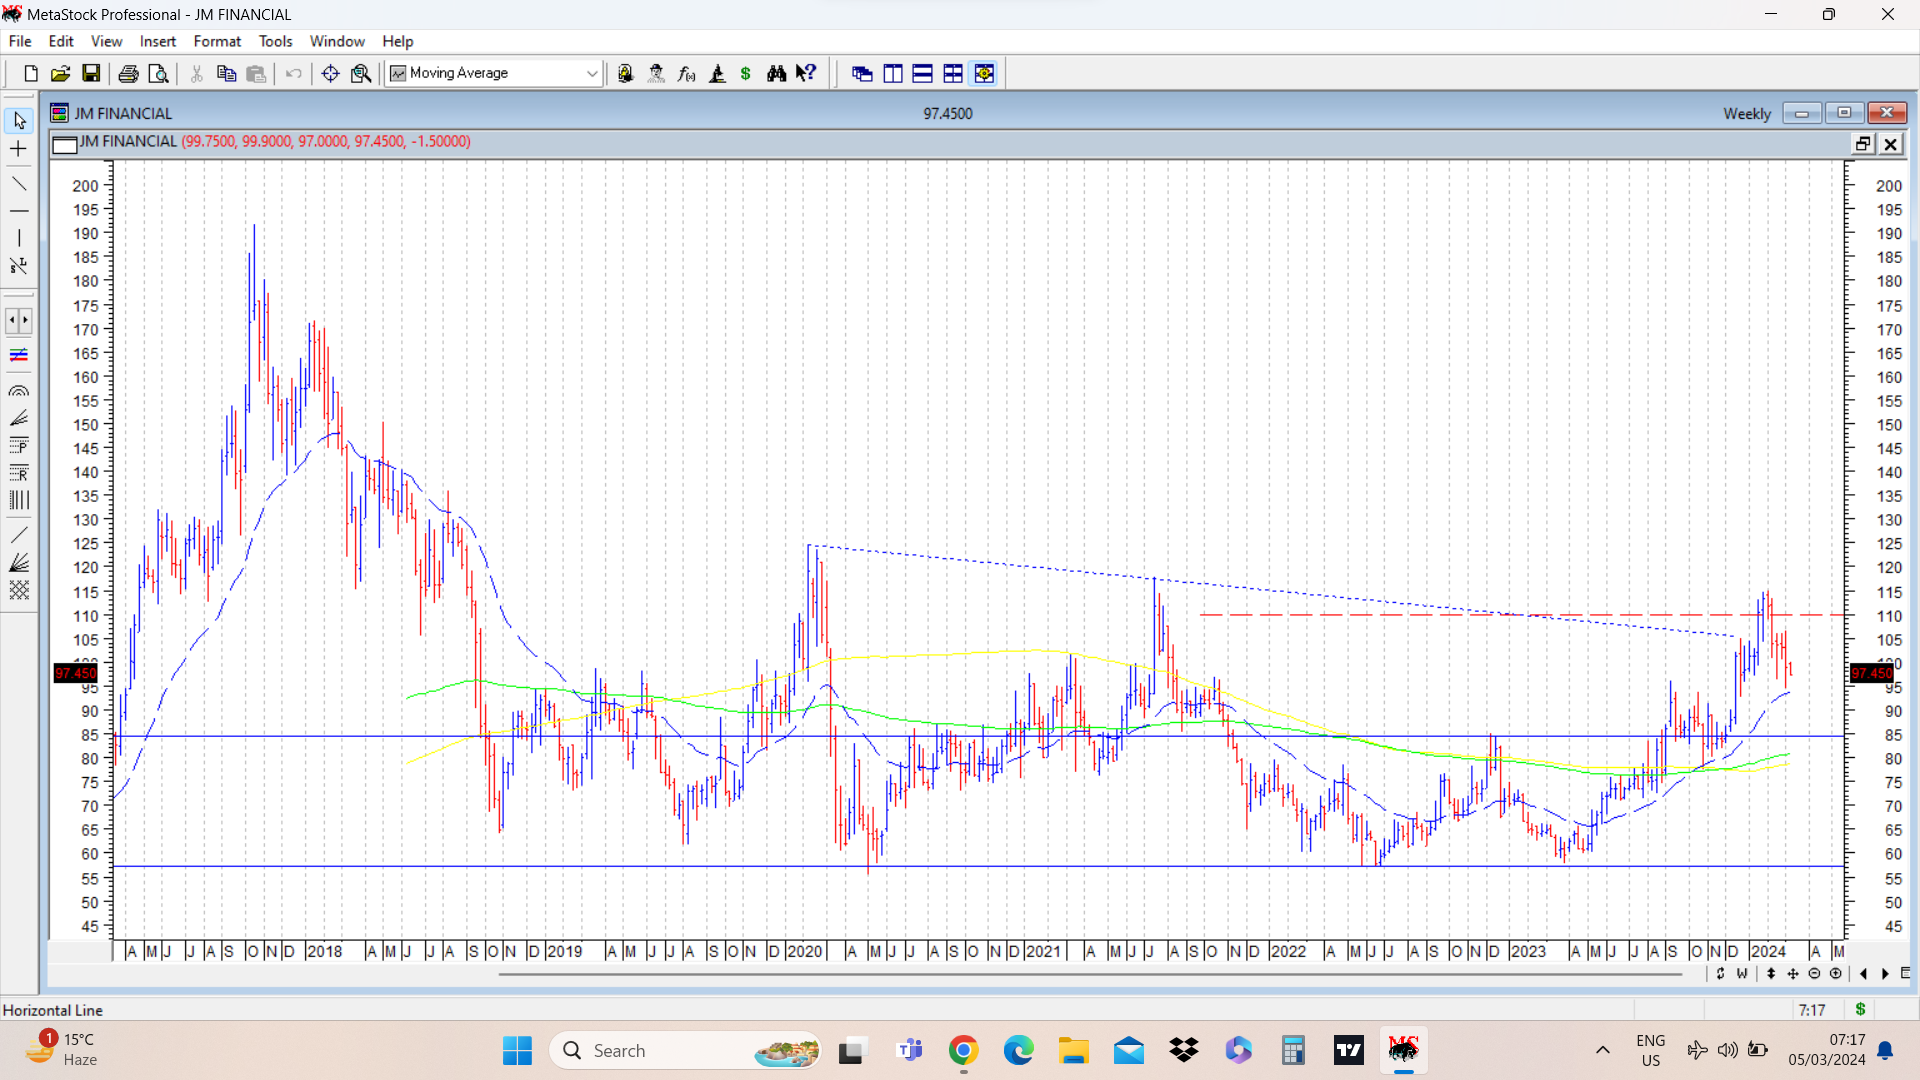
This is JM financial weekly chart and I think it is forming cup and handle formation. Stock went up to break the 52W high at 115 and is retracing back and making a handle like formation. Volumes are also going down from the high. If and when the pattern is formed and breakout of 52w high happens, the long term target that can come ( = to depth of the cup 58) is 170ish with multiple previous resistances in between.
Am I thinking in the right direction on this one ?
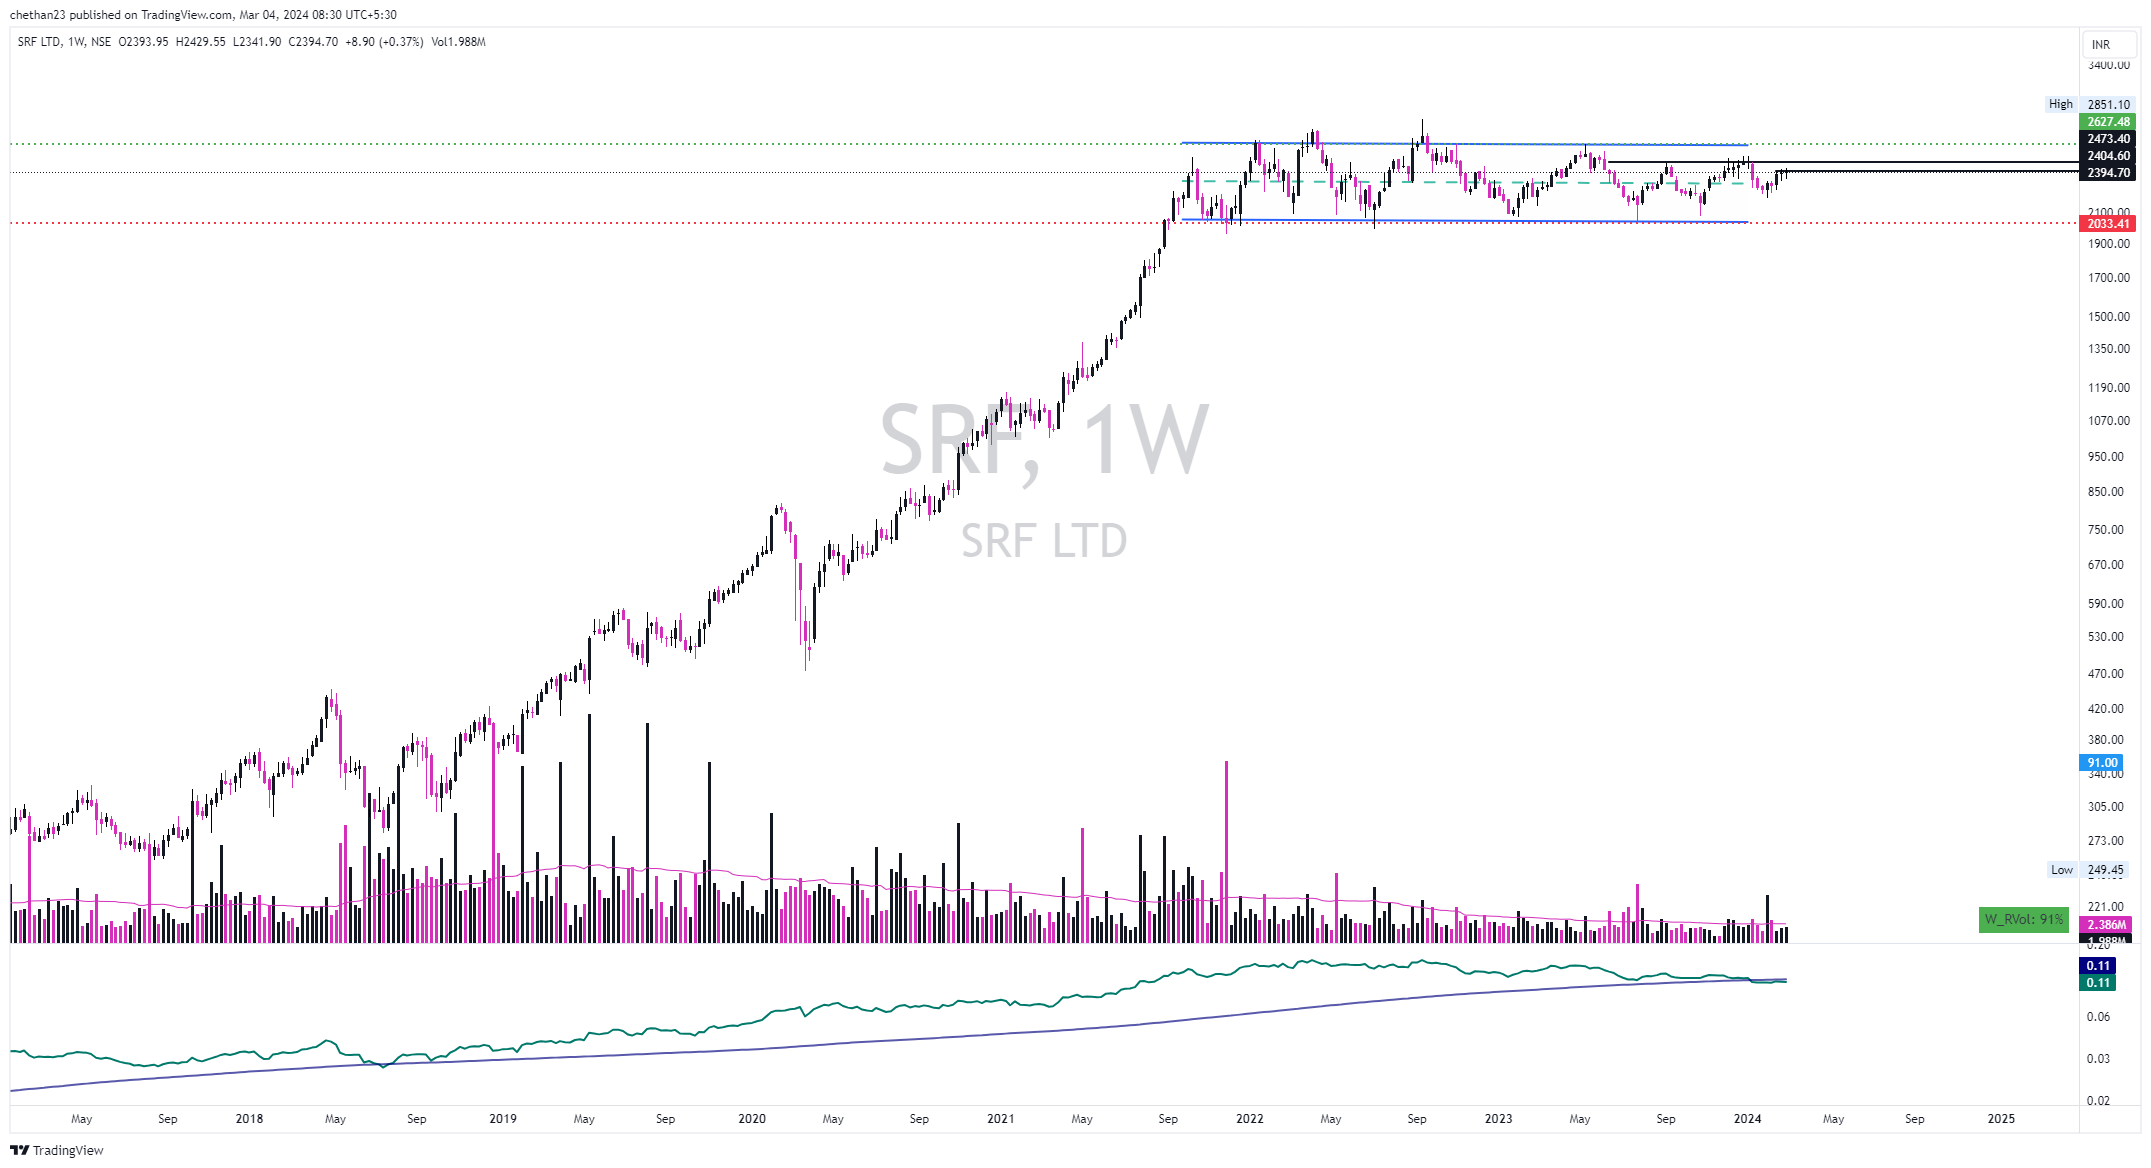
SRF, After strong up move and now it has consolidated for over 2 .5 years seems the move can be expected in this, I was watching other chemical related stocks most of them are getting into right structure, near Stage 4 BO. so there might be some sector tailwinds also.
Whenever a stock approaches a major resistance (52 week high or multi year high or all time highs)
In some cases it can breach through the resistance straightaway, and keeps going up. But usually after going some distance, it tends to take a pause, consolidate, or retrace back to breakout levels and undergo a retest. Or
In most cases it tends to consolidate within a tight range above or around the resistance level. And after enough consolidation has happened, it breaks out to higher ground. Or
The breakout fails and the stock price falls back from there and goes down a lot.
All these possibilities have to be borne in mind. That is where the fundamental analysis comes into picture. And the overall market sentiments also matter.
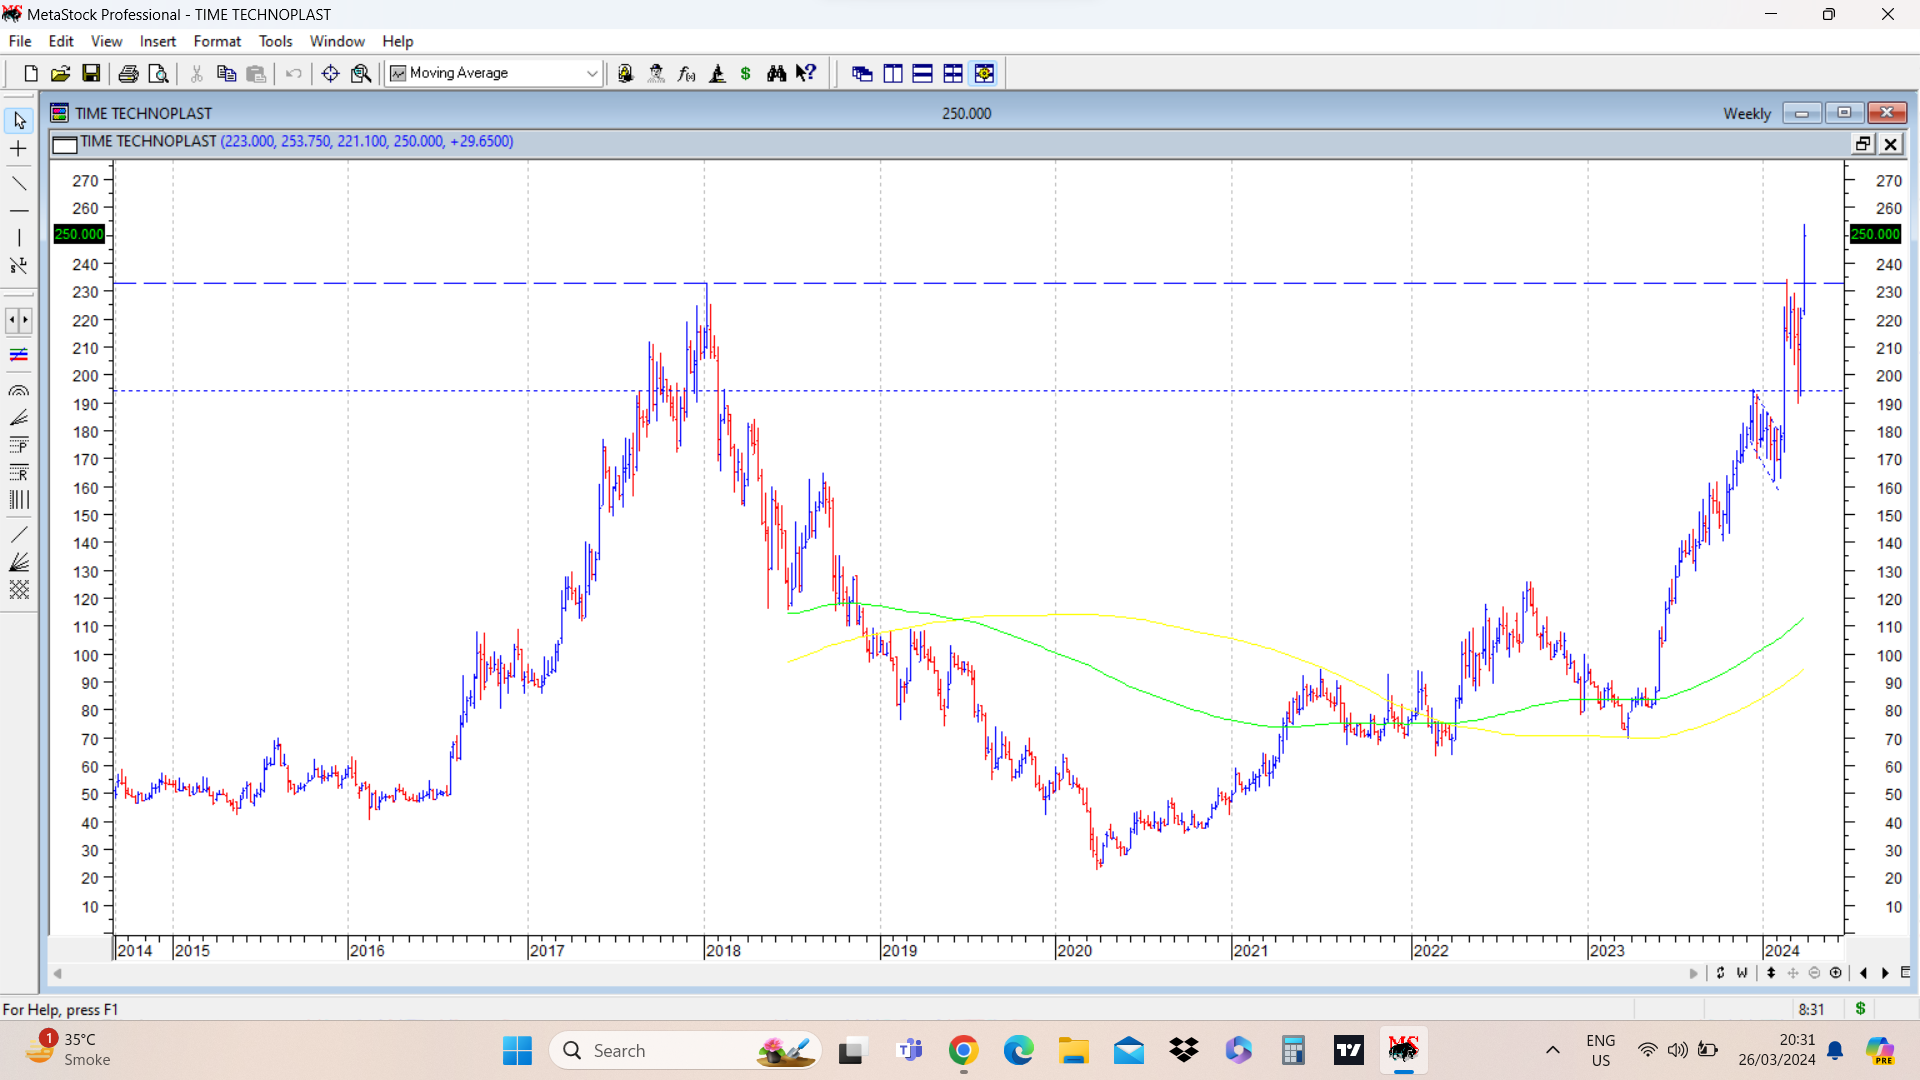
In case of Time techno, it crossed its previous ATH by a small margin and has been consolidating marginally below the previous ATH in a sort of triangular consolidation. This can happen in a lot of similar situations near previous major resistances. You can keep on observing charts where stocks have approached major resistances and see how they have behaved.
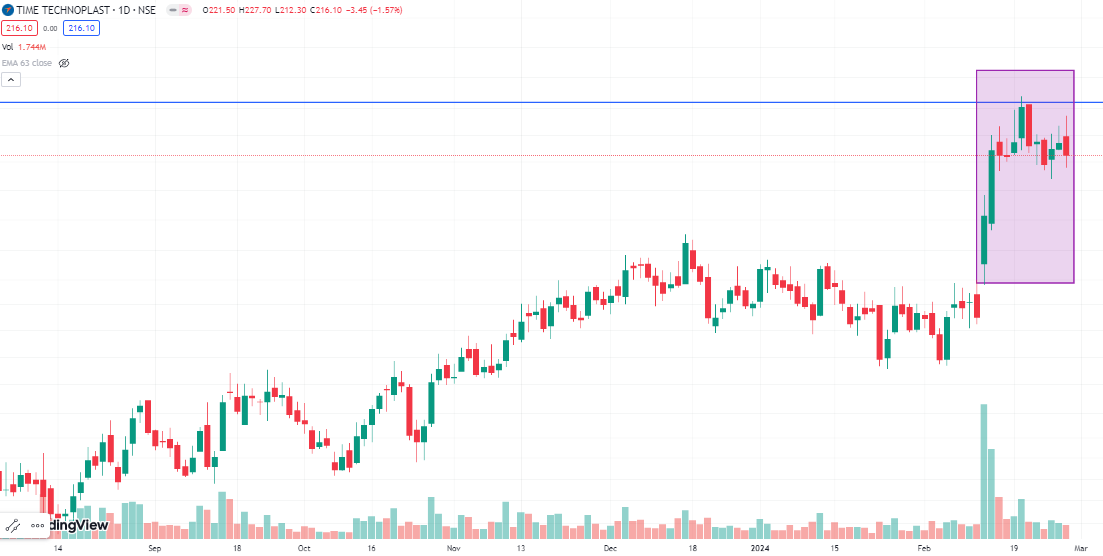
Attached daily chart of Time techno shows a consolidation in form of flag/triangle just below previous ATH. Also note a previous consolidation marked in the chart in form of a flag.
JM financial confirmed breakout from double bottom formation above 84. The bottoms were at 57 and intervening peak was at 84. (marked in solid blue lines) Target for this pattern was 111. (marked in dotted red lines) From close to target range stock price has corrected. I have marked the 30 WEMA in dotted blue lines and its current value is at 94.
Regarding formation of cup and handle, its too early to conclude. In situations like current one ideal thing is to watch for a good weekly candle close and have a re look at the daily chart then. Any signs of reversal from this short term downtrend ( if it is a short term downtrend) should be watched out for.
Overall your observations are spot on. But the possibility of the stock behaving differently from what we expect should also be kept in mind. Overall the stock has been a laggard as compared to other big winners. ( things can change for it too, but as of now it only remains in my watchlist. )
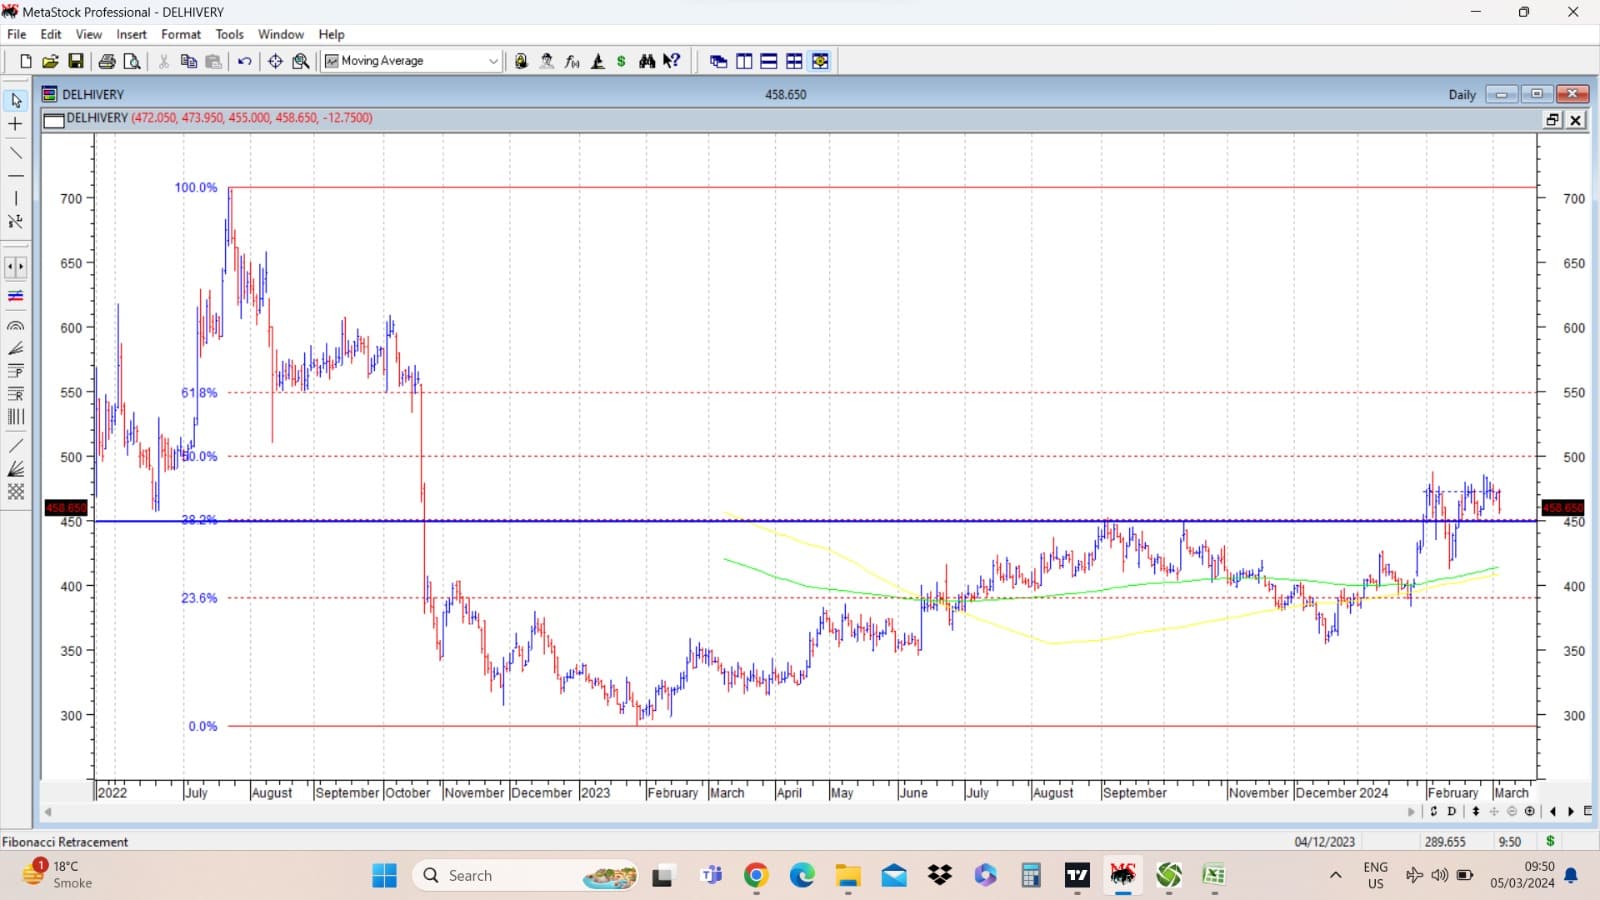
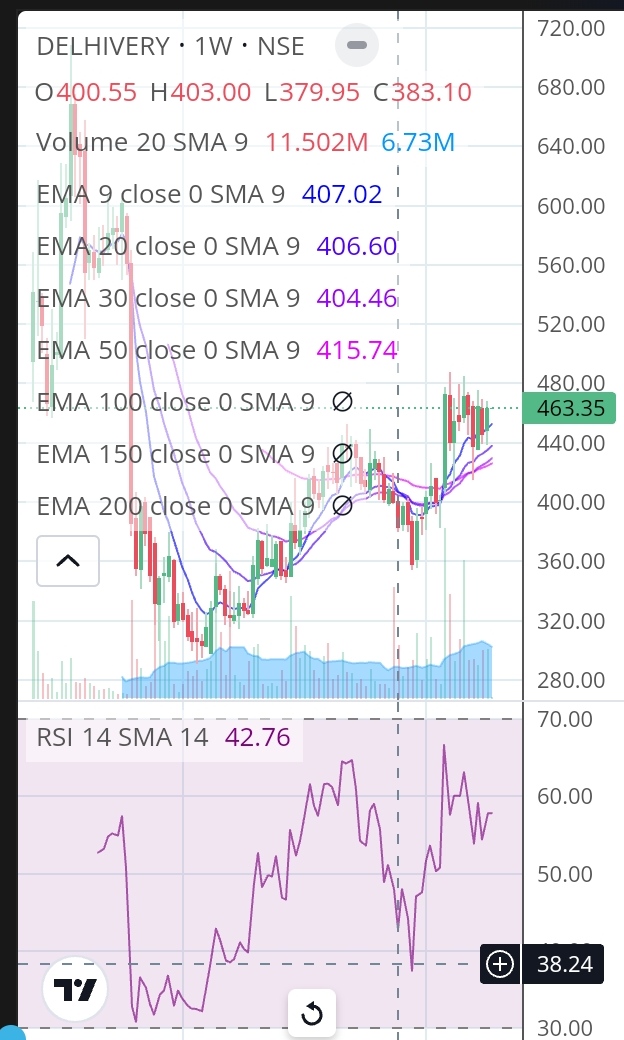
Delhivery cmp 460. Stock price posted a post IPO (IPO price at 487) listing high of 708 and fell down precipitously along with most other fancied newly listed companies in 2022 . It posted a low of 291 in Jan 2023 and started rallying. It crossed its 52 week high of 450 few weeks back and posted a swing high of 488 and has been consolidating at and around its breakout level of 450.
It has broken out above a cup and handle pattern above 450. If this pattern plays out target can be 600.
In the chart attached, I have put in retracement levels of the fall from 708 to 291. 450 also happens to be 38.2% retracement of the fall. On charts therefore 450 region remains very important.
Fundamentally company posted its first quarter of net profit growth in q3 fy 24. Company does presentations, concalls so anyone interested can do detailed research.
disc: invested as a techno funda bet. ( not a recommendation. Please do your own diligence if you consider investing. )
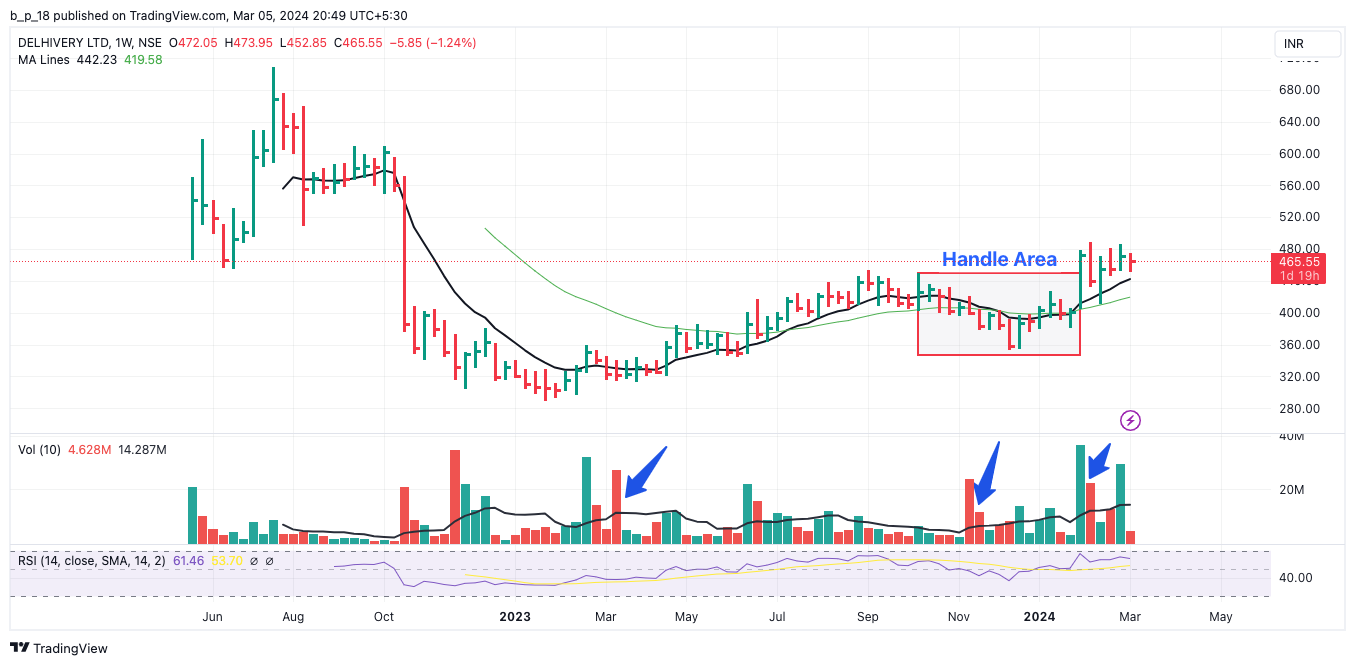
Thank you for the detailed explanation on Delhivery chart. I had a small doubt on the same chart structure which is regarding the volumes for the red candles. As can be seen in the chart below (indicated by the arrows), big red volumes are observed during the formation of cup bottom and also during the handle formation. Do you think this is a weakness signal for the stock or can we interpret this in some other way. I am asking the doubt as per my understanding of the textbooks on technical analysis.
Volumes need to be big at the time of breakout in case of a cup and handle. That is present in case of Delhivery. In fact if you look at weekly candle at breakout, it is a huge (price wise) candle with big volumes which are multiple times the volumes in the past nearly 8-10 weeks. High and low of that candle should be important levels to watch out for going ahead. You have marked arrows on bearish candles with high volumes. Try putting in arrows on bullish candles with high volumes . In fact of late the bullish candles have higher volumes.
High volumes in bearish candles at bottom of cup indicates sell off that ultimately got absorbed since the prices went up after that.
Its all about how you want to look at things and interpret. Cup half empty, or half full. ?
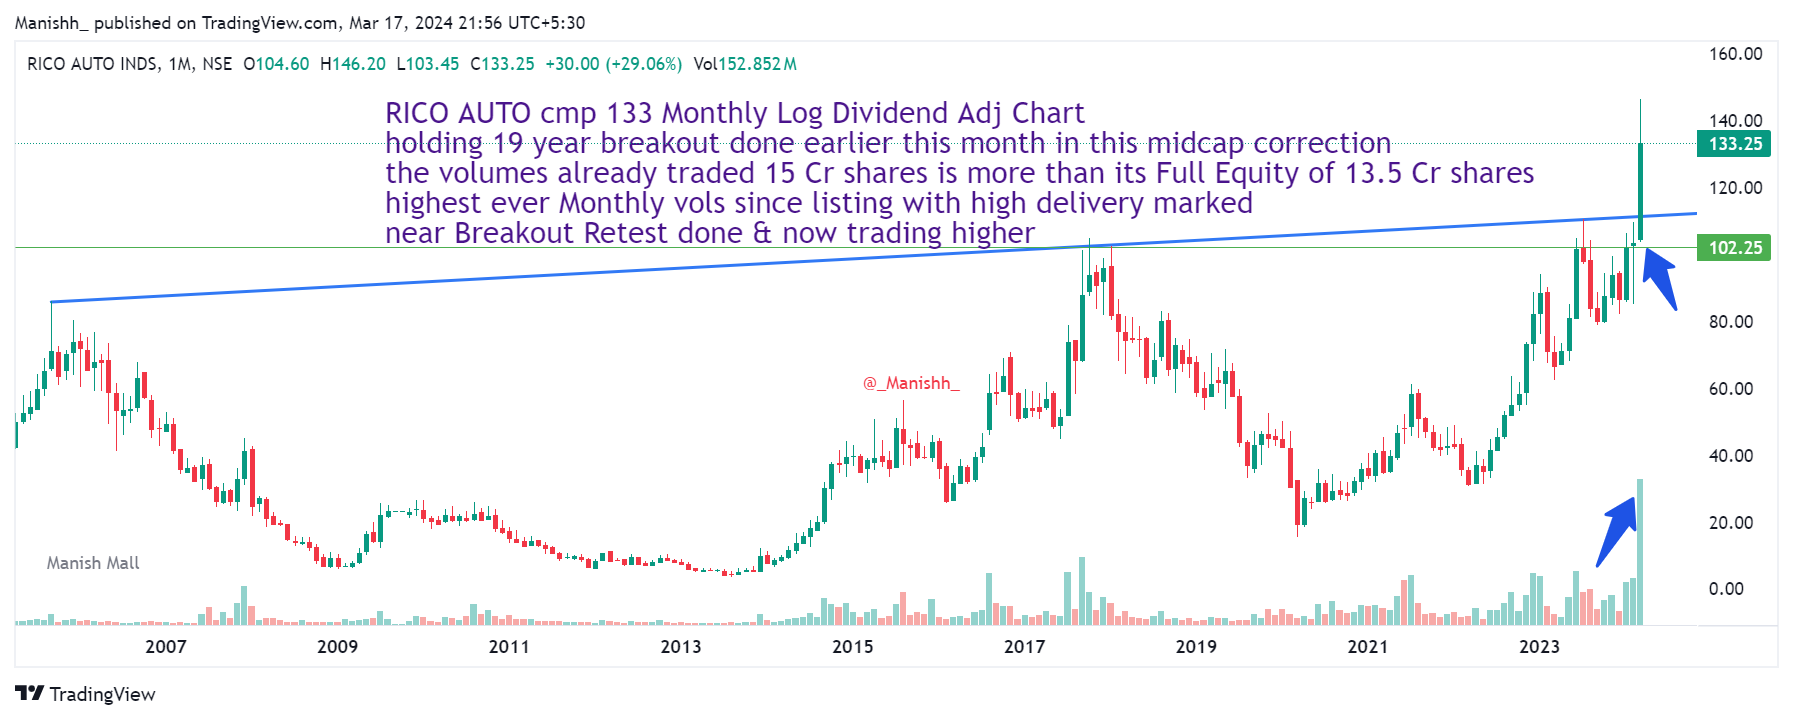
RICO AUTO cmp 133 Monthly Log Dividend Adj Chart
holding 19 year breakout done earlier this month in this midcap correction
the volumes already traded 15 Cr shares is more than its Full Equity of 13.5 Cr shares
highest ever Monthly vols since listing with high delivery marked
near Breakout Retest done & now trading higher
Earlier since many years 98 to 103 used to be multiple Resistance zone
any dips near 110 to 104 opportunity to Add and
any close below 98 would be a stop loss for Targets of 200 + , views welcome
Time Techno update. cmp 249. Finally today the stock price managed to convincingly cross its previous all time high of 233 posted in 2018. ( disc: invested, added more during recent correction because of following observations)
Some observations during recent correction:
It corrected less than 20% from its most recent swing high. Swing high was 234, and during recent correction low posted was 189.
Stock price did not breach its 10 WEMA conclusively. Its 10 WEMA was at 199, and during two weeks of severe correction, stock price briefly went below this level but managed to close above 199 in both weeks. (Even if it closes below this level for a week or two, without going too much below it significantly, its okay)
It corrected to 50% of retracement of the last leg of the rally and held that level.
It was very quick to bounce back from support levels.
Stocks that rally above previous swing highs, or all time highs post a strong correction are the ones to watch closely to find out the next batch of big winners.
Usha martin daily GMMA chart presents a very simple analysis. Stock price has been in a range of 284-361 since July 2023 till date, which is nearly 8 months of range bound consolidation. ( this method uses short term and long term moving avgs and hence actual price on bar chart may vary from above mentioned range by a few rupees here and there, but we get an overall sense of the range, and can utilise it to our advantage. ) disc: invested, as disclosed before.
Hitesh Bhai, Per my understanding, 200D.EMA had flattened & a double top pattern was evident on the daily chart after a long uptrend. Price broke below 200D.EMA in the last week. I felt that the current week’s closing price will confirm/disconfirm the double top pattern.
Usha Martin 200 dema currently is at 299. Stock price recently went below that level and traded and closed below that level for a few days and now has bounced back above that. Double top was at around 375 and intervening bottom is at 253. That level of 253 seemed like a panic bottom and effectively stock price has been taking support at around 270-275.
Here we have a fair idea about fundamentals of the company and the reason why the stock price is under constant pressure. Fundamental performance remains good and with capex benefits coming on stream in a quarter or two, I would like to keep observing how the company performs. Many a times abatement of selling pressure itself can cause a rally in stock prices. If Prashant Jhawar group were to stop selling for some time, we can see some uptick in stock price. The heartening thing to see for me was that most of the supply was getting absorbed above the support zone of 270-275.
Usha is one stock where I have had fundamental conviction right from the entry point and that has helped in me managing to hold on to the stock (and adding at appropriate times ) during long periods of consolidation.
Above is my thesis of investing and holding in Usha and not an investment advice.
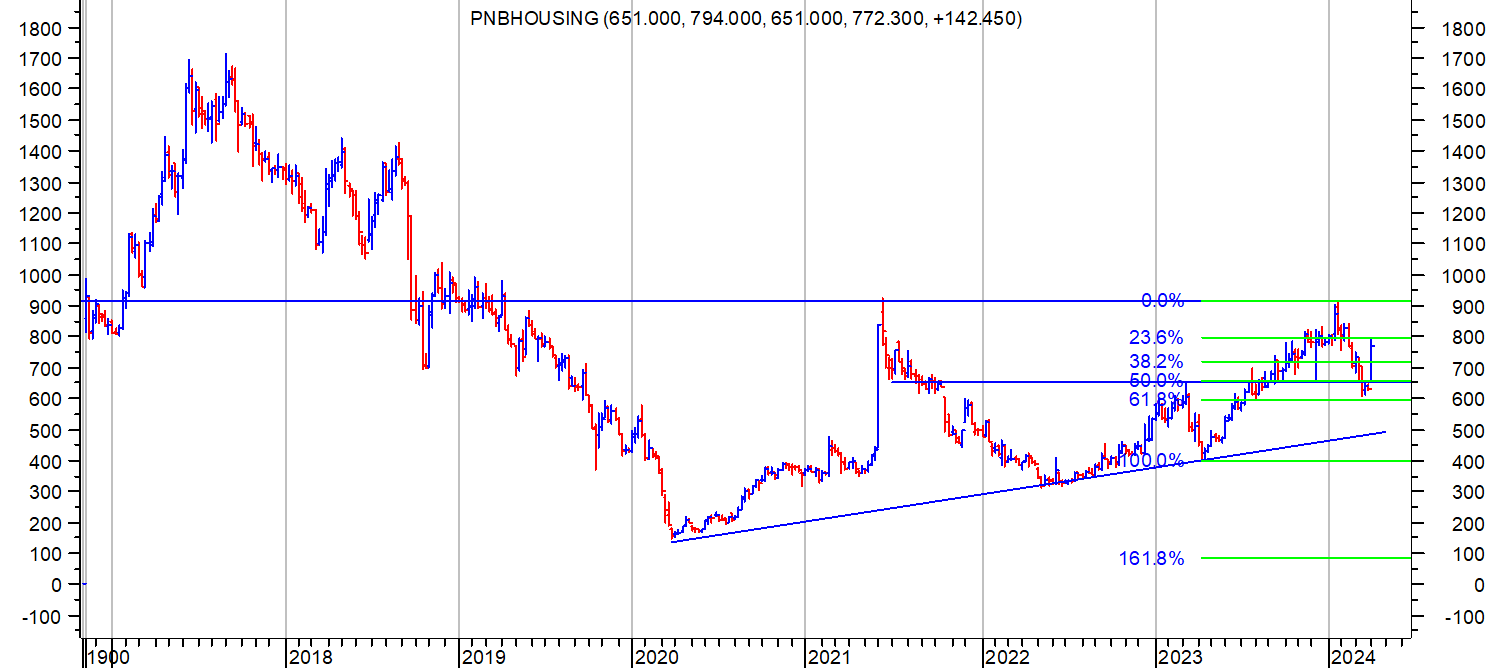
PNB HF. Cmp 770. Stock price corrected from resistance at 720 and in line with overall market went down to retest key support zones. It went below 30 WEMA briefly and retraced 61.8 % of its previous upmove (marked on charts) and then last week gave a big bullish close. An ascending triangle is marked on the weekly charts.
Overall structure is that resembling a rounding structure with top near 1700 levels. Fundamentally company has now regained its growth focus under new CEO Girish Khousgi and asset quality has shown sequential improvement. For those who want to do detailed research, company provides presentations and does regular concalls.
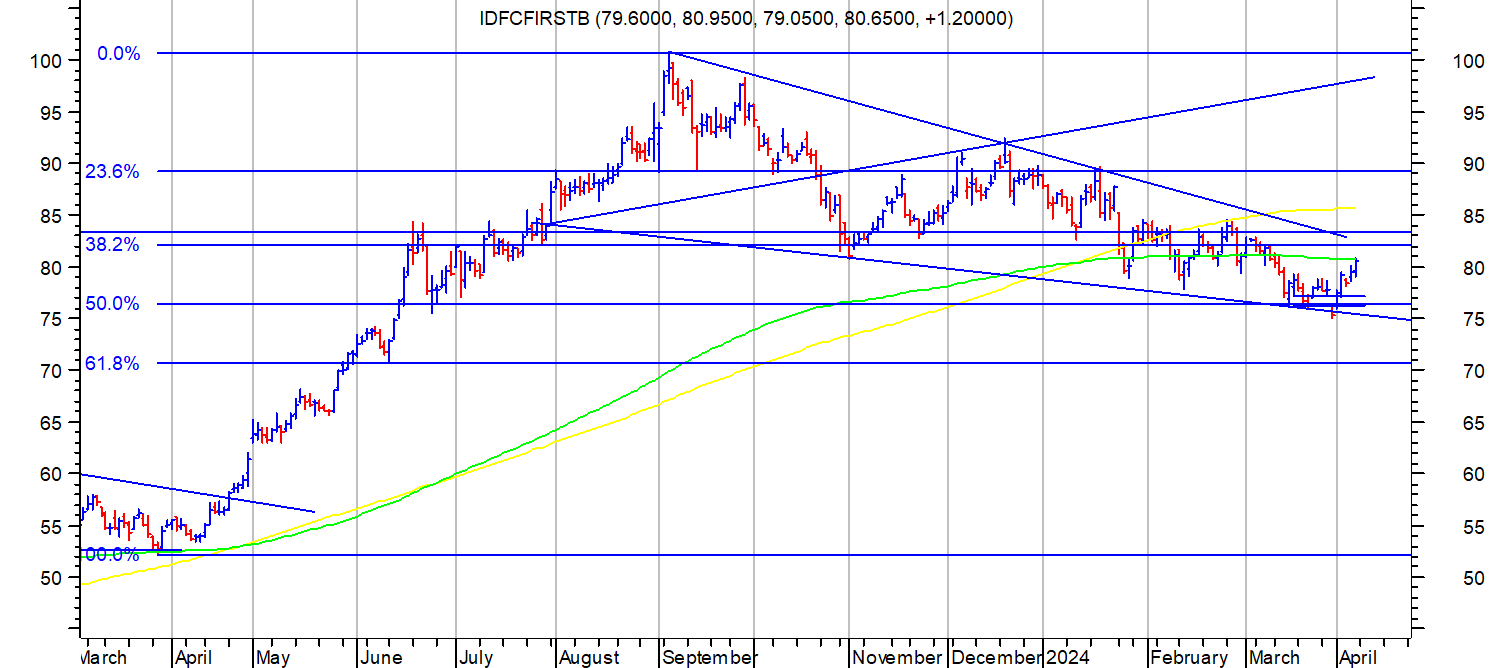
Stock price rallied from levels of 53 in March 2023 to 100 in September 2023 and since then went into a triangular consolidation which has lasted for more than 6 months now. Important thing to observe that all during this correction, stock price has not gone below 50% retracement level of its previous rally, which shows some strength and resilience in a routine correction.
An interesting observation is a gap which was posted on 28-03-2024 when a big institution offloaded a big chunk of its holding in IDFC first bank. When there is a gap at the fag end of a correction, and is immediately filled in next day or few days, ( here it got filled very next day) it is an example of an exhaustion gap. This often signifies exhaustion on the part of sellers and can be a fertile ground for a change in trend.
The triangular consolidation drawn on the daily chart would end once the stock price closes above the breakout level from triangle which happens to be 83-84 currently. The prior upmove from 53 to 100 resembles a flag pole like structure and the triangular consolidation resembles a flag/pennant. Target for breakout based on this kind of structure comes to around 115-120.
For anyone wanting to do fundamental research, IDFC First is a well researched stock and company does regular presentations and concalls.
BBL Has been hitting new highs after cup and handle formation in Dec 23. There was a pause during recent fall in Mid March But it recovered and continued the uptrend.
SriRam Pistons also in continuous uptrend and hitting new highs. After Abacus Buying recently Emkay also came up with Target close to INR 2500. It is supported by Good Volumes as well.
One month passed after this chart and during the recent correction, the stock went below 450 for few days and hit 435 regions on weekly chart and it remained below 5% range of 450 which was crucial. Now still the stock appears to be range bound, but bounced back to 460 levels
How do you see this stock movement last one month ? Did you exit it once it went below 450 range ?
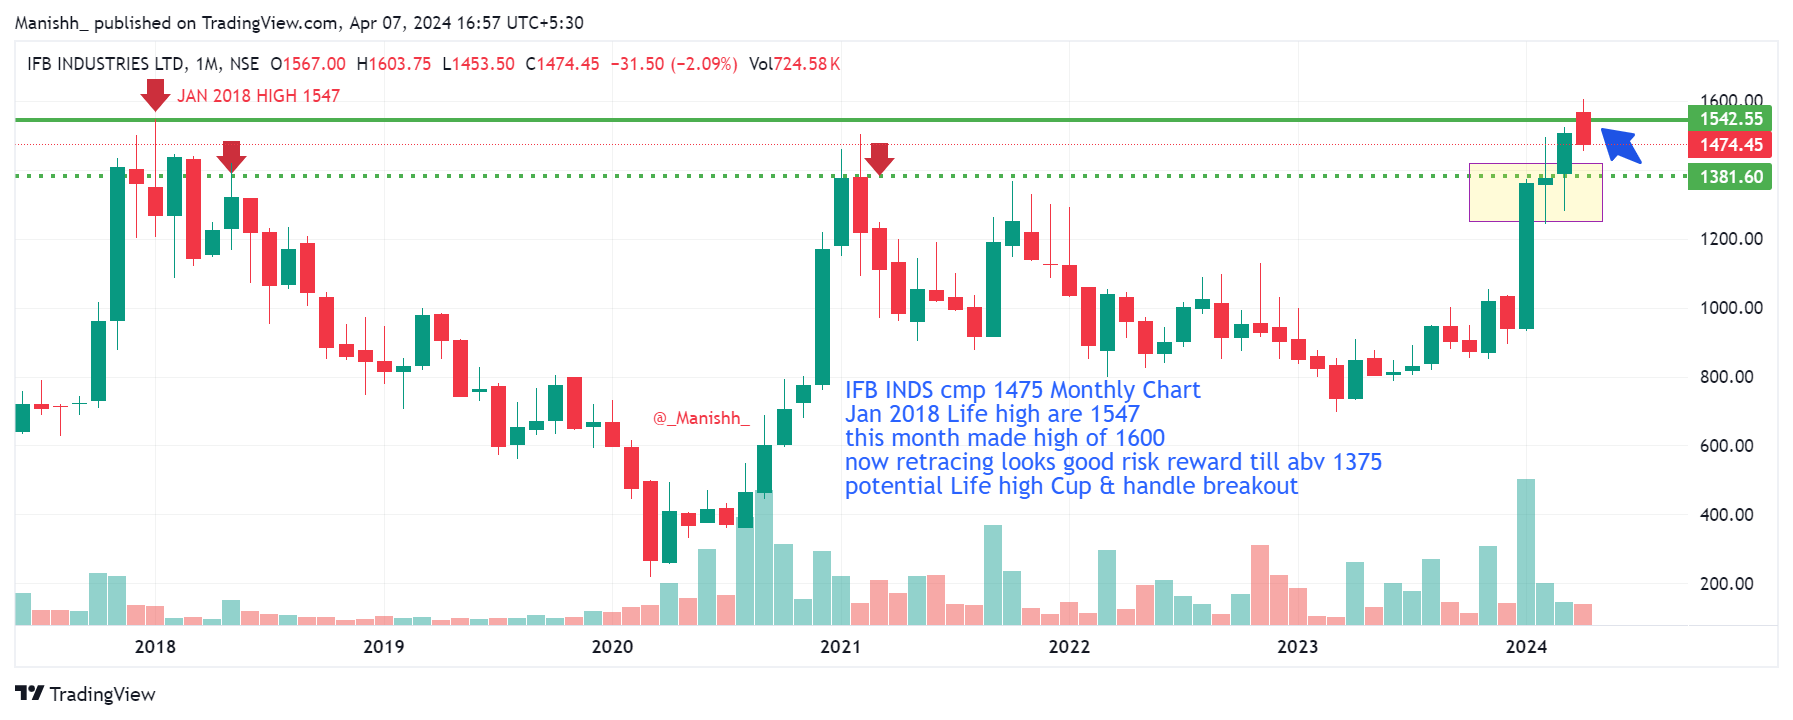
IFB INDS cmp 1475 Monthly Chart
Jan 2018 Life high are 1547
this month made high of 1600
now retracing looks good risk reward till abv 1375
potential Life high Cup & handle breakout