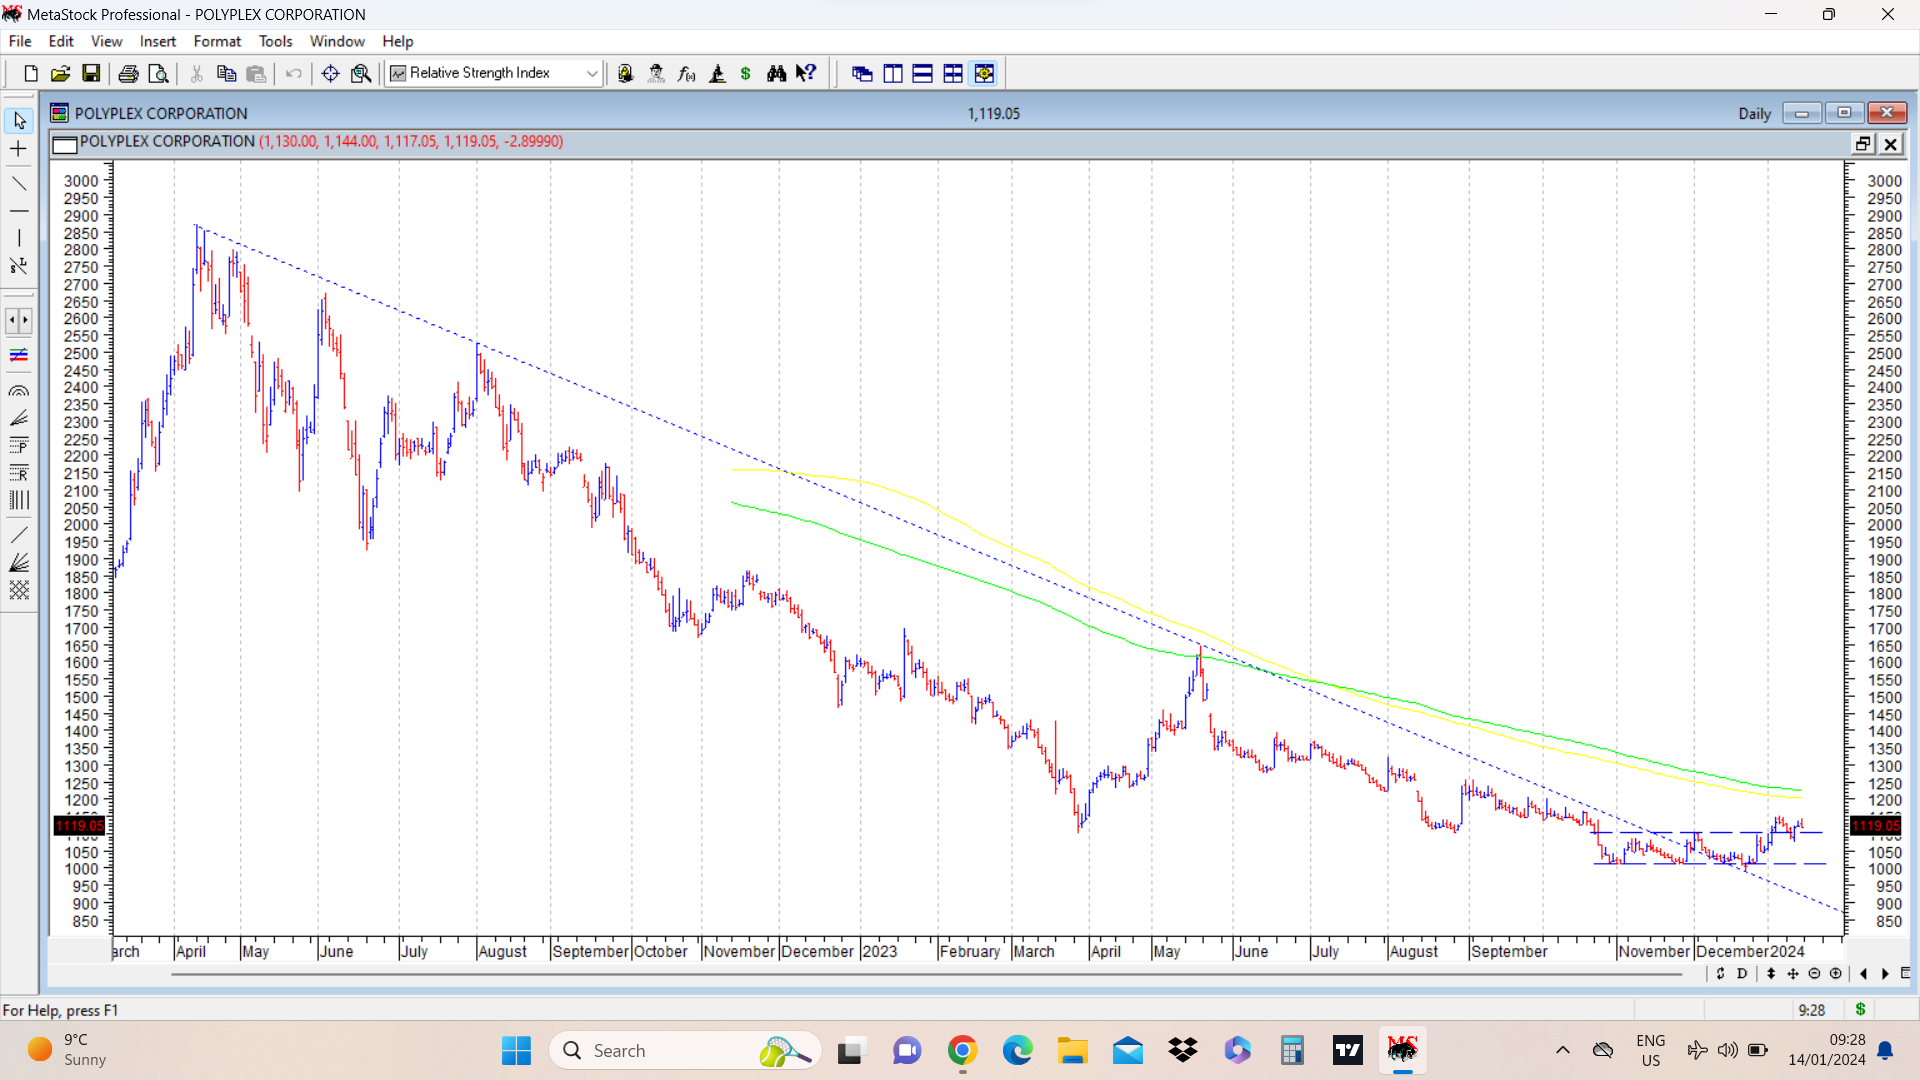
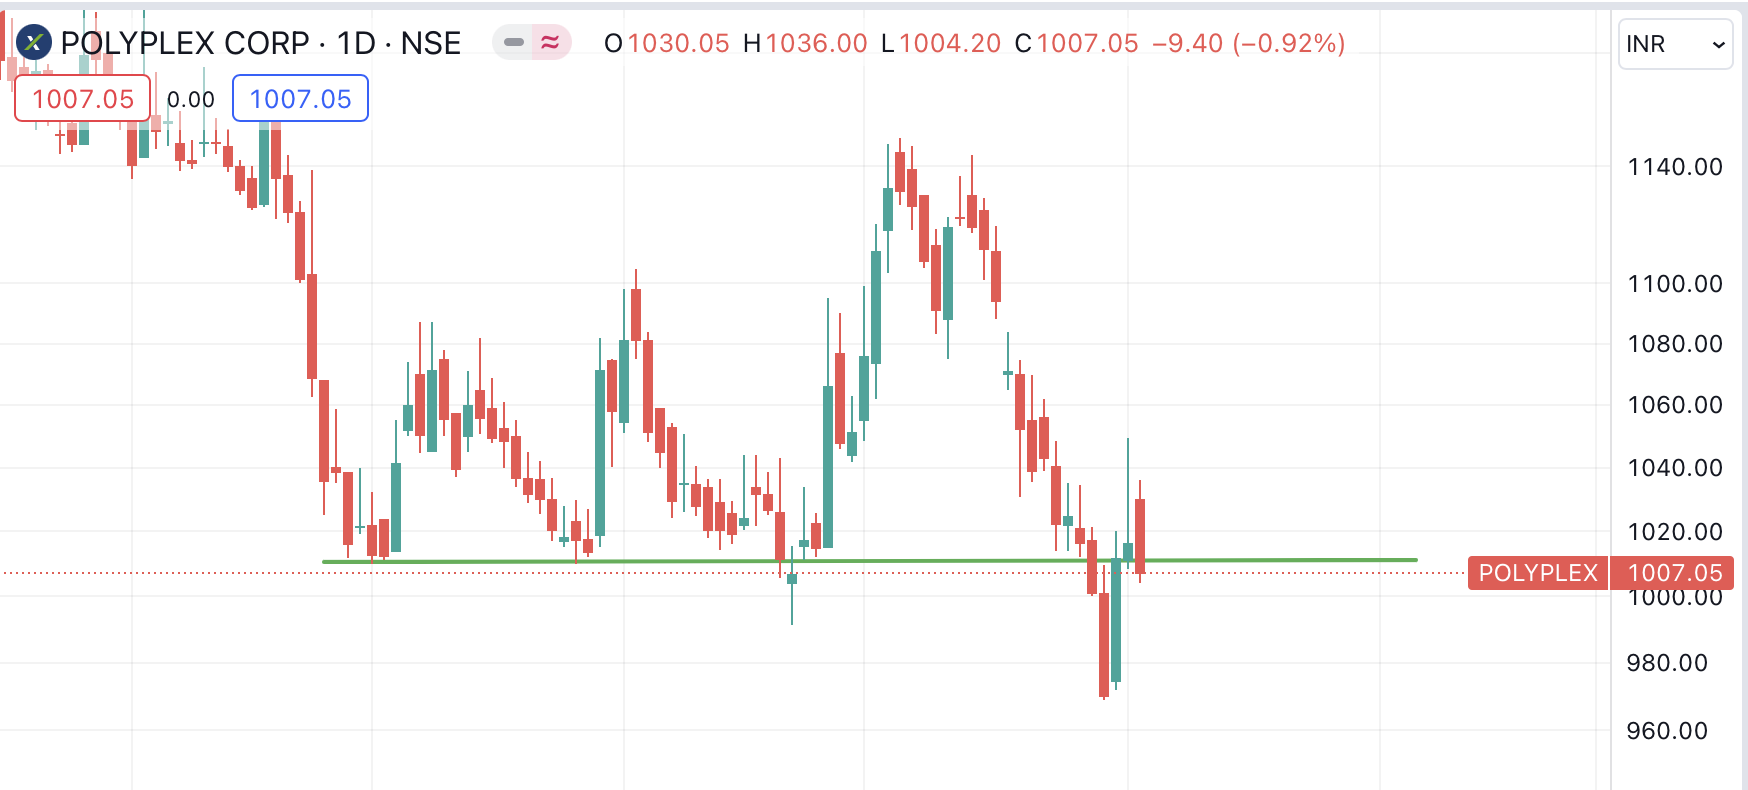
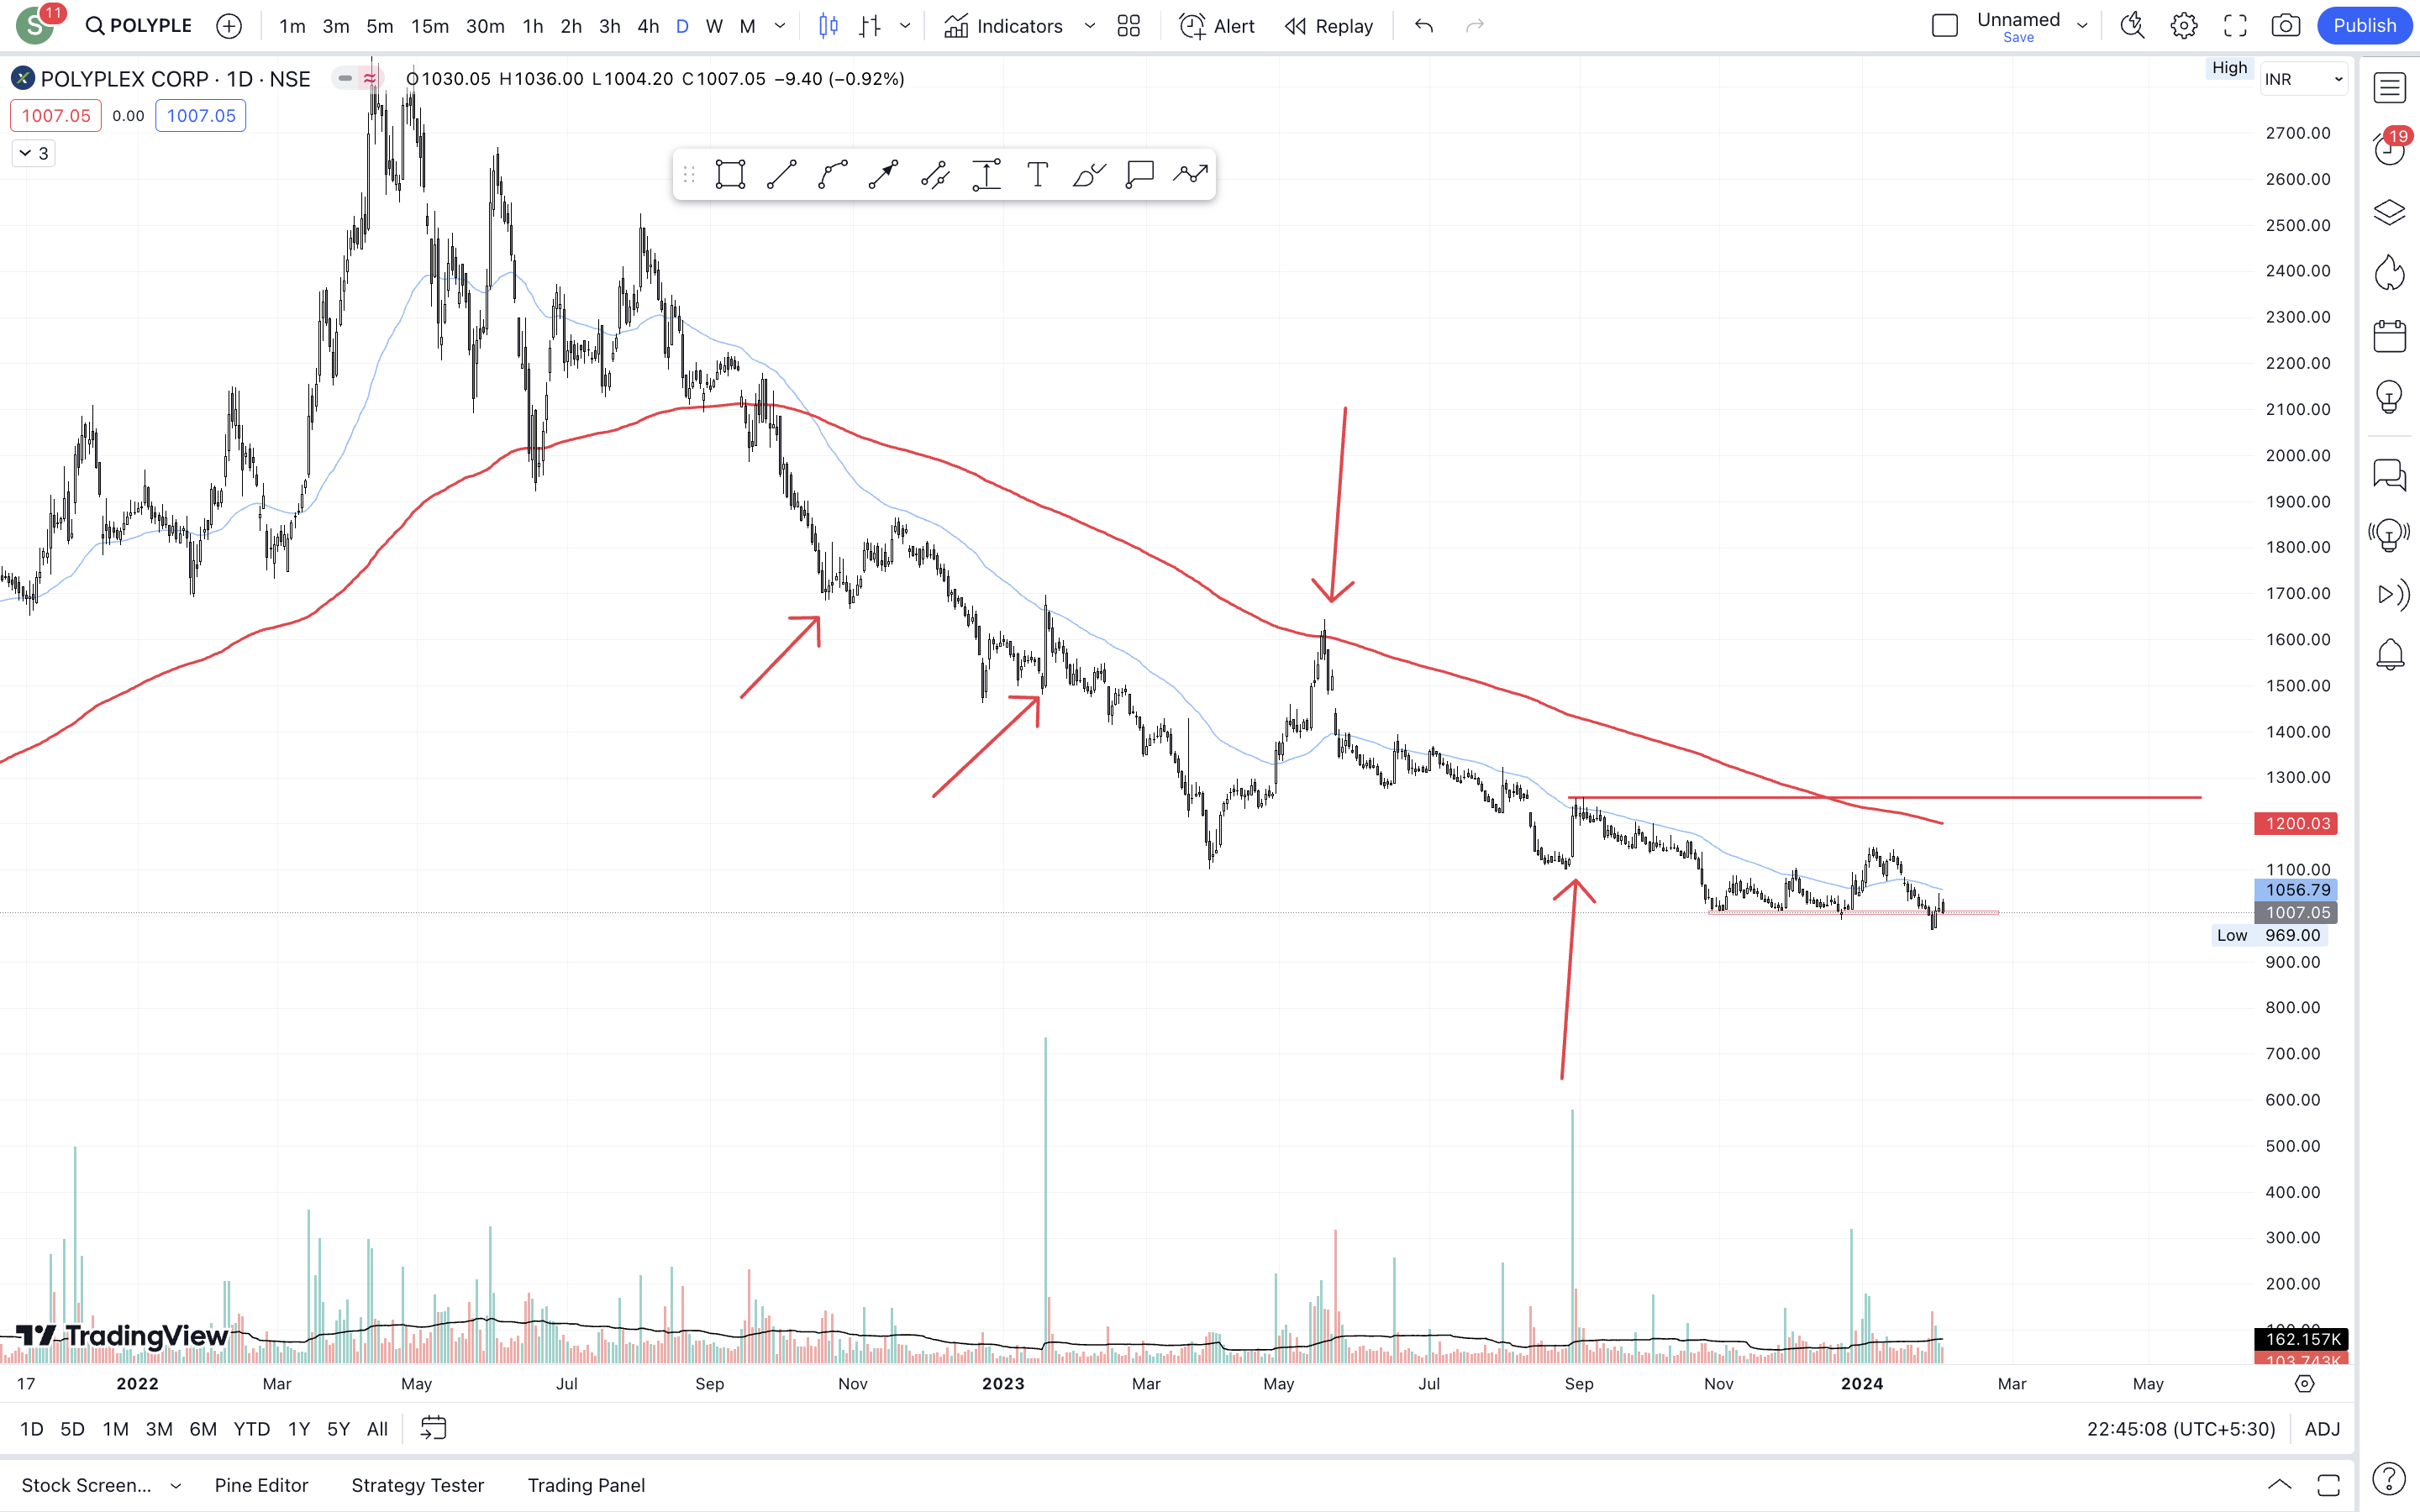
Polyplex cmp 1119 had a prolonged fall from a high of 2870 in April 2022 to a low of 991 in Dec 2023. Nearly 20 months of one way fall. Now first signs of a probable bottom formation.
Firstly price broke out above a falling medium term trendline.
Secondly we have a Wycoff type of “spring” formation and price broke out above tight small range between 1000-1100 which lasted more than 2 months.
@hitesh2710 - Hi Hitesh, Happy 2024 !! I came across a couple of businesses which I thought made for an interesting Techno-Funda set up. Presenting my thoughts here on the same, more from a fundamental and business prospect standpoint. Requesting your technical expertise to understand if there is actually a potential techno-funda set up here. As always, thank you for your insights.
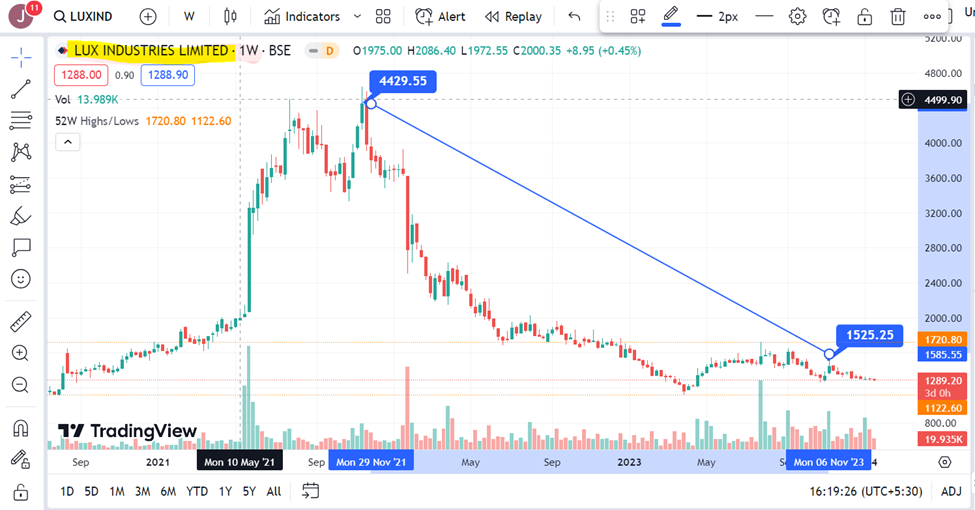
LUX INDUSTRIES
Cotton (the main raw material) prices have been stable and also falling slowly
Given clean chit by SEBI on the insider case (CG issues were the main drag on the stock)
Rural consumption upcycle will also act as a tailwind
They have long term contracts with buyers in place
Most negatives seem priced in (Price levels still at or less than pre covid)
Your insights on this chart from a technical perspective please? To my layman’s eyes, this chart seemed similar to the one you posted about Polyplex. Just curious if they are at similar stage of a breakout?
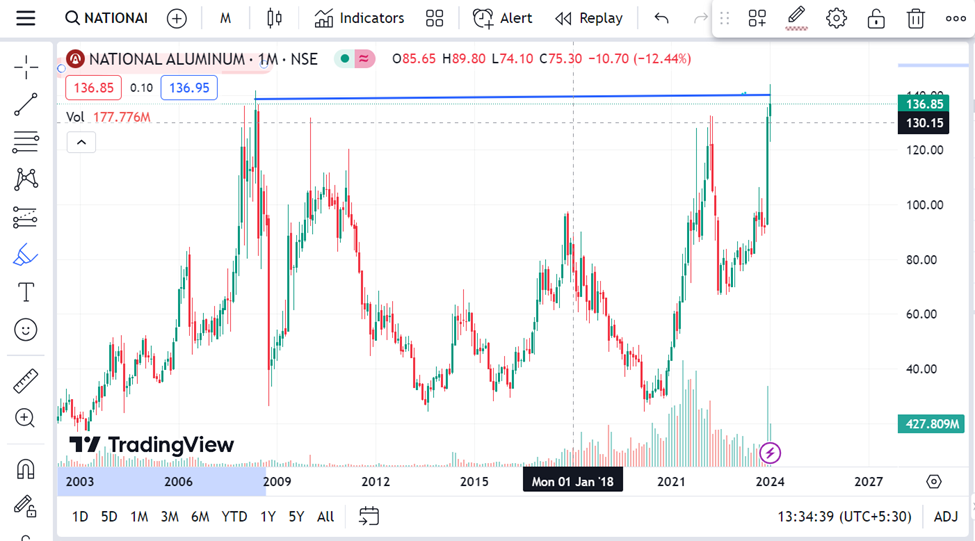
NATIONAL ALUMINUM (NALCO)
• Central government recently approved royalty rates for critical earth metals, including Lithium. NALCO is amongst the top Lithium mining companies and stands to gain.
• Metals sector is an upward trend (iron ore, base metal prices going up). Metal index has also been showing good traction. However, I am not sure when this cyclicality might end.
• Price action wise, it’s at a 15-year breakout. Your views on this set up please?
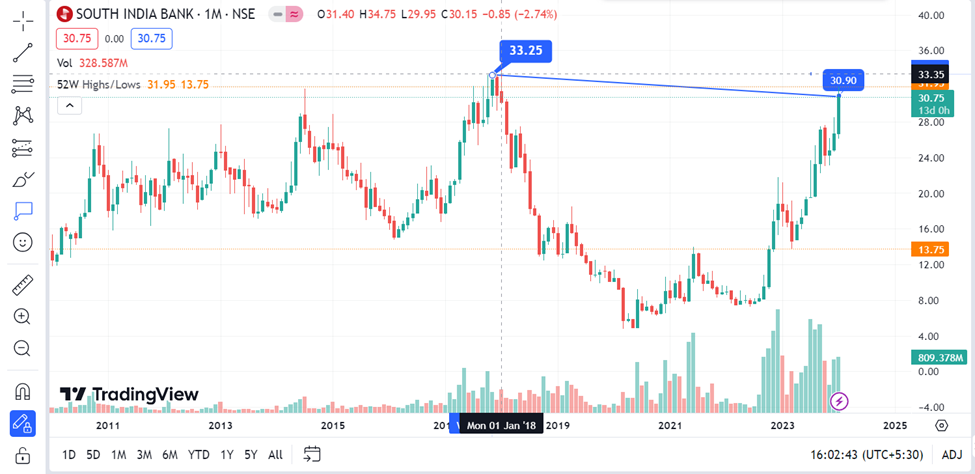
SOUTH INDIA BANK
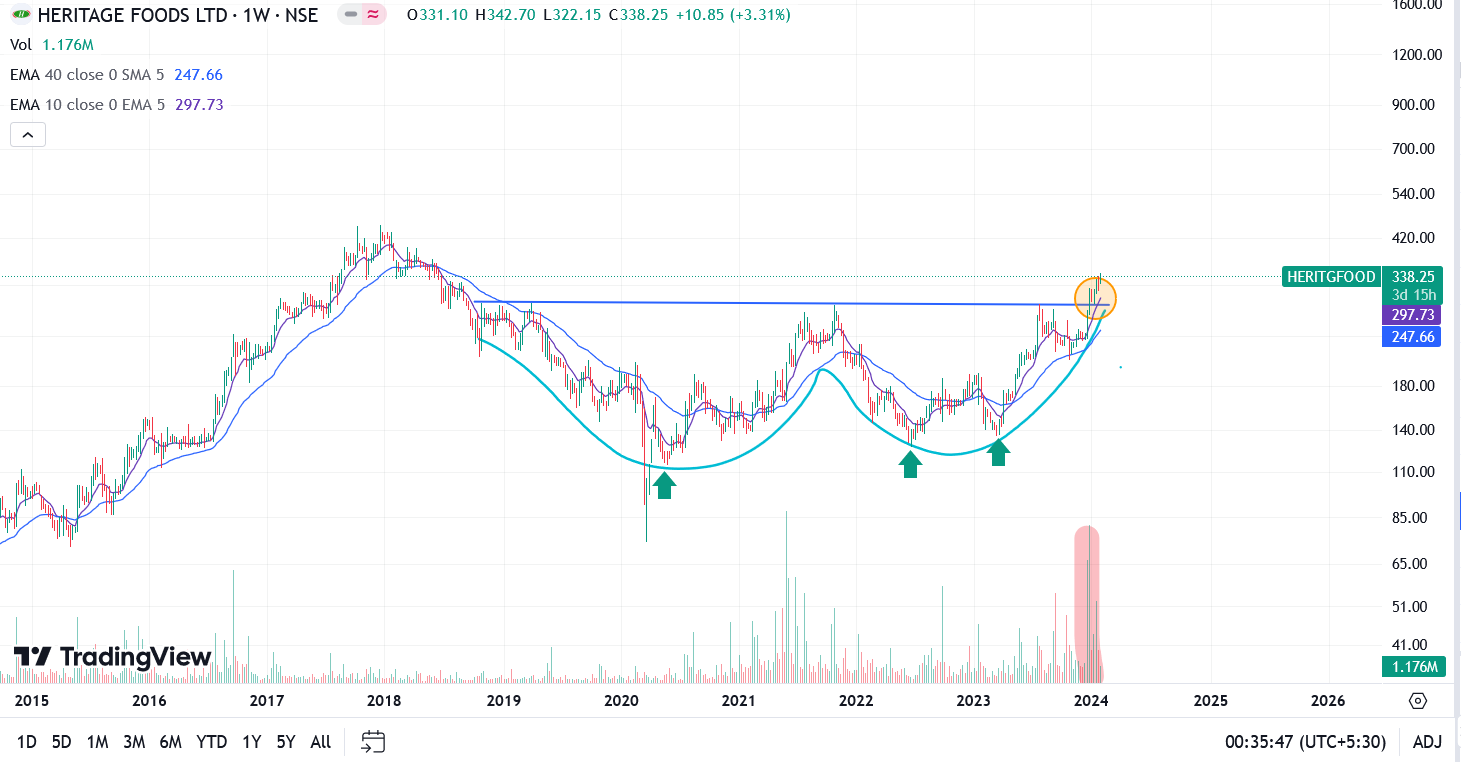
• Currently, at a 6 year break out level. However, it has already had a stellar run the past year (400%). I have seen this pattern before too, seems like a Cup without a handle here. Does this mean we typically need to wait for to consolidate in this range for a while and/or convincingly break the resistance at 33.25 with volumes to definitively (I know there is no such thing in the stock market ) say that it’s a solid set up for an upmove? To all technical experts, any insights are much appreciated.
• From a business standpoint, things are looking good. Latest results are very good. Q3 net profit triples to ₹305.4 crore and asset quality shows improvement
• Still trading at a relatively low PE of 7
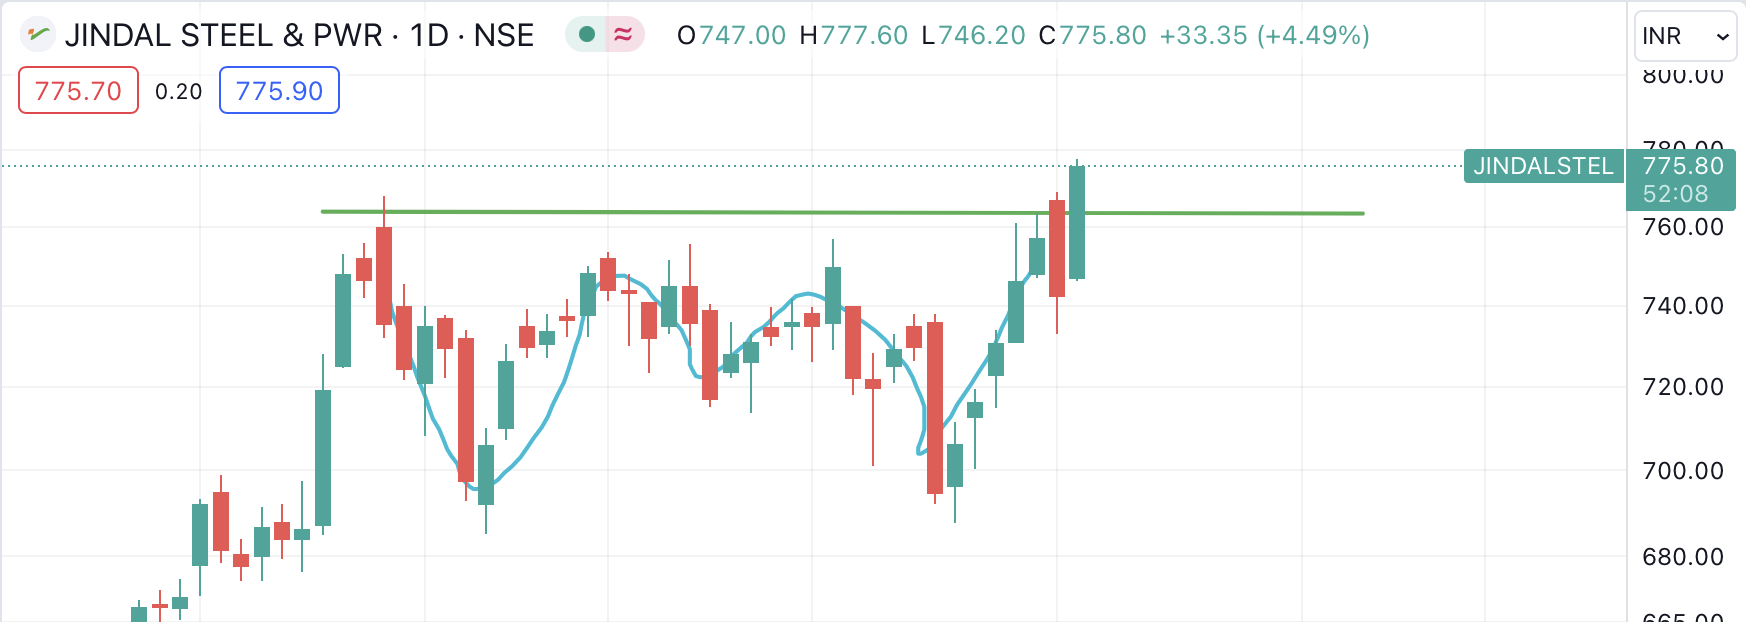
Usha Martin triangular breakout update was put up 9 days back. Since then we had some weak market days. Stock price, after the breakout, did some retests ( down days without really breaking down) and yesterday gave a big breakout with volumes. It took out near term pivot of 334 and closed at 339.
Coming to comparision with previous triangular breakout, we can see huge volumes uptick post triangular breakout at 145-150 in Dec 2022 , a subsequent rally to 200, all with very high volumes and then a dip to retest previous all time high of 165 with significantly low volumes, and again resumption of uptrend. In current breakout yesterday was a big volume day. Now we need to see how things play out going forward. The big hangover in this stock is the frequent selling by Prashant Jhawar group. So that is a factor that needs to be considered. The next major level to cross on a closing basis would be levels of 370
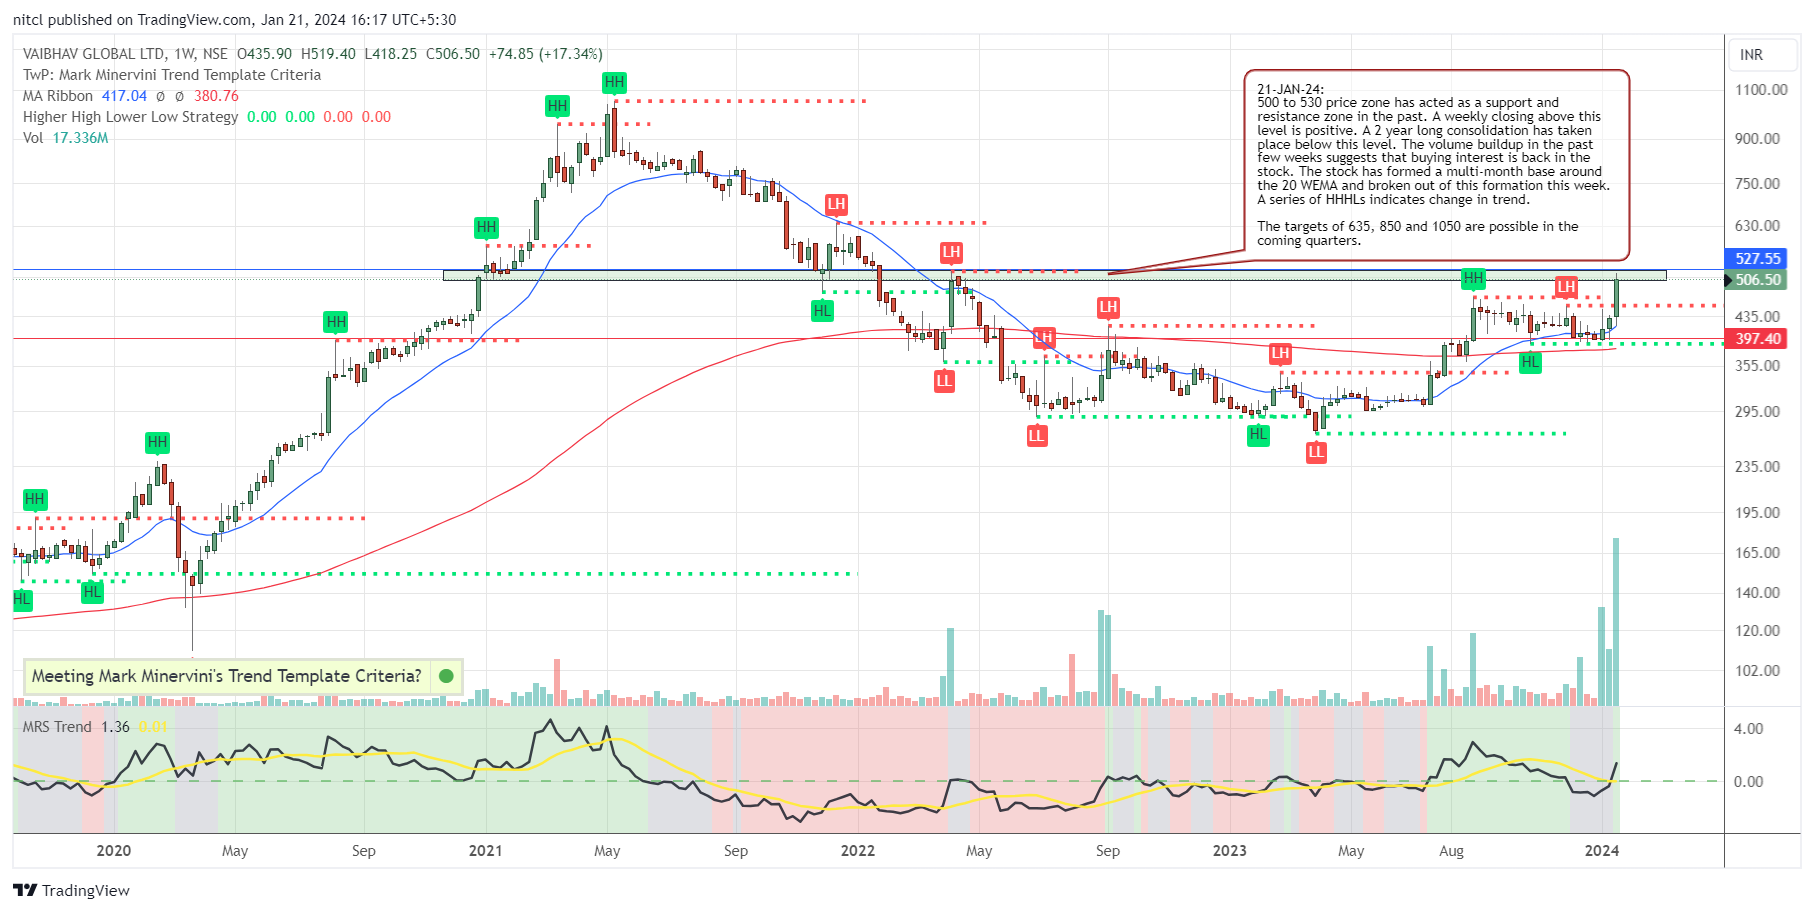
Vaibhav Global - Looking good after this week’s price movement.
Stock is on the verge of a 2 year long consolidation break out.
Volume build up in the past few weeks is encouraging and suggests that buying interest is back in the stock
The price has formed a nice base near the 20 WEMA since Aug, 2023. It broke out of this base this week.
The zone from 500 to 530 has acted as a multiple support and resistance zone in the past. A weekly close above this zone will be very positive.
Indicators such as the Mansfeld Relative Strength and Minervini Trend Template are positive and suggest that the stock is in Stage 2 up trend. The runway to the previous ATH is long and provides possibility of decent returns in the coming quarters.
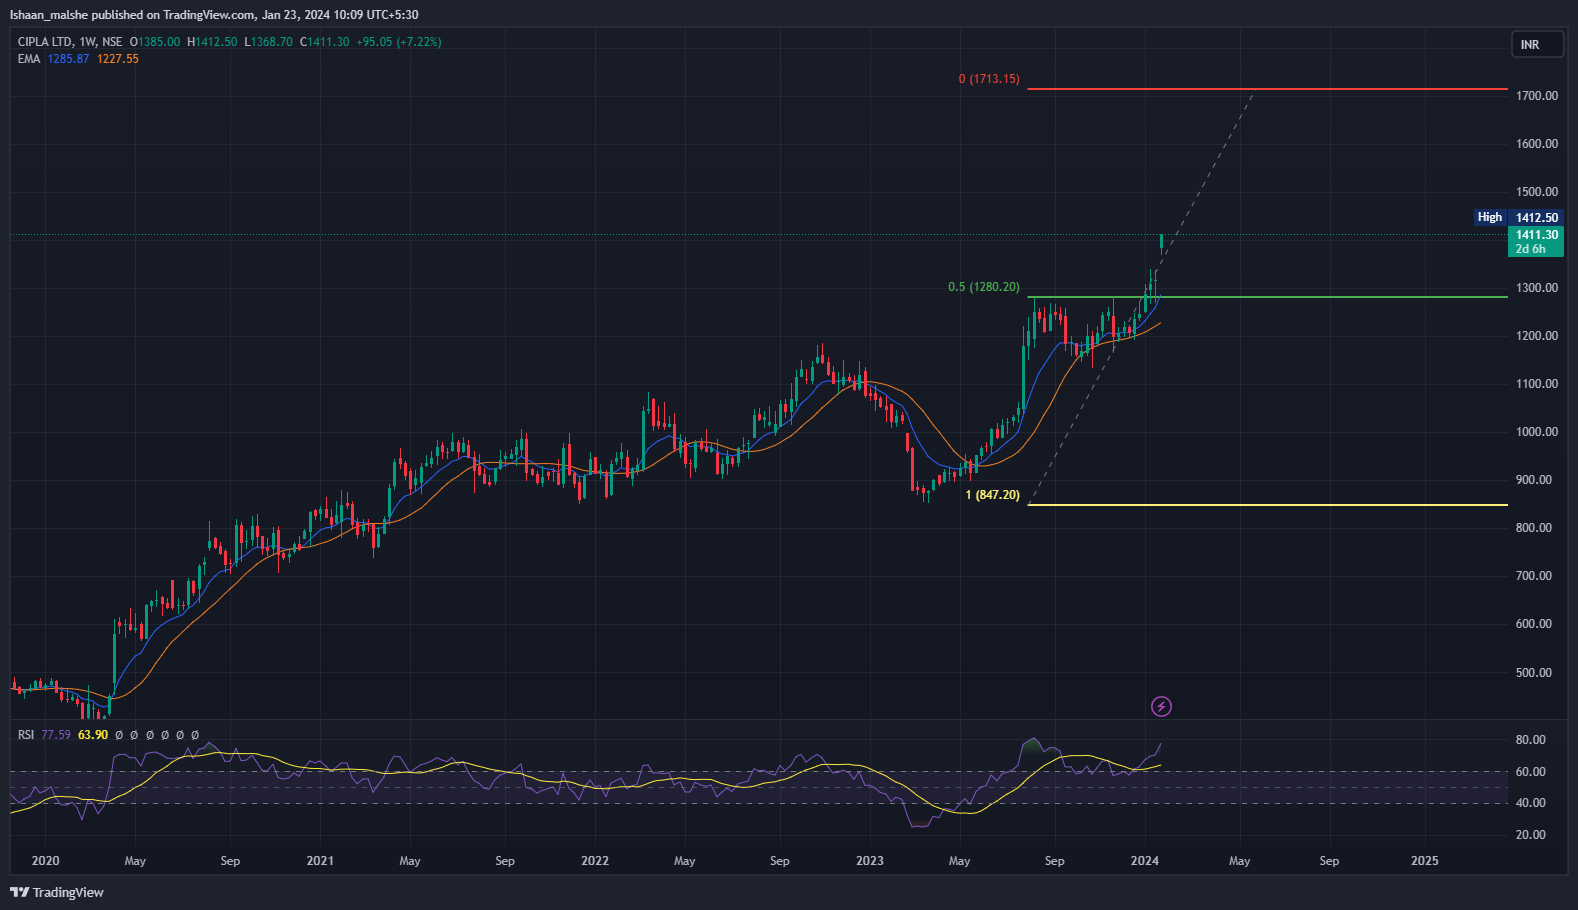
Cipla has broken out of its Flag and Pole pattern and also its 52 weeks high. It has consolidated enough before the breakout, hence the trend is very strong. The targets are close to 1650-1700.
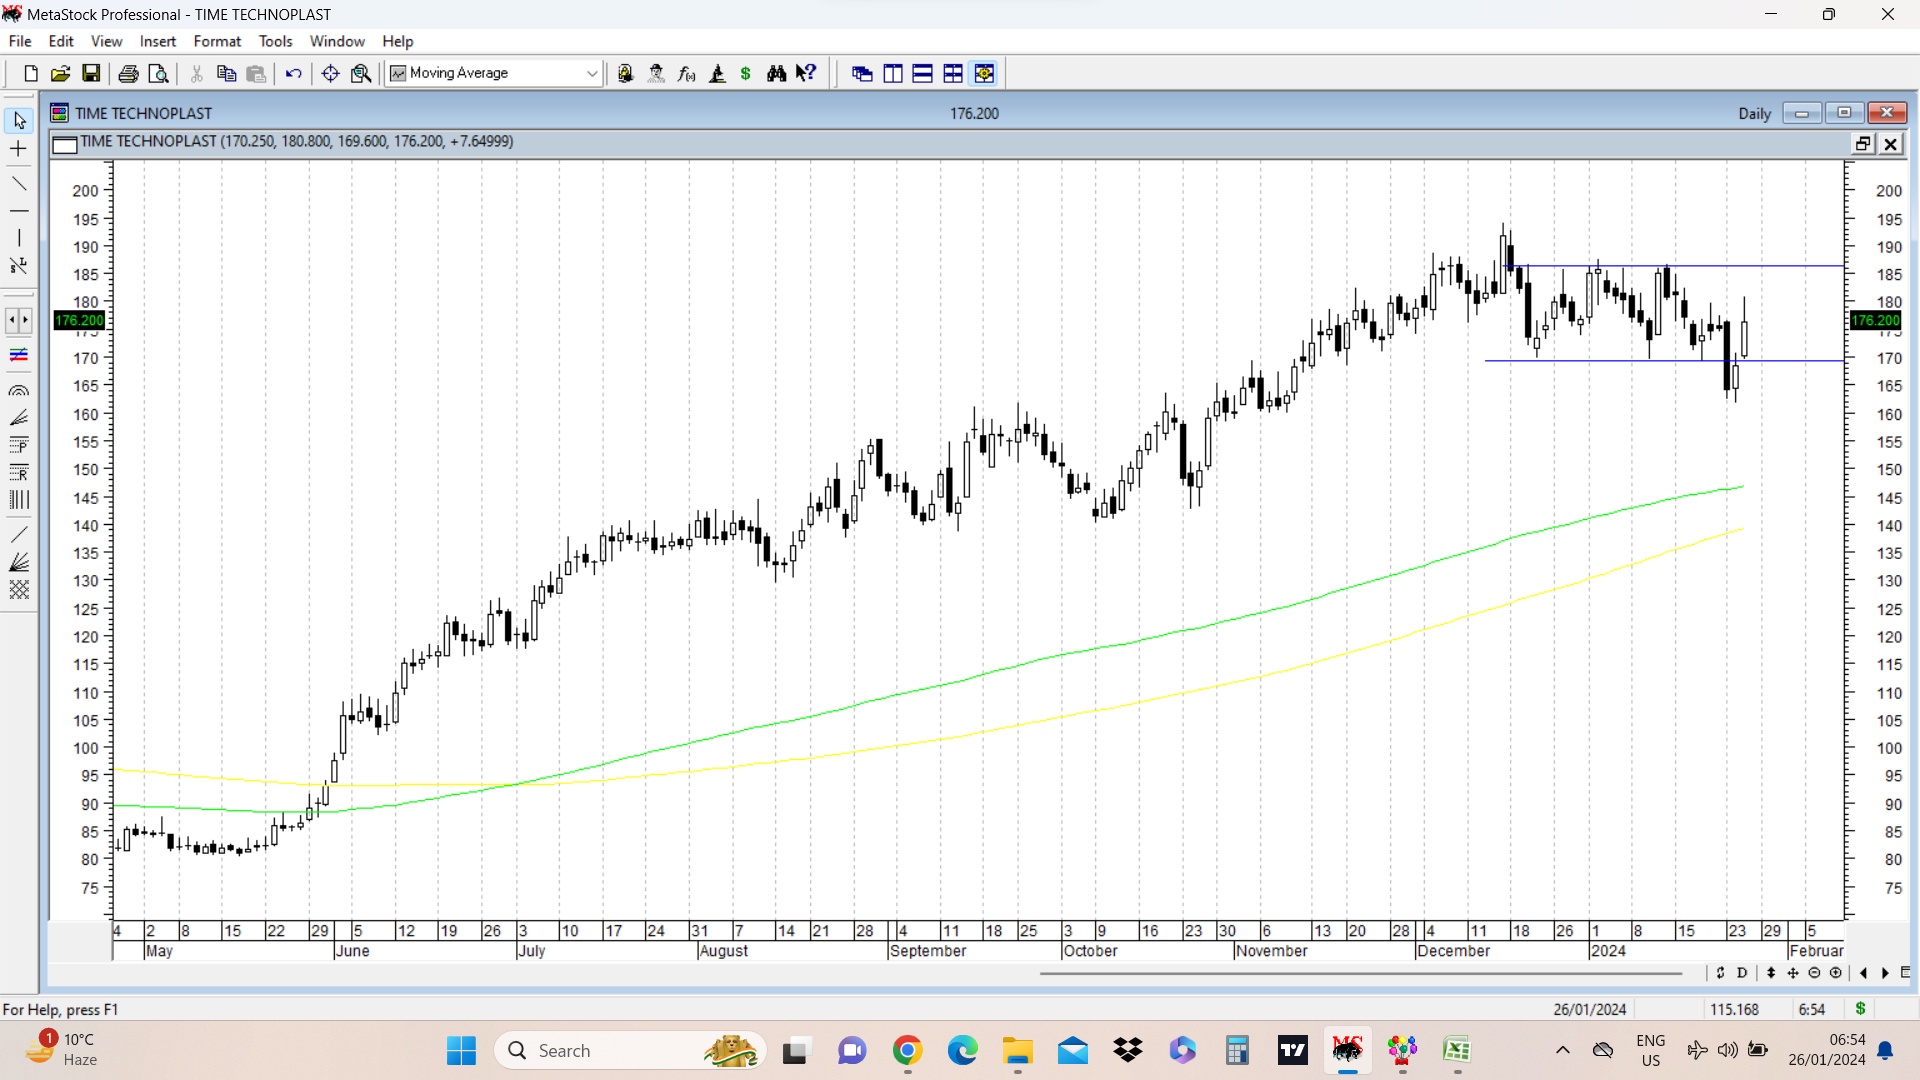
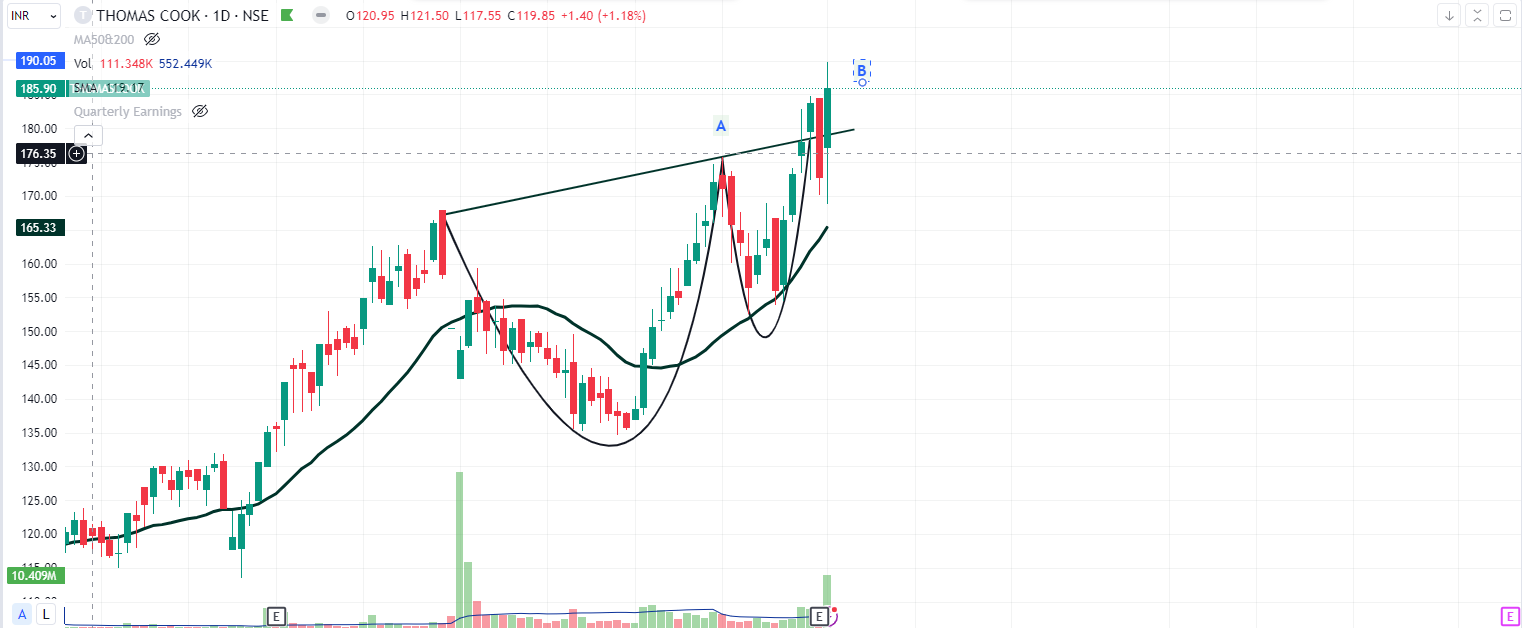
Time Techno stock price was stuck in a price range of 169-187 since past few trading sessions. On 23 Jan 2024, it broke down below this range to post a low of 162 and closed at 164. Within the next couple of days it reentered the previous range with a close at 176 yesterday. This apparently fake breakdown from a range and then an upmove taking it back into the range is often a shakeout move before another major upmove. In Wycoff’s methodology it is termed as SPRING. Confirmation of the pattern happens once stock price crosses and closes above the previous trading range, and the value for that in this case happens to be around 187-188. disc: invested.
For more details on Wycoff method, one needs to just google it and there is a lot of material available.
Sir, how can we possibly know if it is a shakeout or a fall, or the beginning of a fall, in real time? Only after the up move to the previous range, it is called a shakeout. Volume does not help either, with volume on the fall day is more than the previous days. How can we know that the price may come back when both the price and volume are significant?
I am sure you must have seen this many times, what can be done? Cut position if in loss even if SL is not yet hit, book partial profits if in profit, or stay put to see what happens the next day? Or check the news and see if the news justifies the fall?
And do you monitor your trades in real time, or keep alerts for price drops, or do you trail the profits and update the SLs?
For chart patterns as in Time techno discussed above with the Wycoff spring pattern, at the time of breakout its difficult to make out before hand if it is a genuine breakdown or just a shakeout. However a small clue that often helps is that there is no major follow through fall on breakdown.
We have to consider the time frame we are interested in. In case of Time techno, since it was a daily pattern, we have to keep looking at signs of reversal on a daily time frame. As we can see, the stock price quickly climbed back into the channel post the transient breakdown. We still may not be out of the woods. Confirmation will only be once the stock price goes above the higher range of the channel, which in case of Time techno is around 187-188.
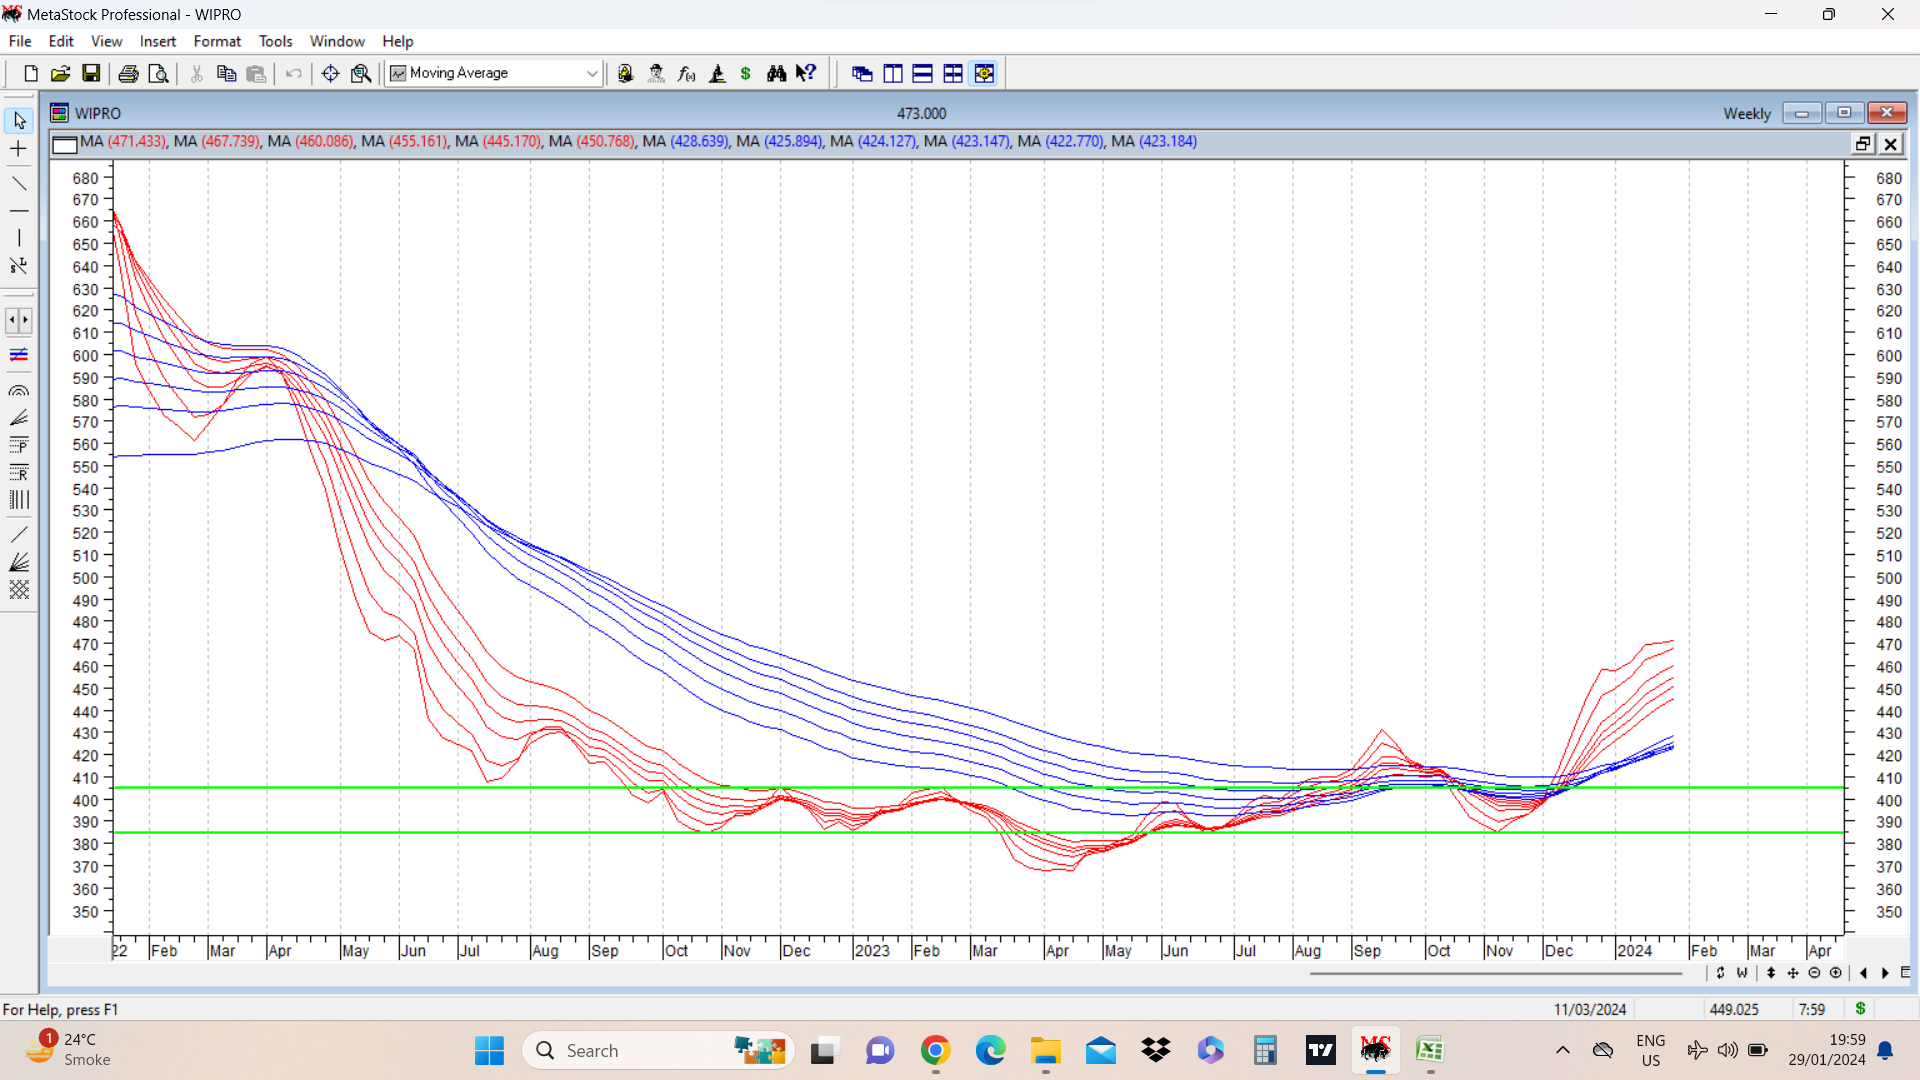
A nice example of spring action on charts of Wipro on weekly GMMA chart is attached to illustrate above point. Note the region between the two solid green lines and a brief dip below the trading range. The spring action can be in the middle or at end of consolidation range.
After forming VCP pattern on the daily chart, the stock has moved higher on account of higher volumes. This price action is supported by very good quarterly figures. In the mid january, previous high was recorded around 176 (see point A), post which the stock pullled back a bit, consolidated around it’s 21 MA and then headed higher registering another ATH (see point B).
HCC chart update. HCC stock price closed this week above 45 ( a 6 year high) with a big bullish weekly candle and correspondingly huge volumes. An important resistance at 45 has been crossed and next level to watch out would be 49. If and when it goes above 49, stock price would break out above 13 year highs. disc: invested.
False breakdown observed.
There was some follow through selling on Friday but the stock could give some nice momentum from here.
Please share your view.
Disc: Looking to enter next week.
On the other hand, its just a typical false rally with green volumes (previously, a few weeks ago) and a breakdown on shorter term currently. Its not a false breakdown as its a pullback.
for the stock to be considered viable for a technical buy it must show adequate strength both in volume and price data.
I believe of a large group of investors/traders to exist that believes that their stock selection (like the one above) will now start rallying again due to a bull run in Indian markets.
But this habit could easily lead you to underperform the market indices both over short and long term.
Its always better to trade and invest in economically conducive sectors/industry groups/pockets of markets than to chase for fallen stocks in hope for a decent return in it rallying back to its previous ATH’s.