Usha Martin chart update.
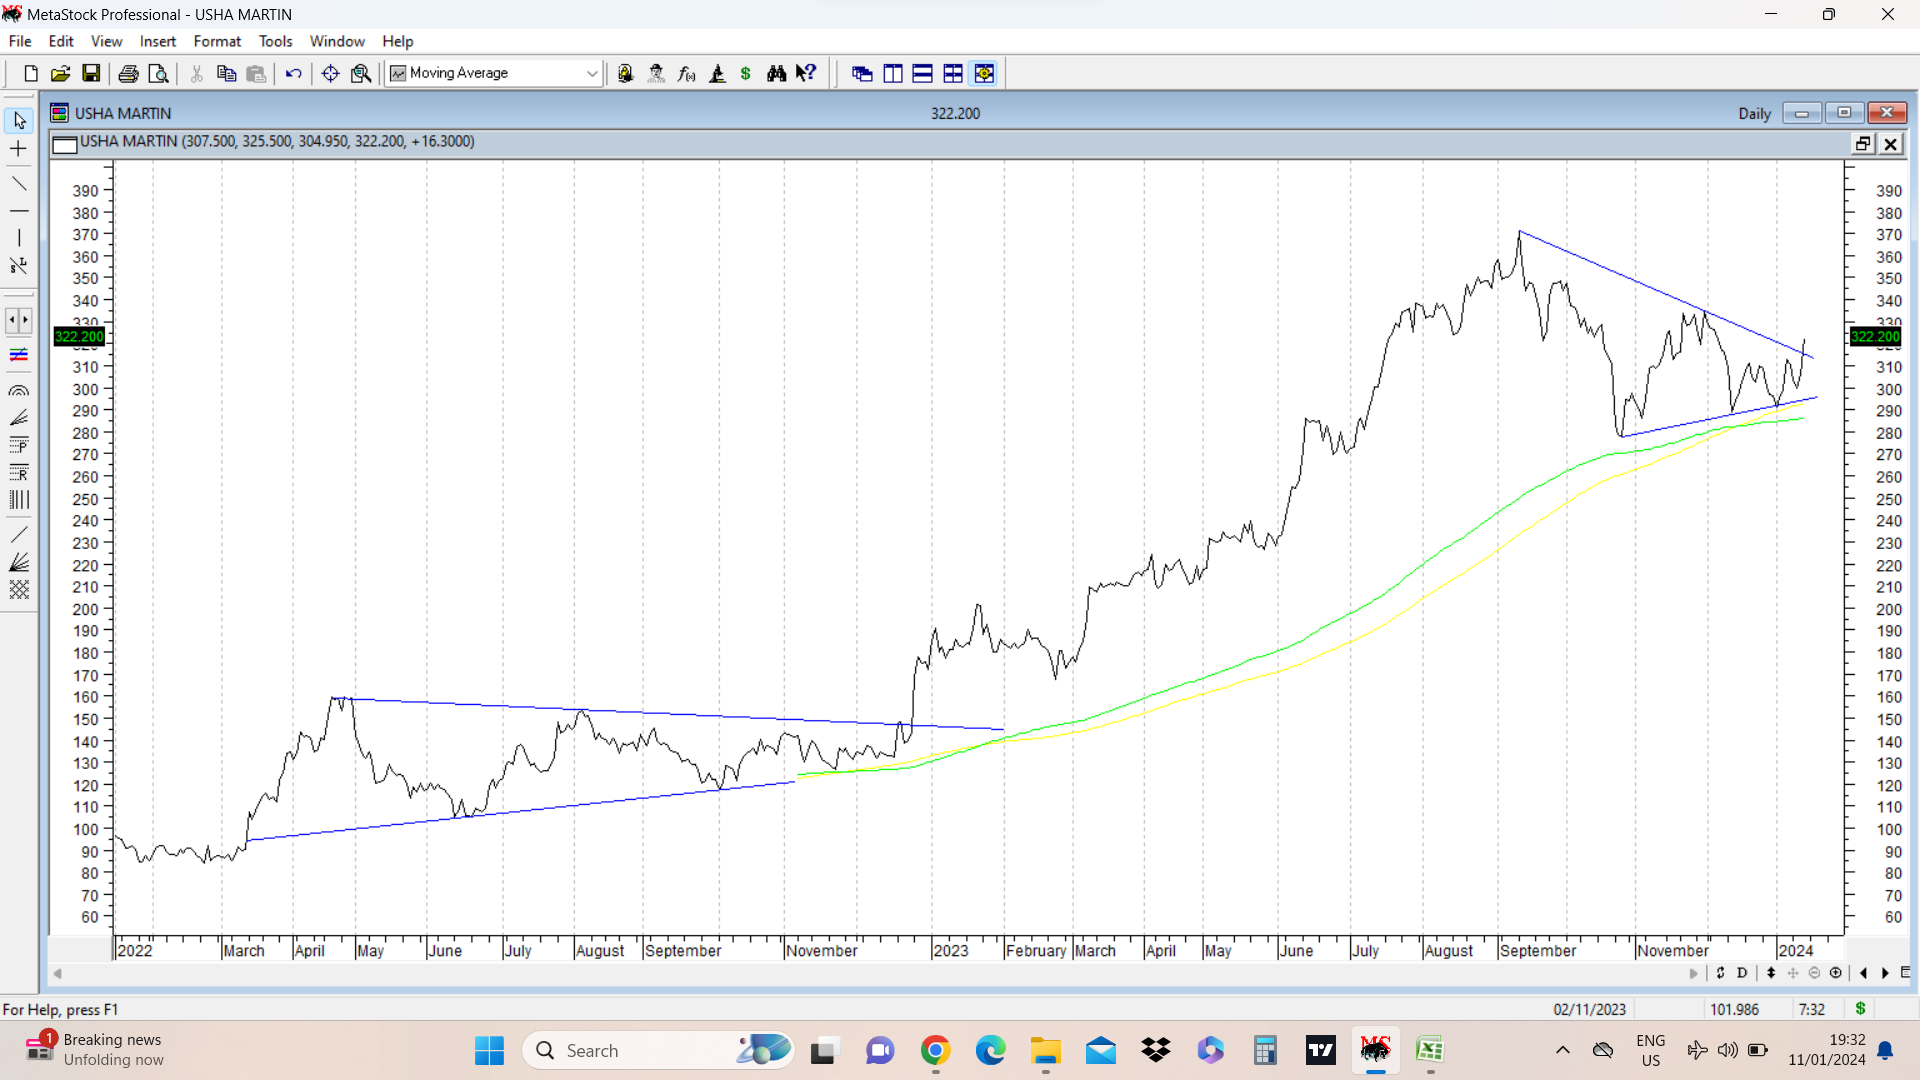
Stock price has been in a prolonged consolidation since Sep 2023 and this has taken the shape of a triangular consolidation. The daily line chart put below shows a breakout from a triangular consolidation. It’s also worth noting that this whole consolidation took place at or above its 200 dema.
Also marked on the chart is a previous triangular consolidation which lasted nearly 9 months and which was followed by a sharp rally. Current consolidation has taken more than 3 months before breakout happened.
The hallmark of triangular consolidations is that for anyone holding stock during these phases, its a period of intense frustration and often loss of faith. I have been in this stock during both these triangular consolidations and it is only the faith in the fundamentals of the company which has comforted me during this period. And inspite of all this it is worth noting that during the past 12 months the stock price has appreciated by nearly 80% which is not bad.