
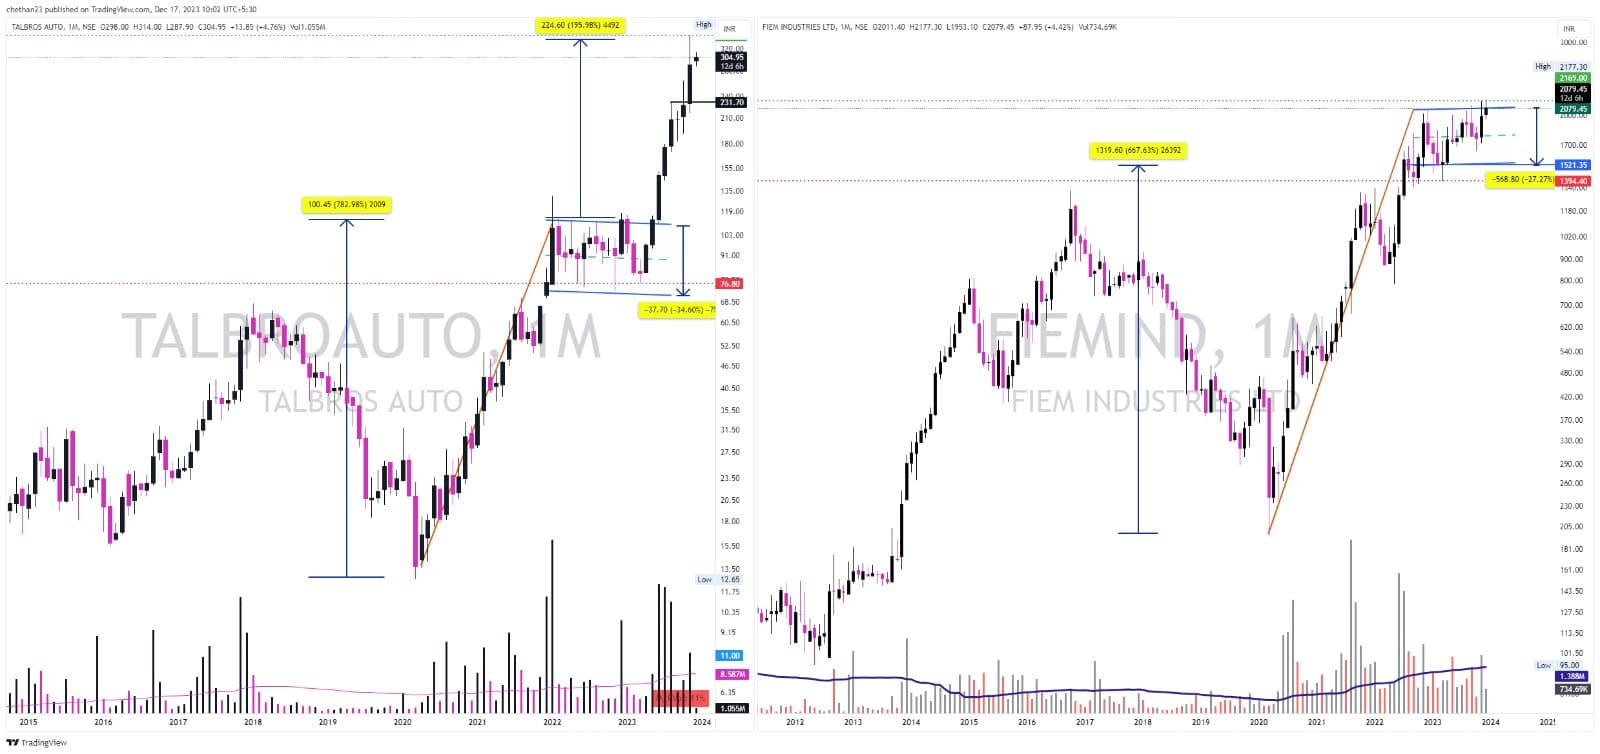
Here is the monthly charts for 2 stocks, 1. Talbros and 2. Fiem both from same sector. Some of the similarities i observed between the both are as follows. In case of Talbors, it moved over 700% and the went side ways for about 17 to 18 months with the consolidation range of 30%. and then when it broke out gave a strong upmove of over 200% within 6 moths, Now Comming to Fiem we can see similar pattern stock has made about 700% upmove and side ways for over 17 to 18 months now with 30% consolidation range, and it near very of monthly BO, both have flag pattern on monthly, lets watch and see how this turns out
6 Likes
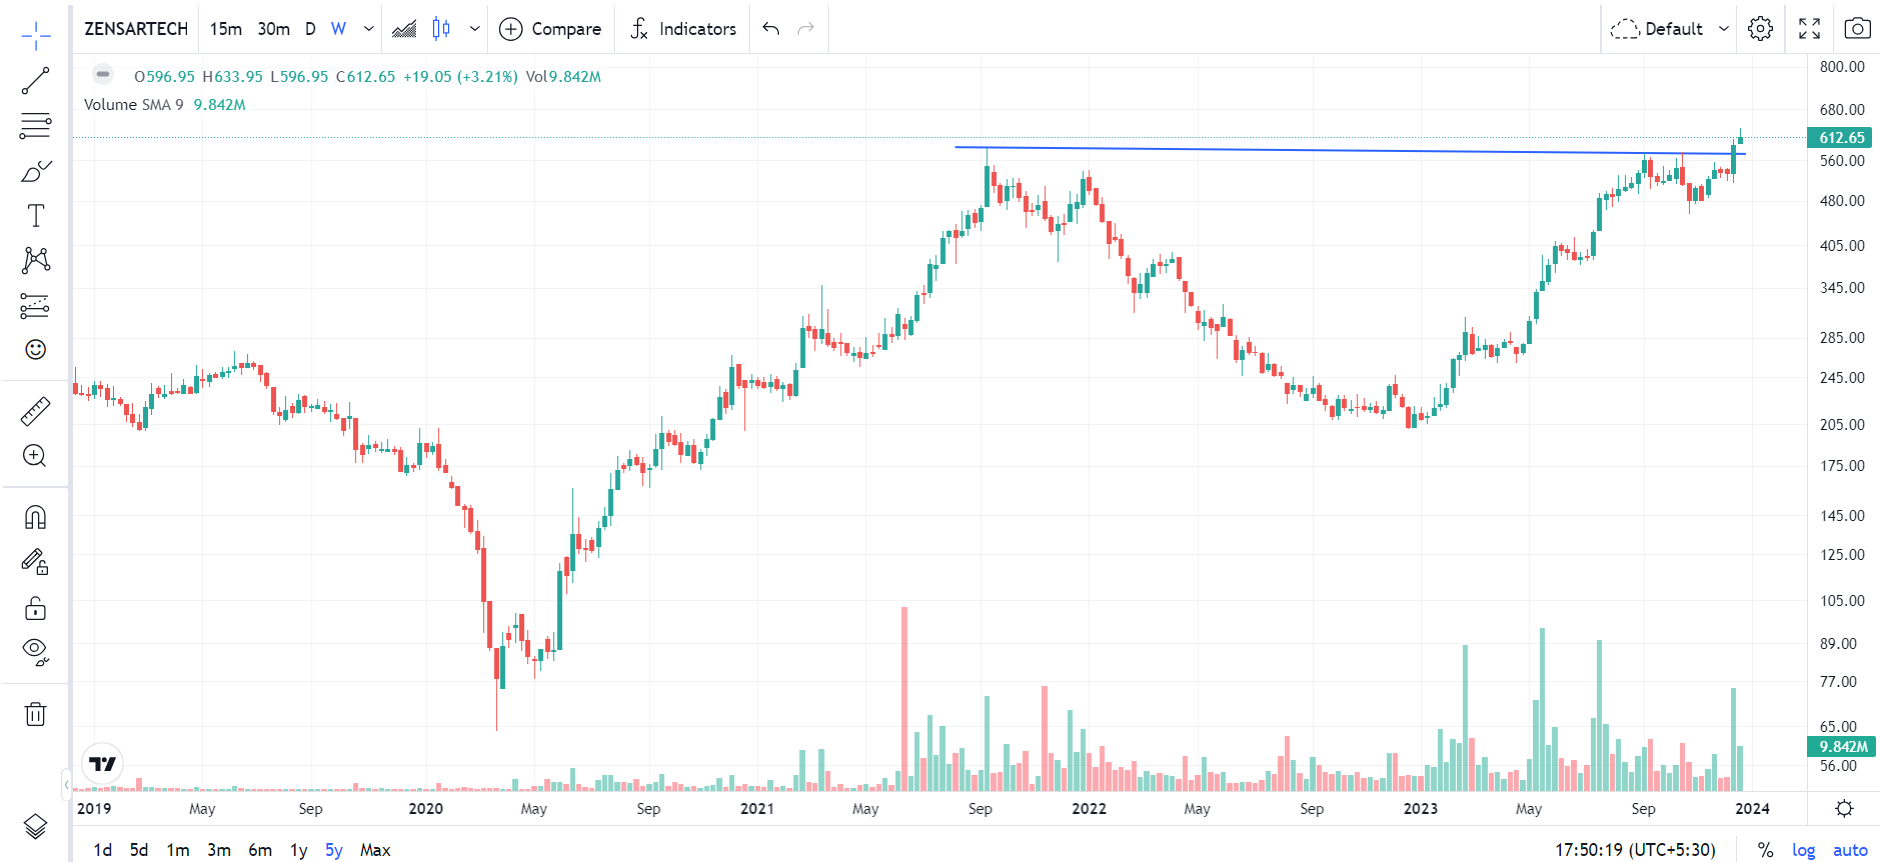
Zensar Tech - CMP 613
Zensar tech’s stock price has moved up since last week along with all other IT companies. Point to note, the stock has created and completed a cup and handle pattern and closed at an All time high. The stock price has come out of a consolidation which lasted for more than 2 years ( 590 levels in mid Sep 2021 and Friday’s closing was above 590. Today’s closing 613)
Fundamentally management has been doing a lot of cost cutting which is reflected in Q1 and Q2 results. Also one can go through their lastest conference call transcripts.
Disclosure : Invested. (not a recommendation, anyone contemplating investing needs to do their own diligence).
6 Likes
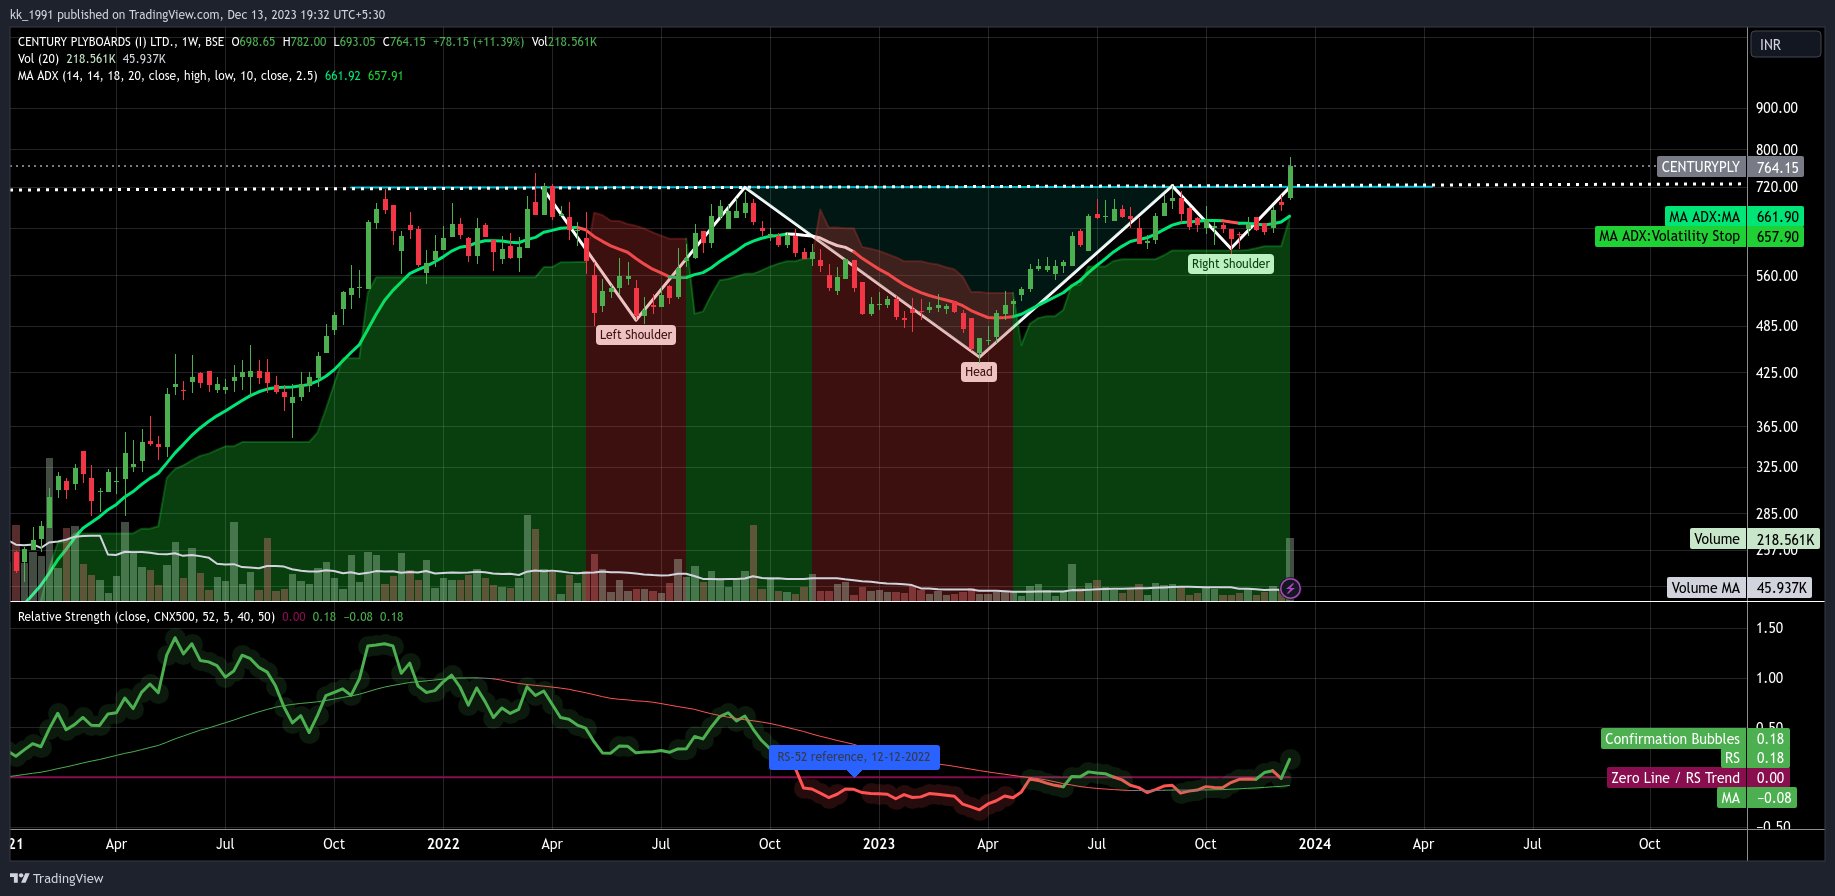
Have a look at Centuryply, after a perfect 2 year base, it is breaking out with good volume & rising RS.
7 Likes
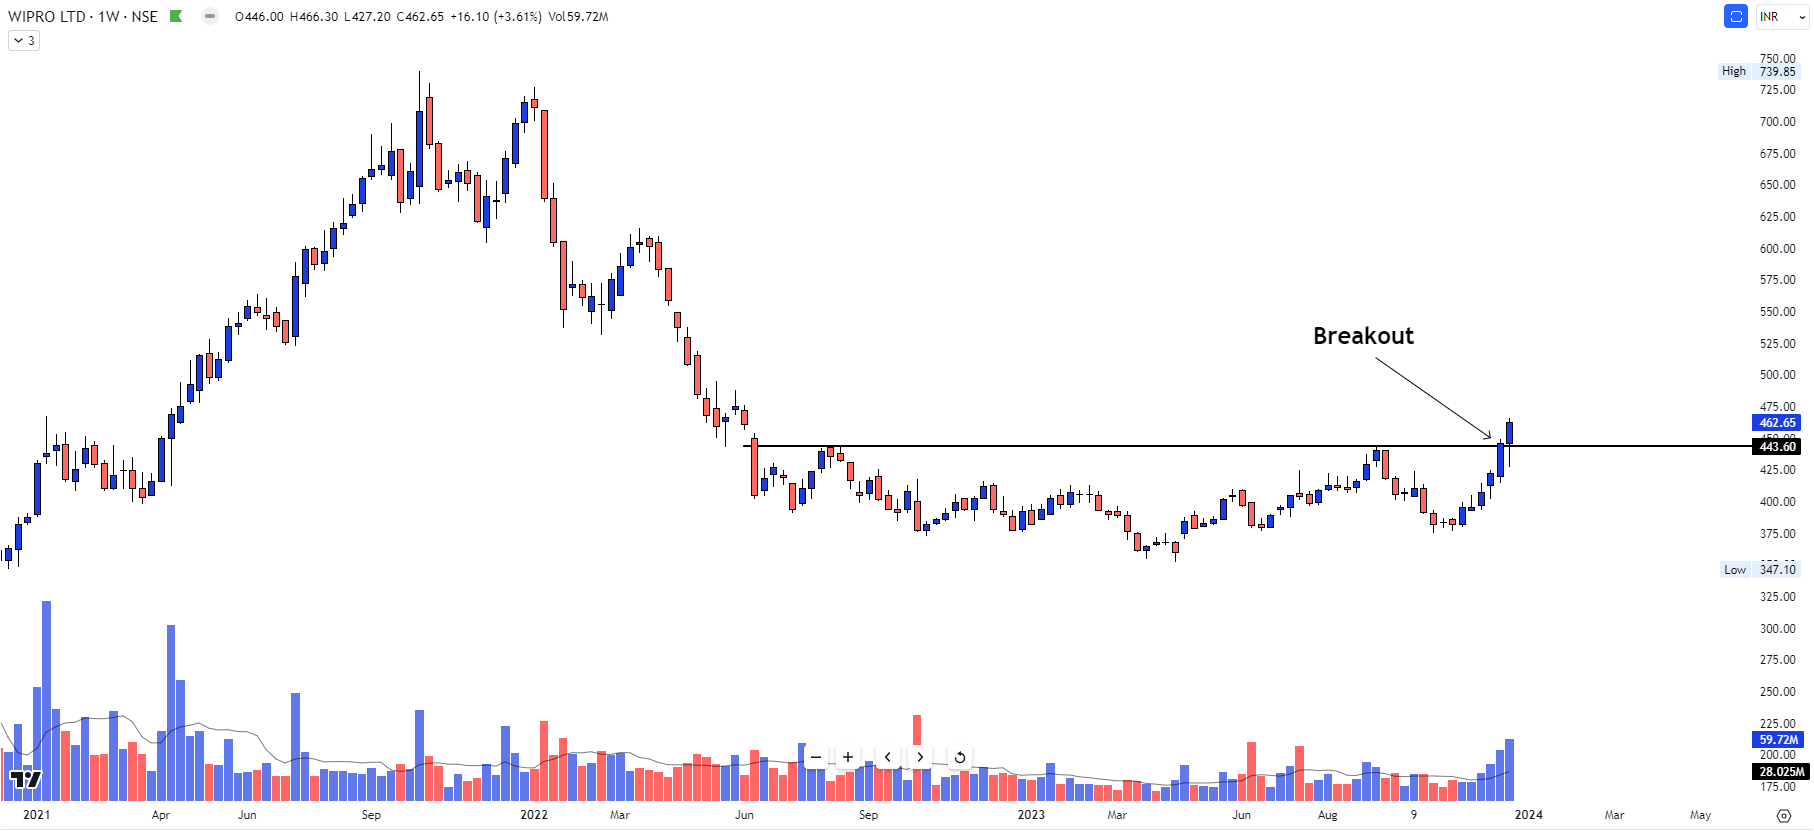
WIPRO
CMP: 462.65
Wipro stock peak at JAN 2022 and going down and stock Consolidation JUN 2022 to DEC 2023 (18 Month of consolidation ) and now Breakout in DEC 2023 on weekly closing basis
Almost 2 yr it wont perform and trend is changing as we see Stage 2 breakout happen with Last 4 to 5 week volume is increasing which clearly indicate institute player might enter that time
WIPRO is largecap IT company and Stable company
For coming Months WIPRO looks very interesting you need to watch and track this stocks
Disclosure: Invested & This post is not a Recommendation so before taking any action due diligence)
3 Likes
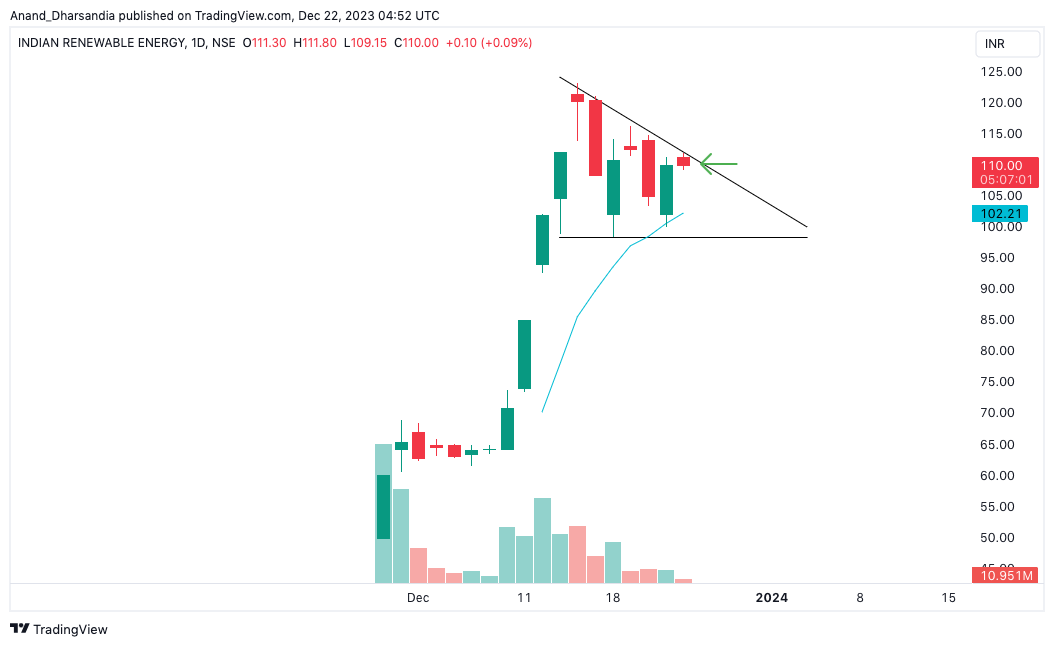
Recently listed IREDA IPO making Flag and Pole pattern. Loan Book Growth is 30% and PAT grwoth is 50%. Financing Renewable Energy Projects were most of the private sector banks are not interested. Recently started Retail Segment for Roof Top Solar project.
If loan book and PAT grows at this rate due to requirement of investment in renewable energy sector. This can be an interesting story.
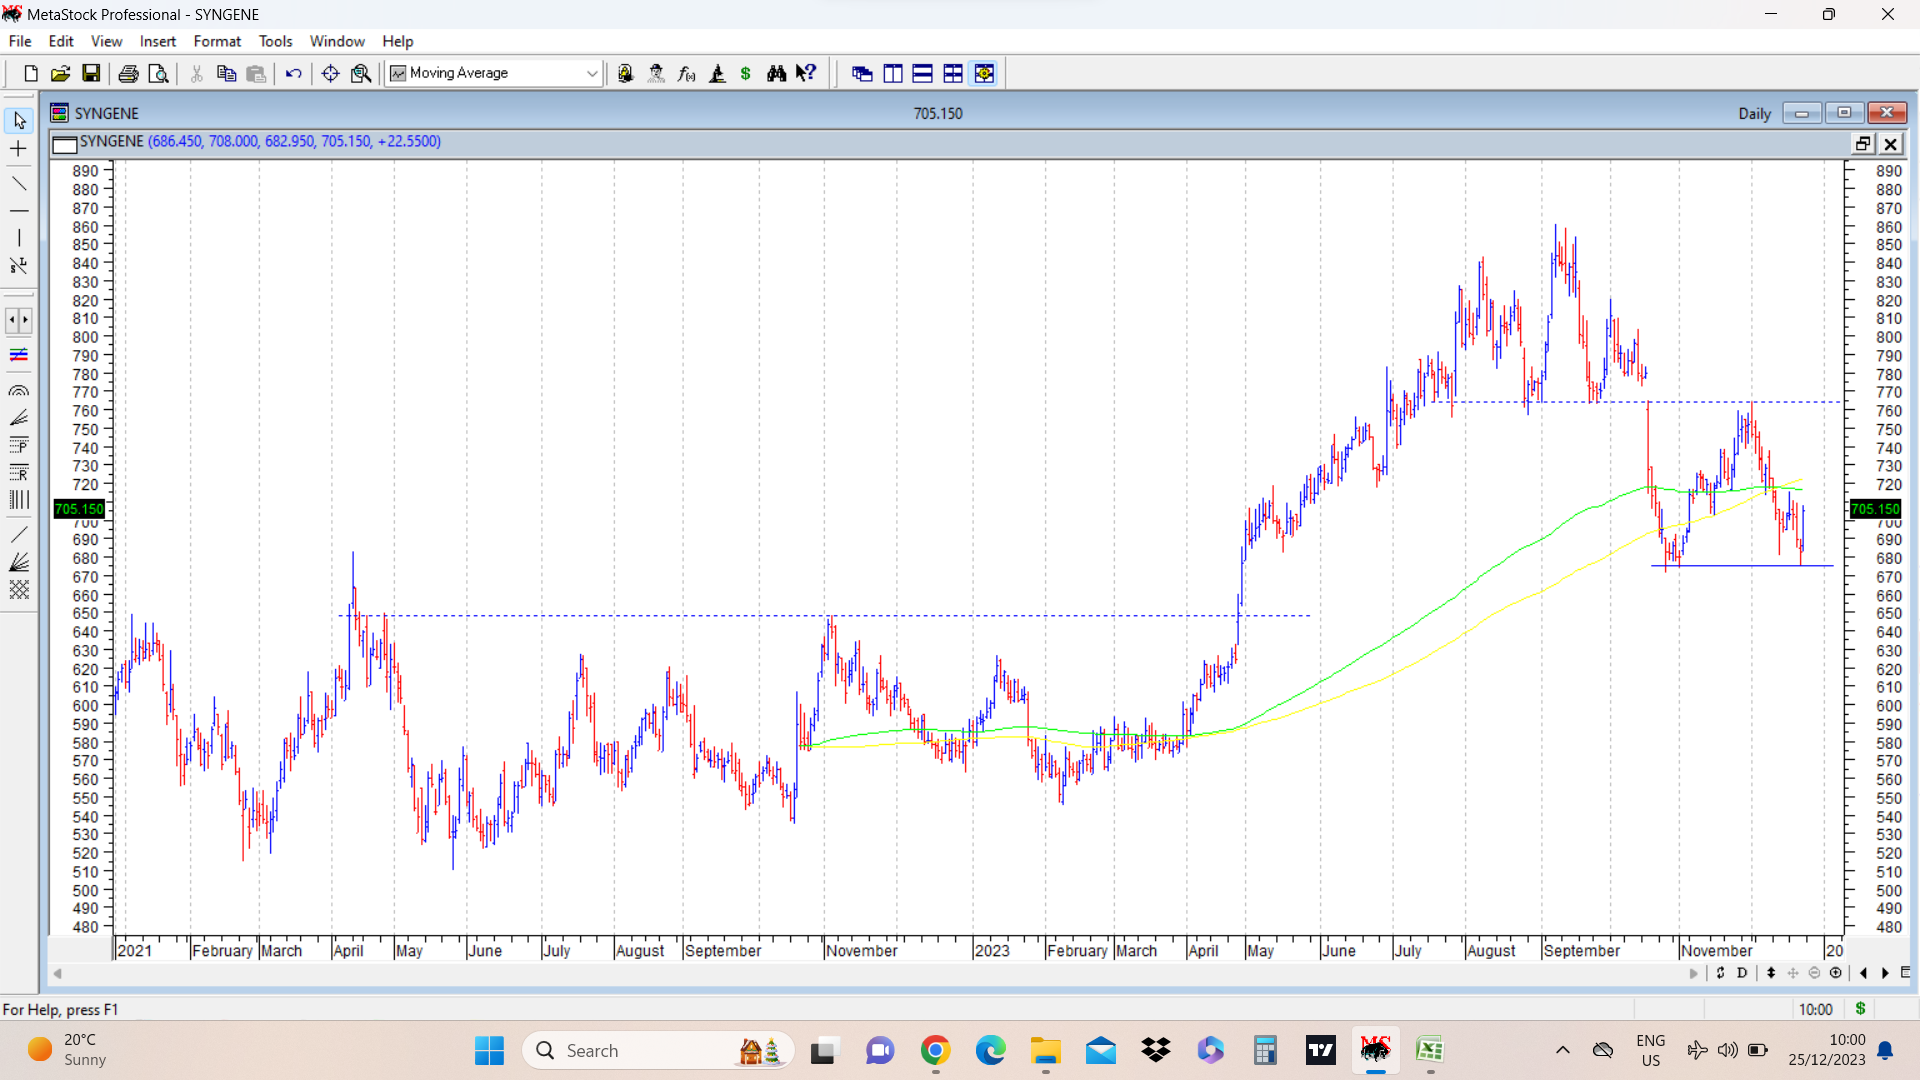
Syngene 705. The daily chart put up below shows the importance of staging. On left side, once the stock price broke out above 650, it raced ahead quickly to 860. A lot of folks were excited by this breakout move. But with distribution and a head and shoulders pattern formation and subsequent breakdown with a gap below 760, it corrected to post a low of 671 and went up and faced resistance at exactly neckline of the head and shoulders pattern. It then went down and formed a double bottom at 670-675 region and now we need to see how it goes. The equation seems well defined here. A breakout above 760-770 would confirm a double bottom pattern whereas a breakdown below 670 would indicate further bearishness.
I don’t have positions here but the chart has very clear cut breakout and breakdown levels which could he used for learning purposes.
37 Likes
Pondy Oxides seems to have broken out from a very long base with huge volume. What worries me (as a newbie wannabe technical analyst) is that it went as low as 380 to close at about 520 levels. Clearly some big names are transacting but haven’t got a clue if it is to be interpreted as a breakout.
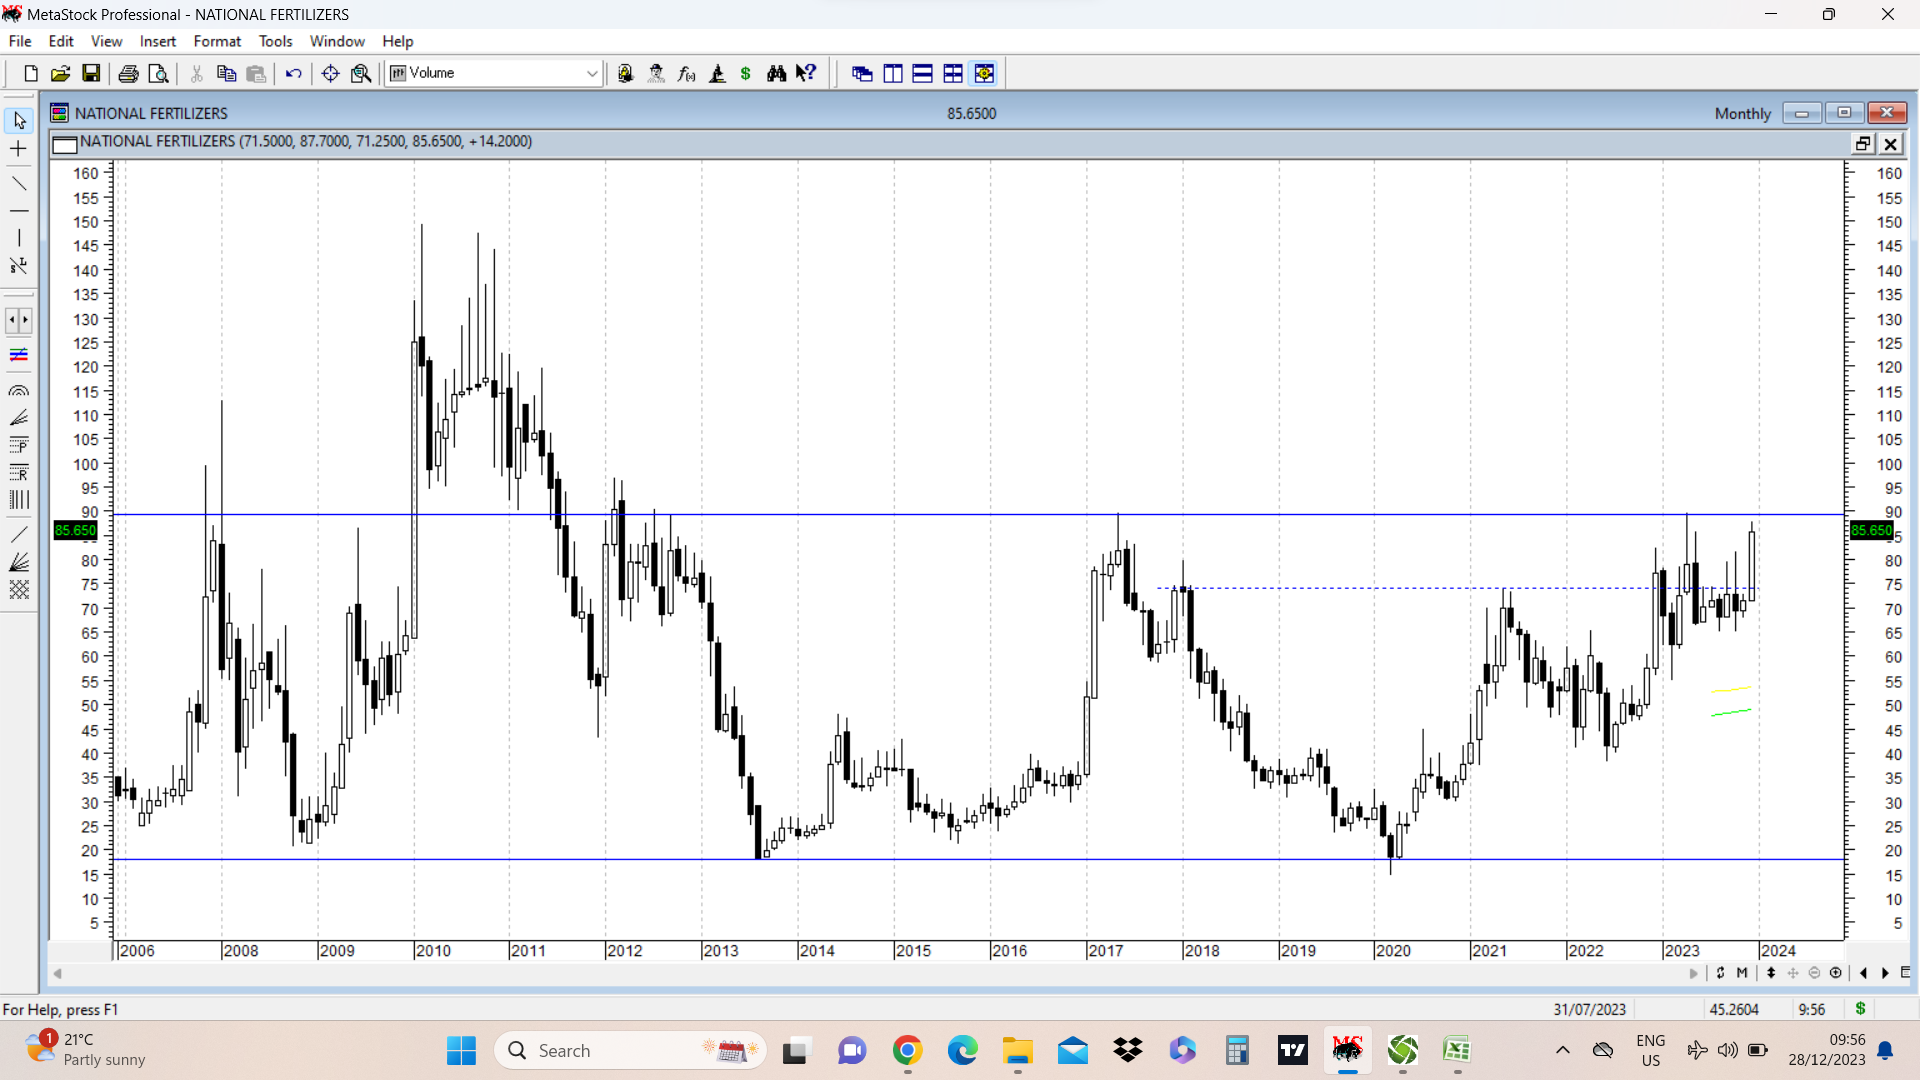
NFL cmp 85 (monthly candle chart attached) has broken out of a cup and handle pattern above 74 and has been consolidating in a broad range of 65-80 since past six months with monthly candles with small bodies. This month it seems to be attempting to breakout above the previous six months range. A decisive close above 90 would provide a 11 year high breakout. disc: invested with small allocation purely based on technical picture. ( not a recommendation, and anyone contemplating investing should do their own diligence. )
24 Likes
Update on NFL chart. It did manage to close above 90 and thus gave a monthly close above a 11 year high.

Now coming to a similar chart of NLC posted few months back on this very thread and its outcome.
NLC broke out of a 12 year high in August 2023 by crossing 123 and posting a monthly close of 130. Since then it has had a tearaway run and currently at 253 after posting a swing high of 270 , just a few rupees short of its previous all time high of 277.
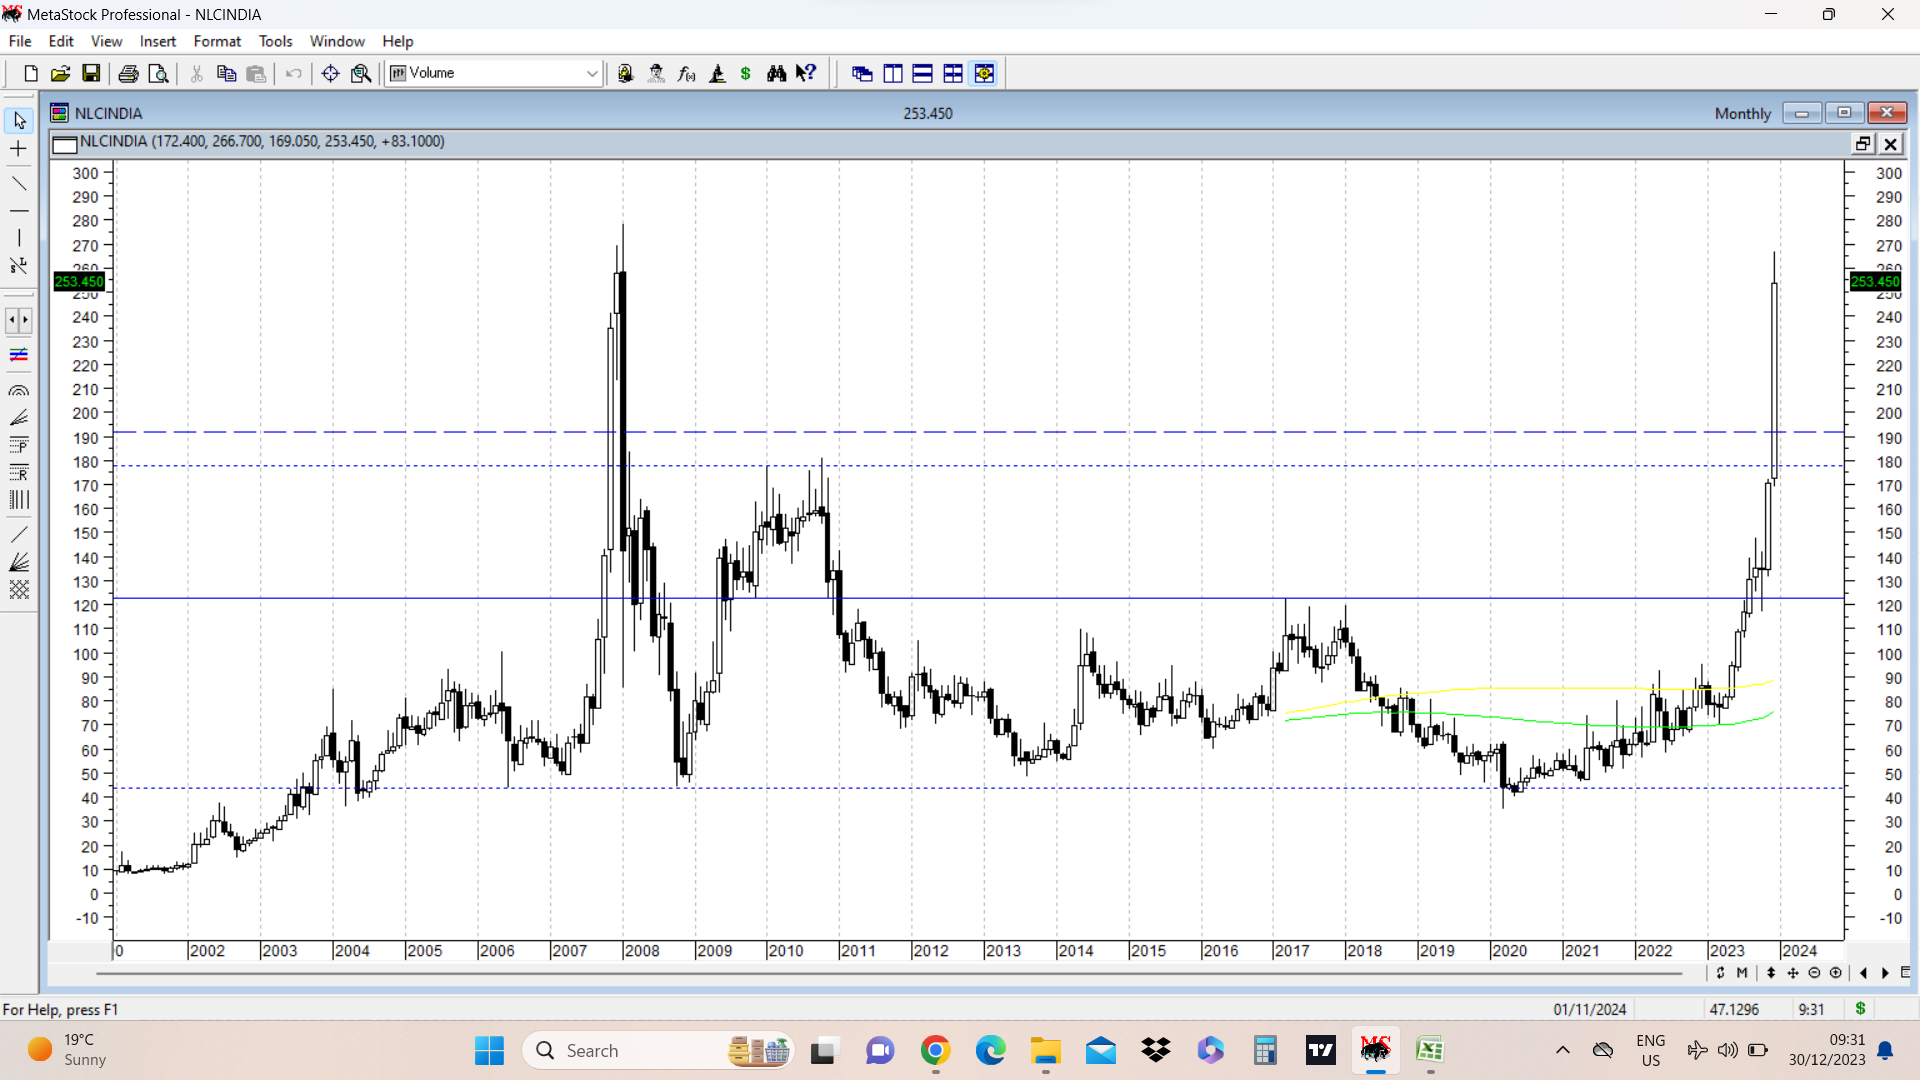
Both charts have similarities, but that doesn’t mean both will have similar trajectories. Usually after this kind of breakouts, there can be retests for a few weeks/months and then upmove can resume. The favourable aspect here is that fertiliser sector is picking up momentum currently. And NFL happens to be a PSU company which is a badge of honour these days among stocks. ![]()
31 Likes
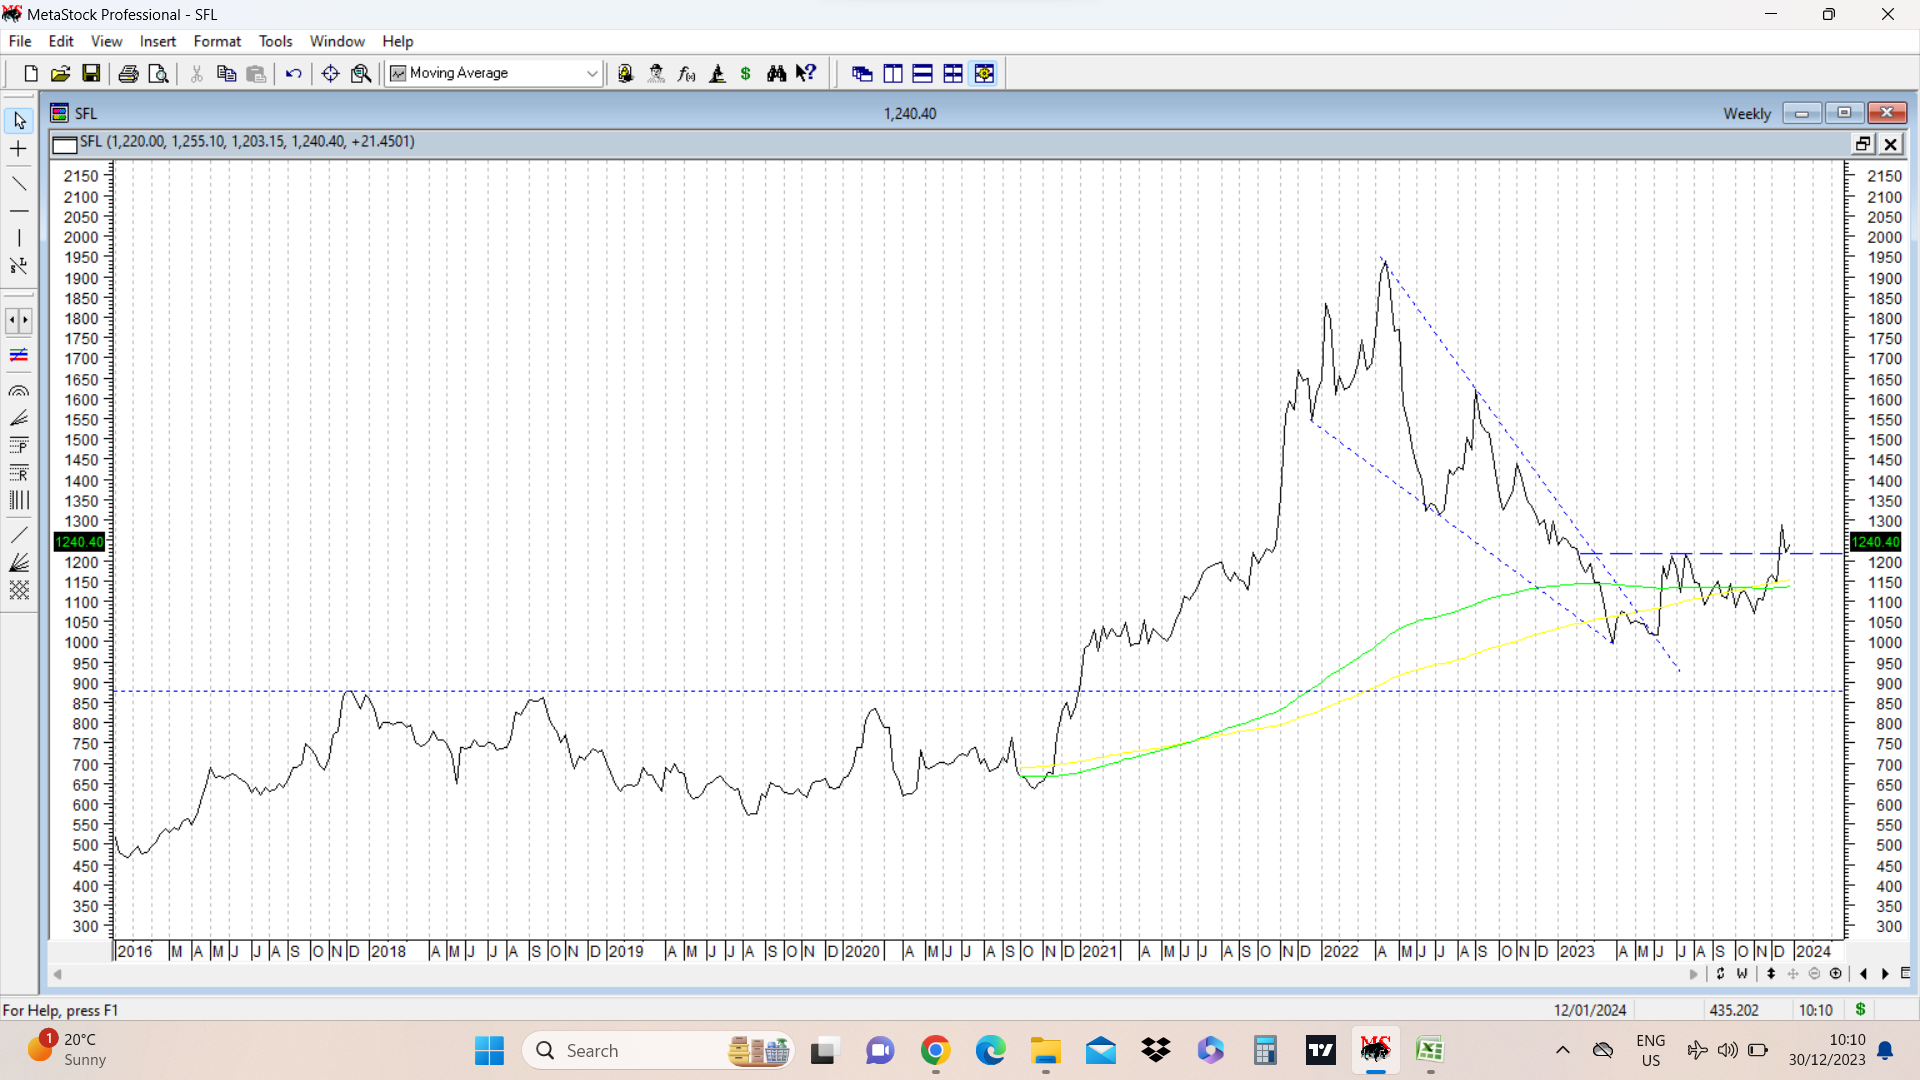
Sheela Foams Ltd (SFL) cmp 1240. Company sells matresses under name of Sleepwell. An important development during the preceding quarter has been acquisition of closest competitor Kurlon. That makes the company an even more dominant player in the segment. However threat of new companies launching similar products on E commerce platforms remains. It also acquired 35% stake in Furlenco which is a furniture rental company. ( For me furlenco stake acquisition did not make too much sense, but in these kind of events, we need to give more rope to management)
Company recently faced strong headwinds due to fall in raw material prices and hence high priced inventory problems. Sales degrew though margins managed to hold up in 11-12% region.
Technically it crossed its post listing closing high of 880 (bar chart shows high of 922) in January 2021 and had a strong run up to a high of 2027 in April 2022. It has been in a corrective mode since then posting lows of 906 (retest of previous major resistance) and recently managed to close above crucial swing resistance at 1215. There is a hint of a retest on weekly line chart .
So here we have a big fall from highs of 2000 plus to levels below 1000, and then consolidation below 1215 for nearly 10 months and then a breakout above 1215. Need to see how this pattern plays out. Fundamentally management talks of good growth in q2 fy 24 concall, citing better numbers for q3 fy 24 due to festive sales. If the acquisition of Kurlon plays out well then we could see good upsides. As of now there is no clear picture, except hints of a turnaround on charts. disc: small starter position based on techno funda picture.
40 Likes
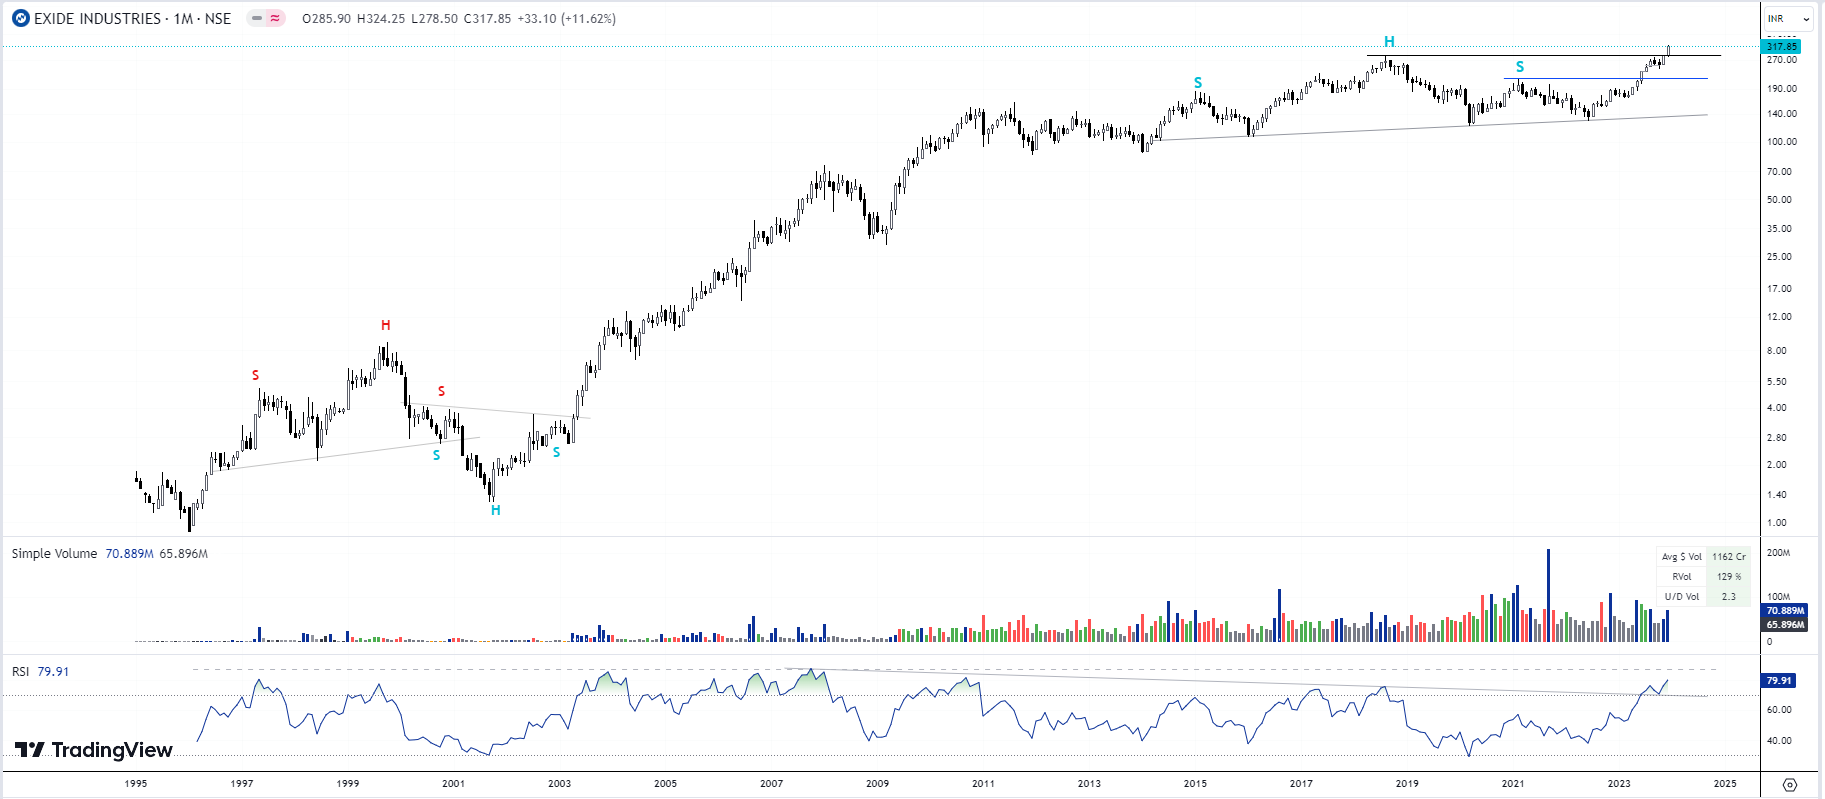
Update: EXIDEINDS 199-294-320
- Excellent reversal seen in monthly chart. H&S reversals lead to strong bullish upmoves as seen by previous examples posted by me.
- ATH made after topping out in August 2018. Big multi year breakout seen.
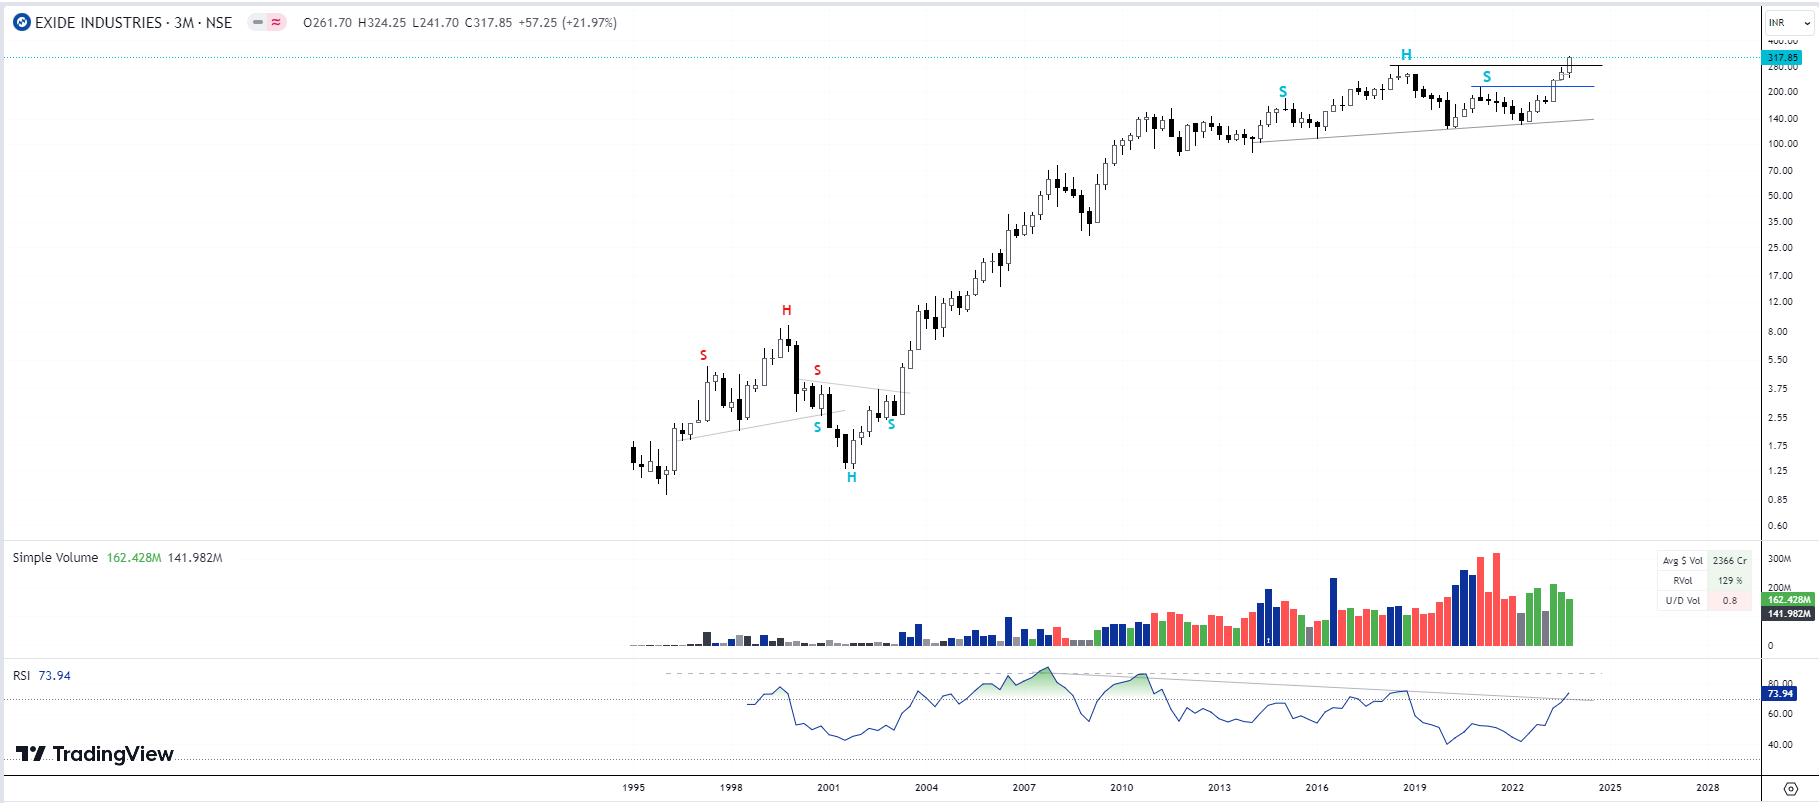
- Monthly and Quarterly charts bullish…
Monthly chart
Quarterly chart:
4 Likes
Bharat Bijlee(BBL)16 year Breakout, retested with CUP n Handle chart.
Volumes are increasing. Electric suppliers had been in traction for quite some time BBL is late to join the party.
Earlier it was mainly dependent on SEB(State Electricity Boards) Now it has started executing Pvt orders as well.
ShriRam Pistons , Break out happened above 1200 then retested with Cup and Handle.
Good Support at 1000 , Volumes have increased significantly.
Lot of stakes racked in by Institutions recently.
Company also purchased 2 companies out of which 1 is Singapore based and having patents for EV Motors.
12 Likes
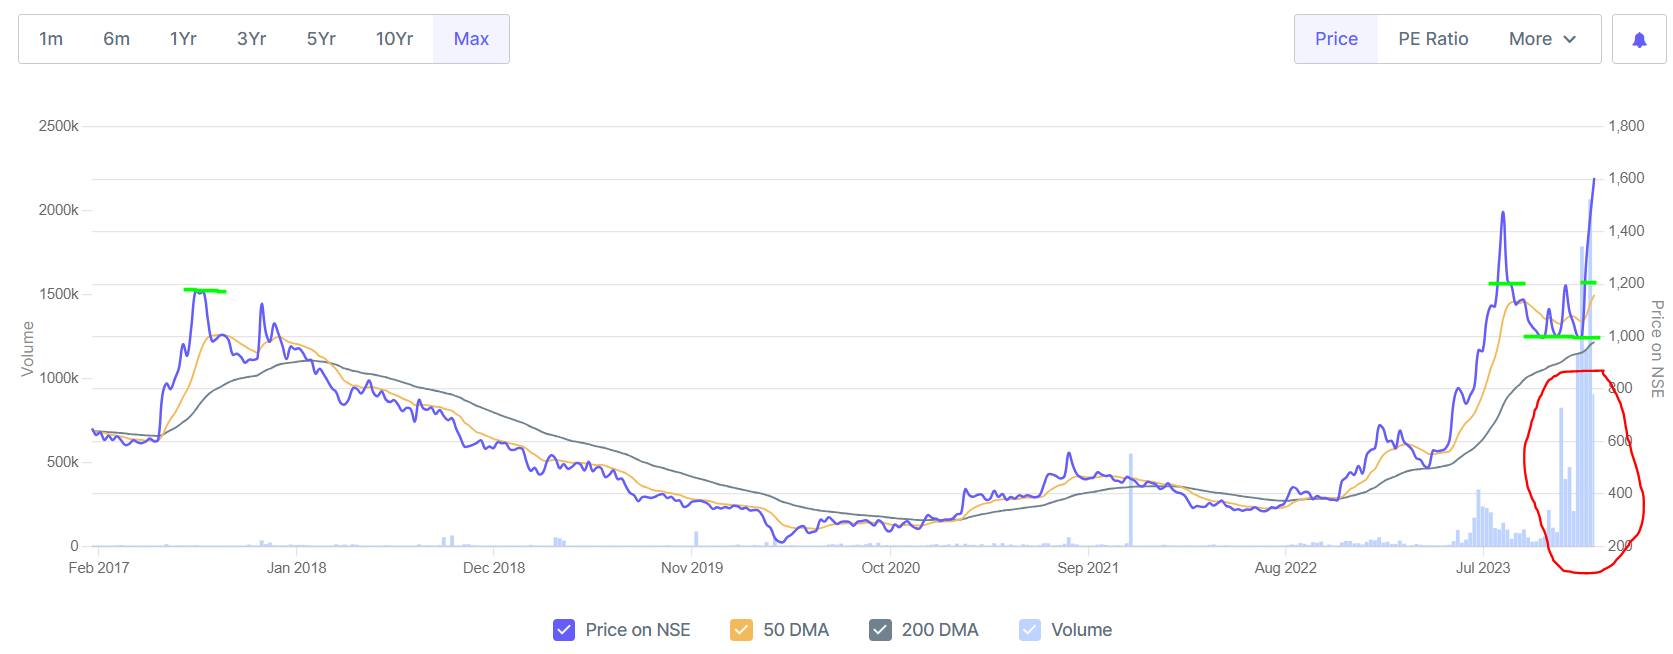
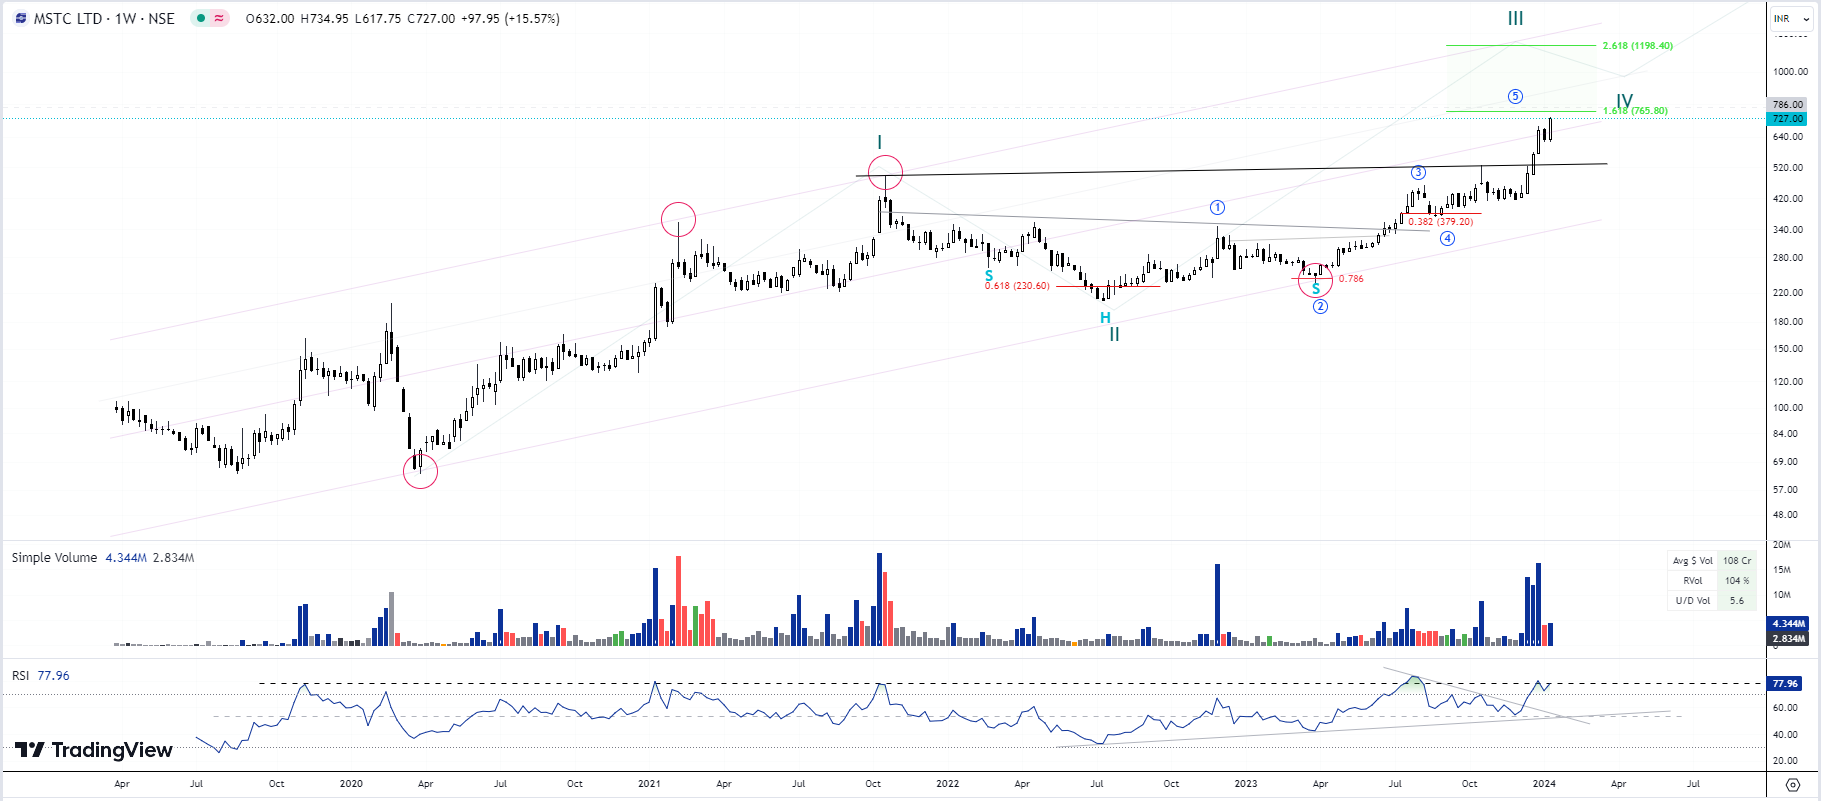
UPDATE: MSTC 316-530-735, a new ATH…
- An excellent base breakout seen in MSTC. Base formed since October 2021.
- A small pennant type pattern seen just before breakout as well.
Approaching Fibo 1.618 levels.
Safe to assume a bullish bias ahead…
7 Likes
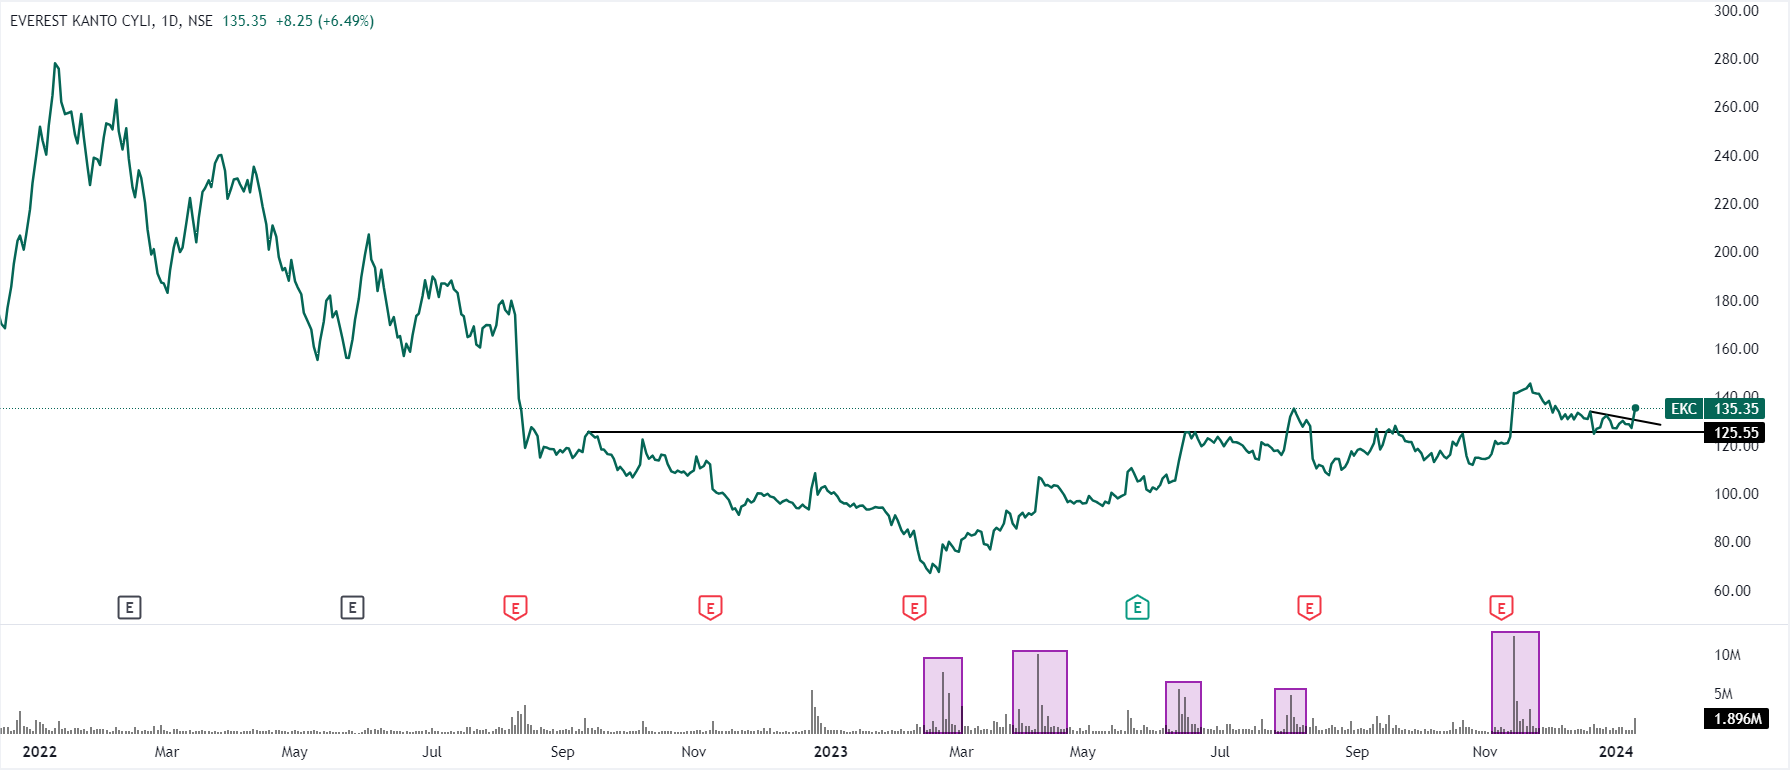
Everest Kanto Cylinder – Stock coming out of a downtrend.
The stock was in a consolidation phase for a long period after trending downwards from 291 to 66.
Stock more than doubled from its low with multiple instances of high volumes/delivery. Stock attempted to break out of the consolidation phase in August 2023 but went back into the consolidation after reacting negatively to June 2023 quarterly earnings.
Stock again broke out in November 2023 on very high delivery (3rd highest delivery since 2011). The current price offers a good risk-reward entry point near the breakout retest level of 125.
3 Likes
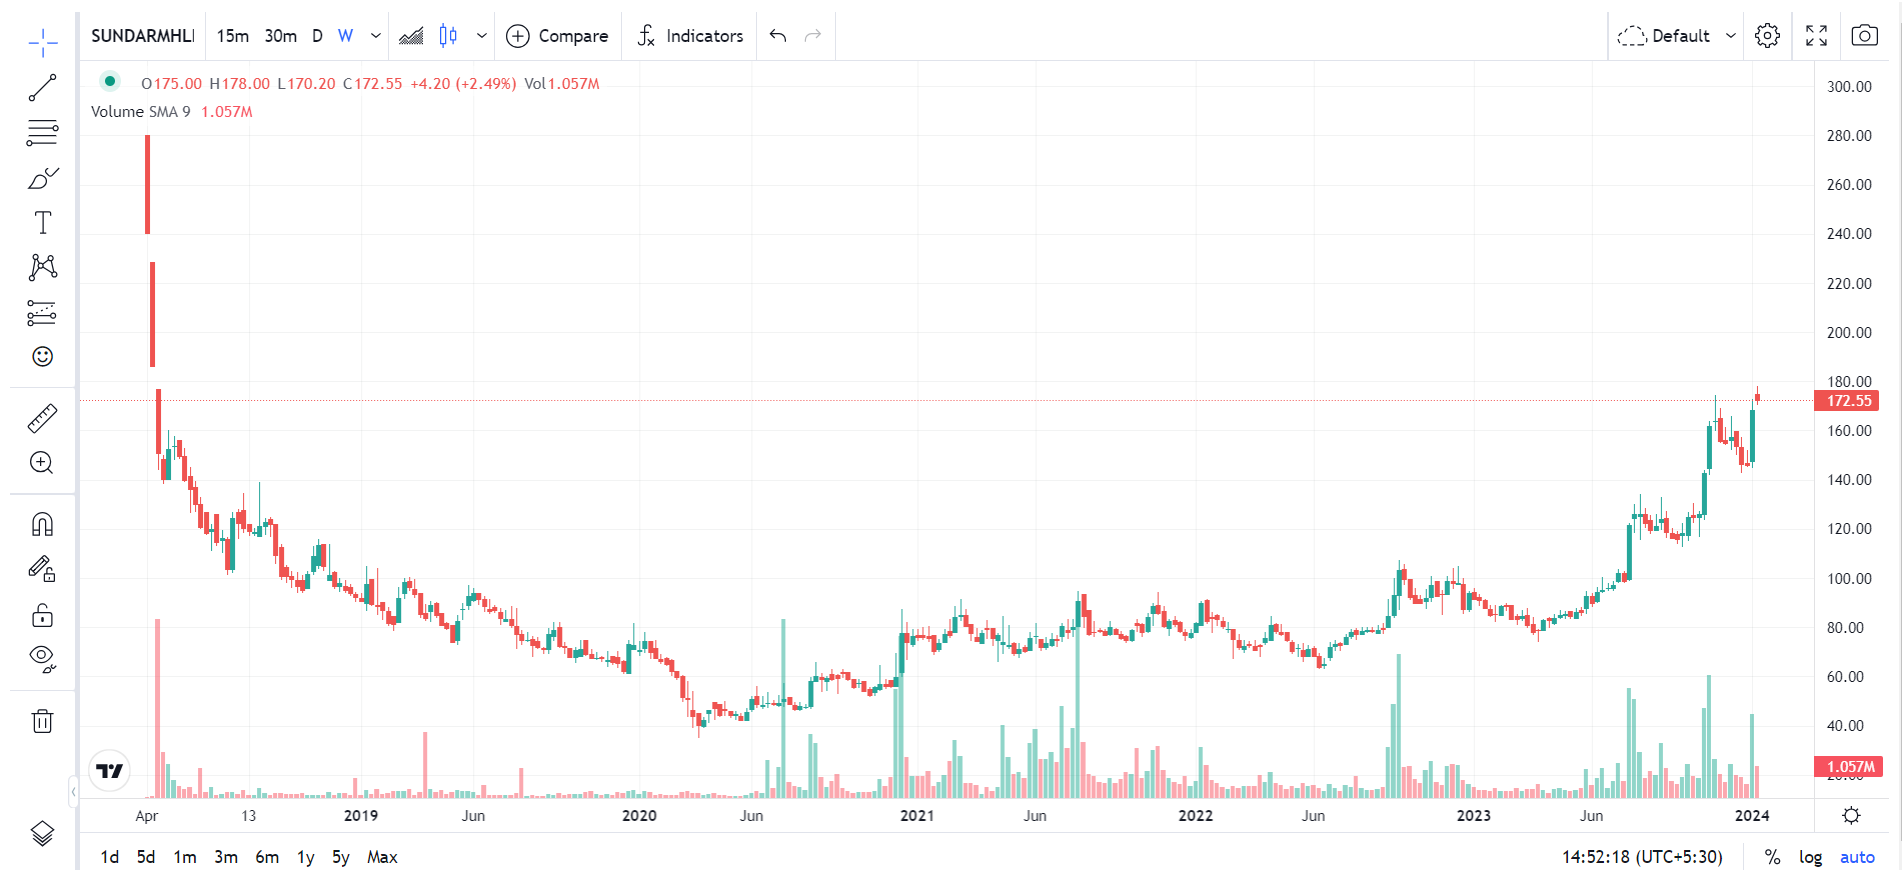
Update : Sundaram Fin Holdings, on a larger time frame as seen in the below chart, the stock has now created a handle to the cup. Previously the stock price hit a 52 week high of 175 on 16th Nov 2023 and today it hit a new 52 week high of 178. The stock price is coming out of a 5 and half year consolidation.
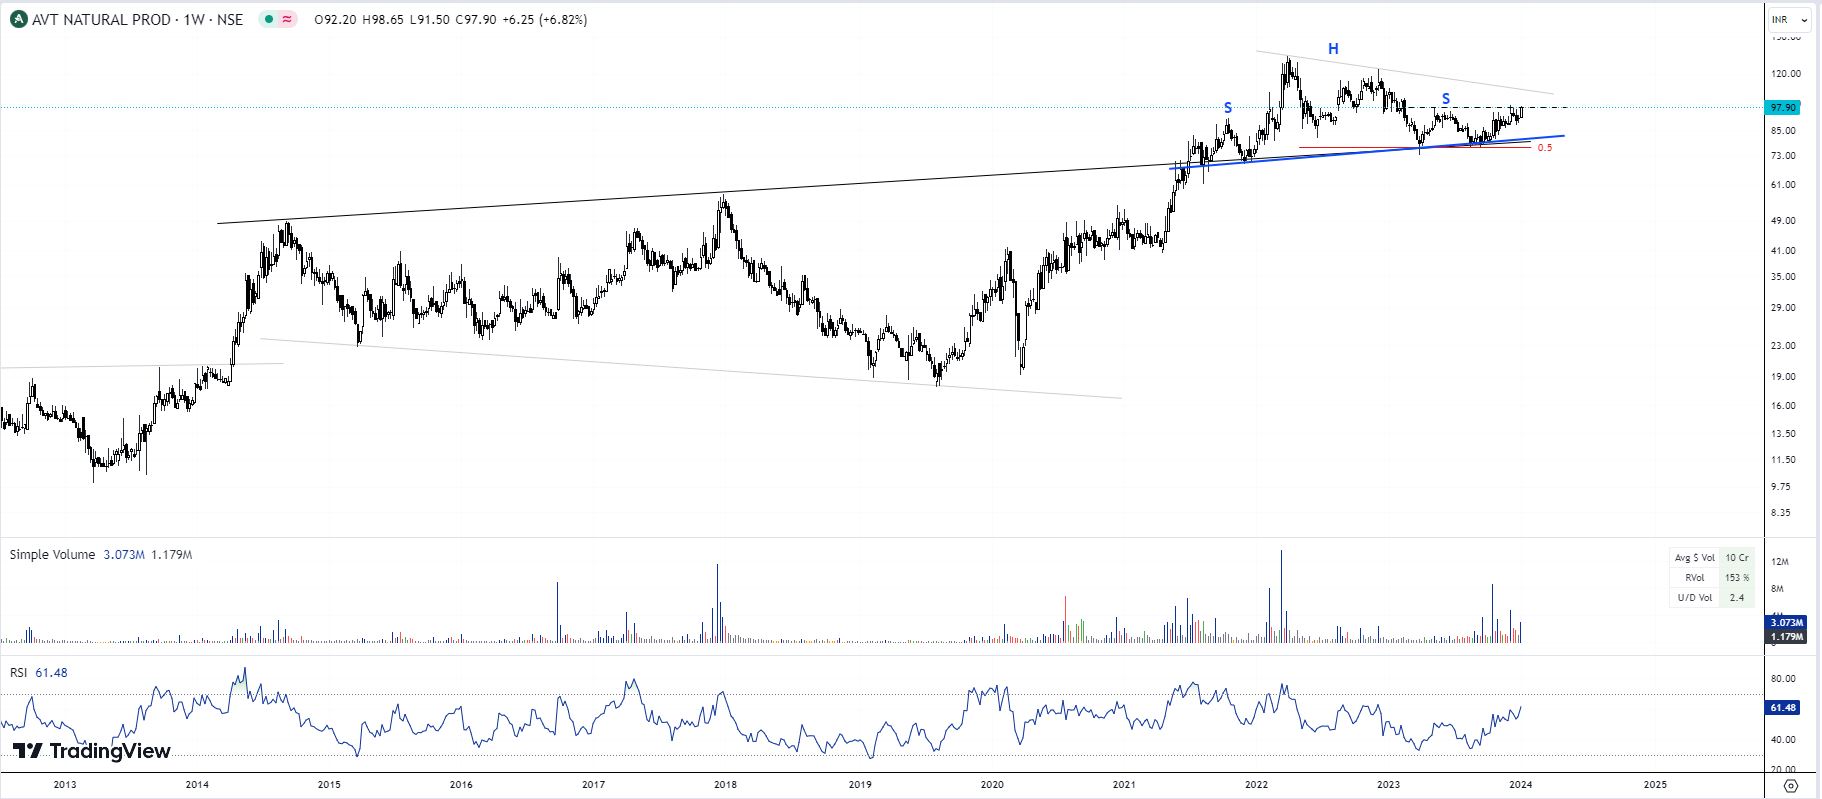
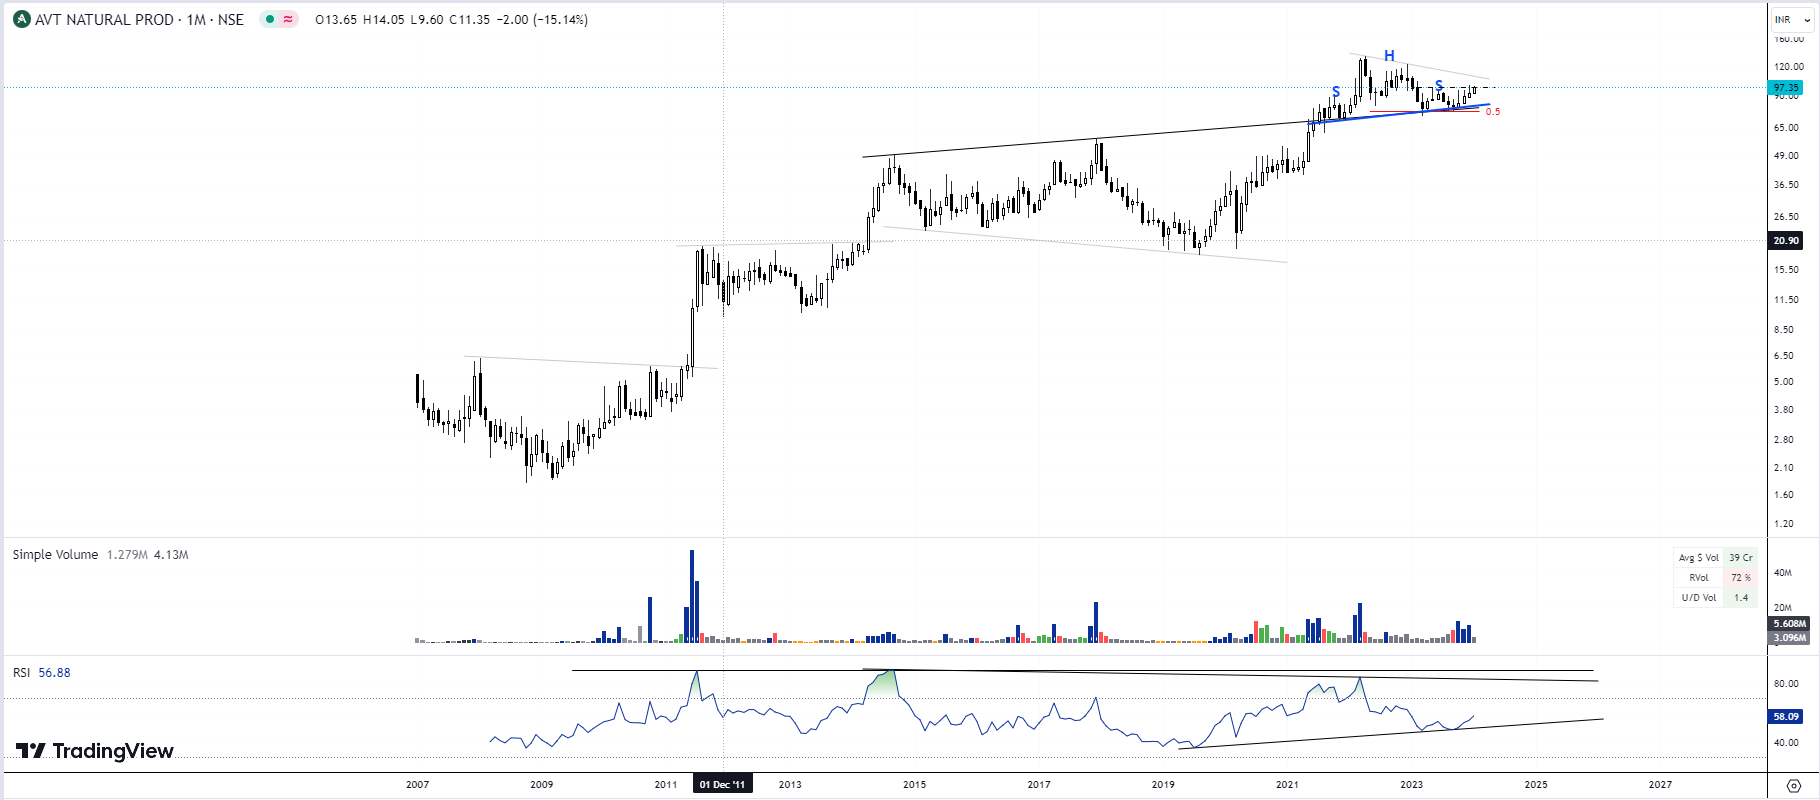
AVT NATURAL: 98
- Forming a bullish reversal setup from a H&S pattern,
- Above right shoulder, bullish bias can be assumed and it becomes a very powerful chart. (can see previous eg. posted my me on this thread).
- Monthly chart, multi year upward slant breakout and retest going on.
- Respecting Fibo 0.5 levels as well.
Weekly chart:
Monthly chart:
4 Likes
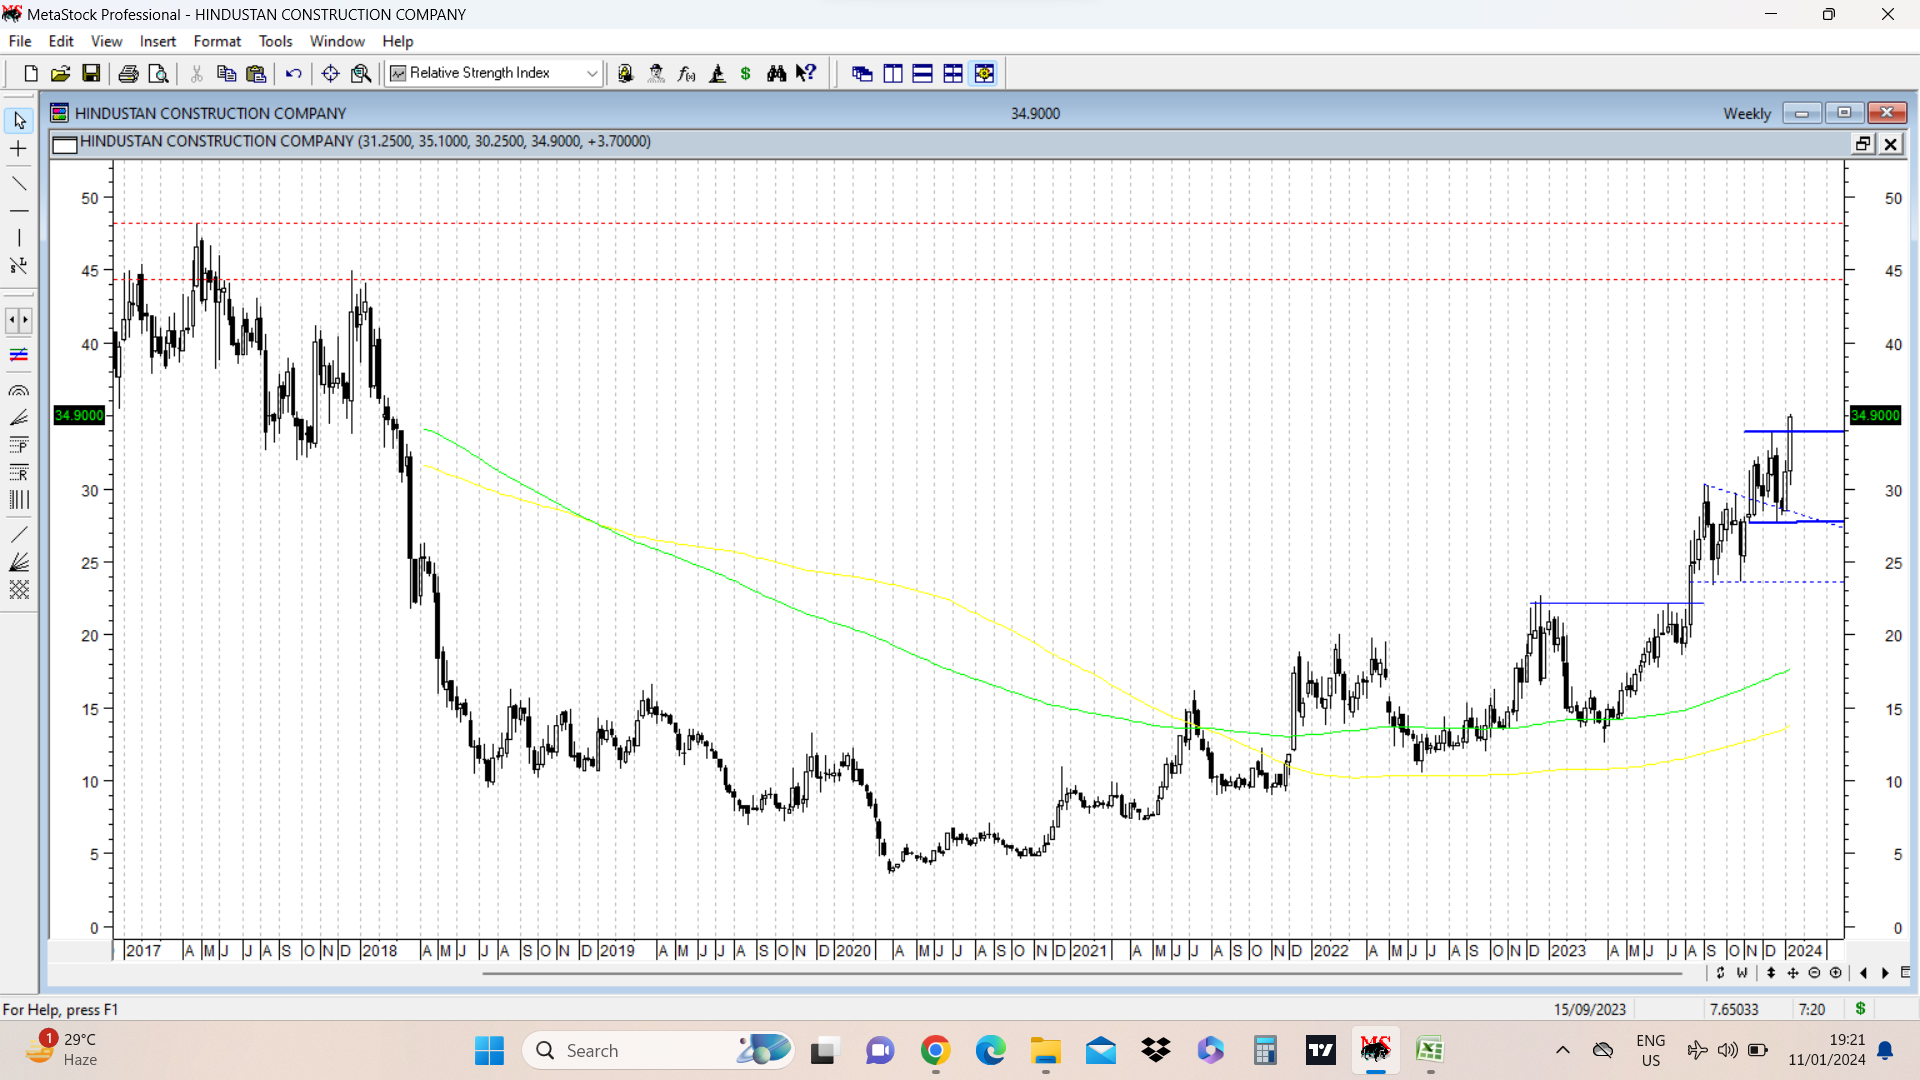
HCC chart update. HCC today gave a breakout with a big bullish candle with big volumes and closed above 34. Previous swing high was 33.85. Attached weekly candlestick chart shows various patterns on the chart.
First is a cup and handle breakout above 23, with potential target of 32, which has duly been achieved.
Next is a triangular consolidation from August to Nov 2023 from which stock price broke out and posted above mentioned swing high of 33.85 and went into consolidation.
It formed a double bottom between 27.70 and 33.85 as marked by solid blue lines on right side of chart. Potential target for this double bottom is at 40.
And finally a nice rounding bottom formation with a high on left side of chart at 48. Two important resistances ( previous top regions) are marked in dotted blue lines at 44 and 48.
This is a typical turnaround stock with regular doses of newsflow to which the stock price reacts and then goes into consolidation. Another aspect of the movement of this stock at current juncture is that since it still remains in the formation of a rounding structure (confirmation on breakout above 48) the trend is often fragile and there are lots of consolidations on way up. Usually when the trend becomes very strong, (usually after key resistances are crossed) parabolic type of moves begin.
Currently stock price has come out of two back to back consolidations in form of triangular consolidation and double bottom consolidation. Another aspect of this type of company is that it tends to get punished severely in market corrections. So one has to play it accordingly and if buying is done after breakouts, it has to be done with strict discipline and strict stop losses.
disc: invested as disclosed before. no trades in last month.
21 Likes
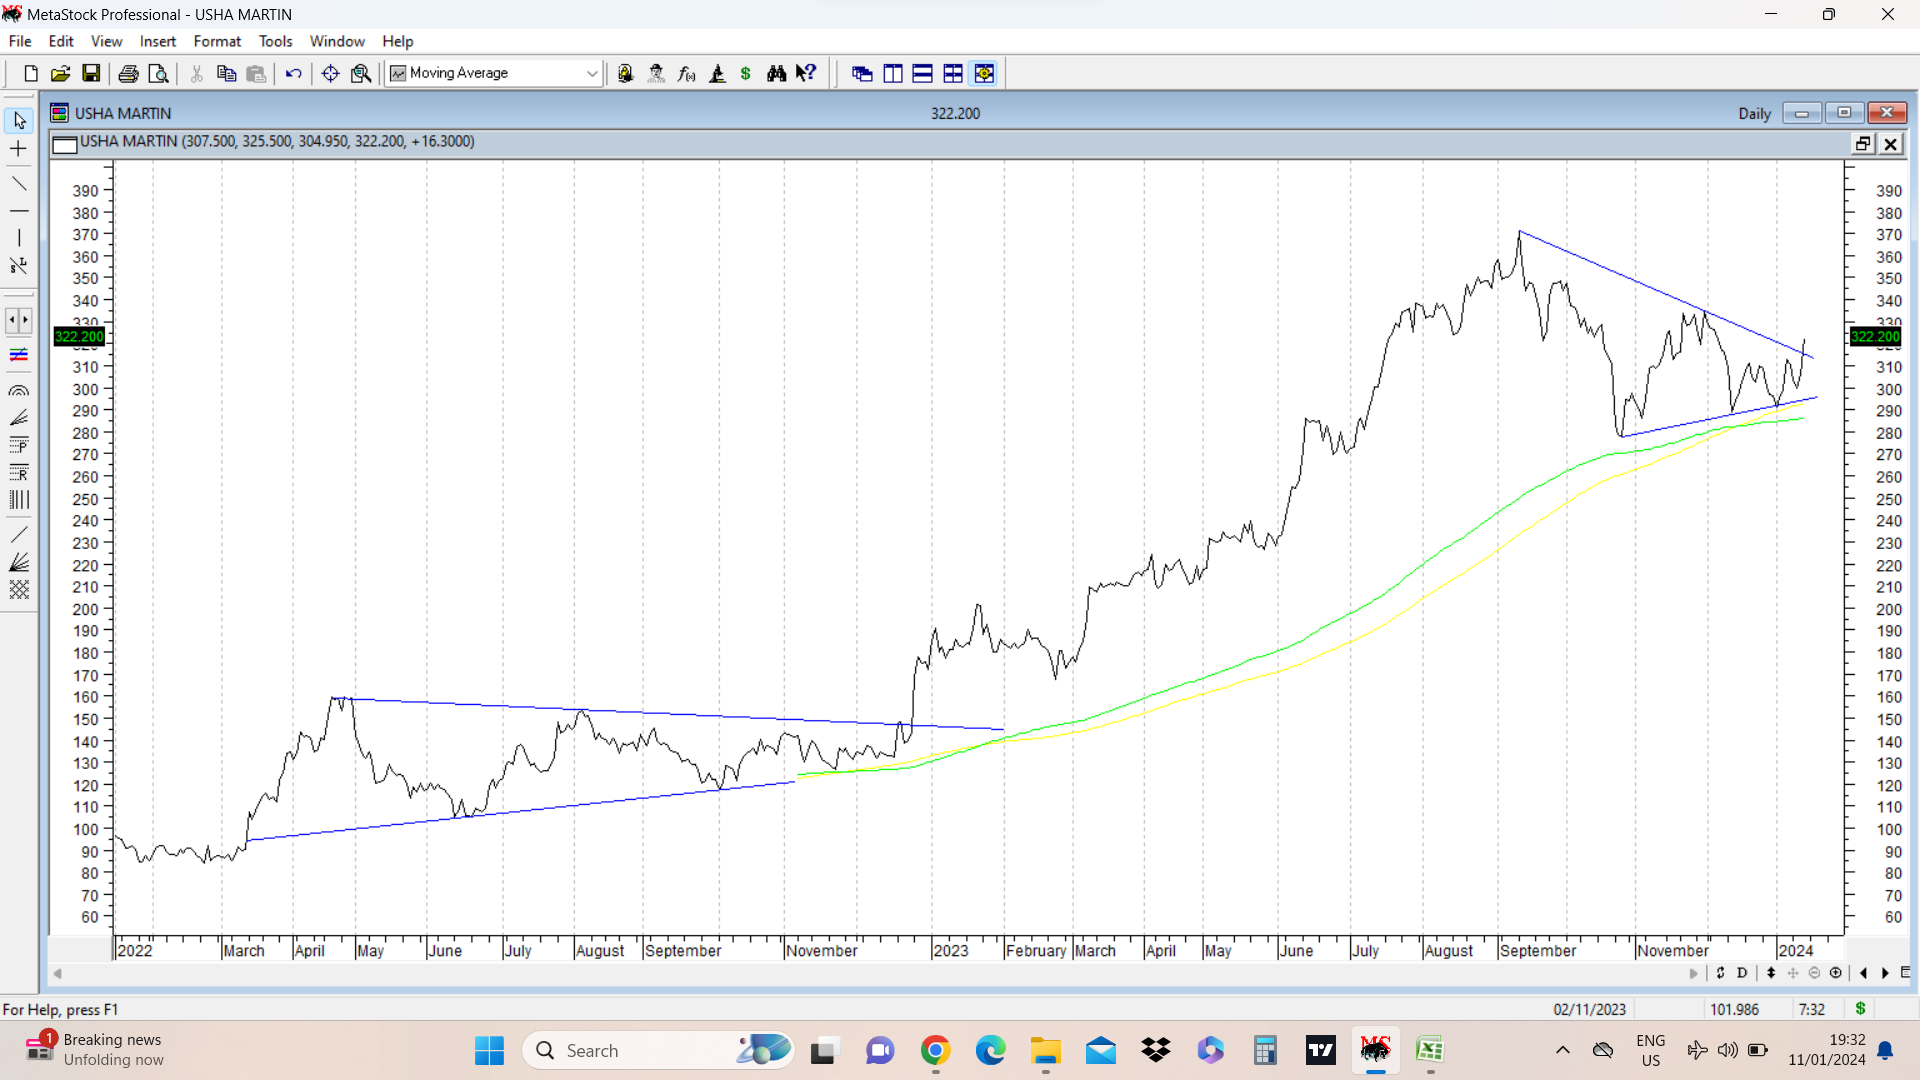
Usha Martin chart update.
Stock price has been in a prolonged consolidation since Sep 2023 and this has taken the shape of a triangular consolidation. The daily line chart put below shows a breakout from a triangular consolidation. It’s also worth noting that this whole consolidation took place at or above its 200 dema.
Also marked on the chart is a previous triangular consolidation which lasted nearly 9 months and which was followed by a sharp rally. Current consolidation has taken more than 3 months before breakout happened.
The hallmark of triangular consolidations is that for anyone holding stock during these phases, its a period of intense frustration and often loss of faith. I have been in this stock during both these triangular consolidations and it is only the faith in the fundamentals of the company which has comforted me during this period. And inspite of all this it is worth noting that during the past 12 months the stock price has appreciated by nearly 80% which is not bad.
37 Likes
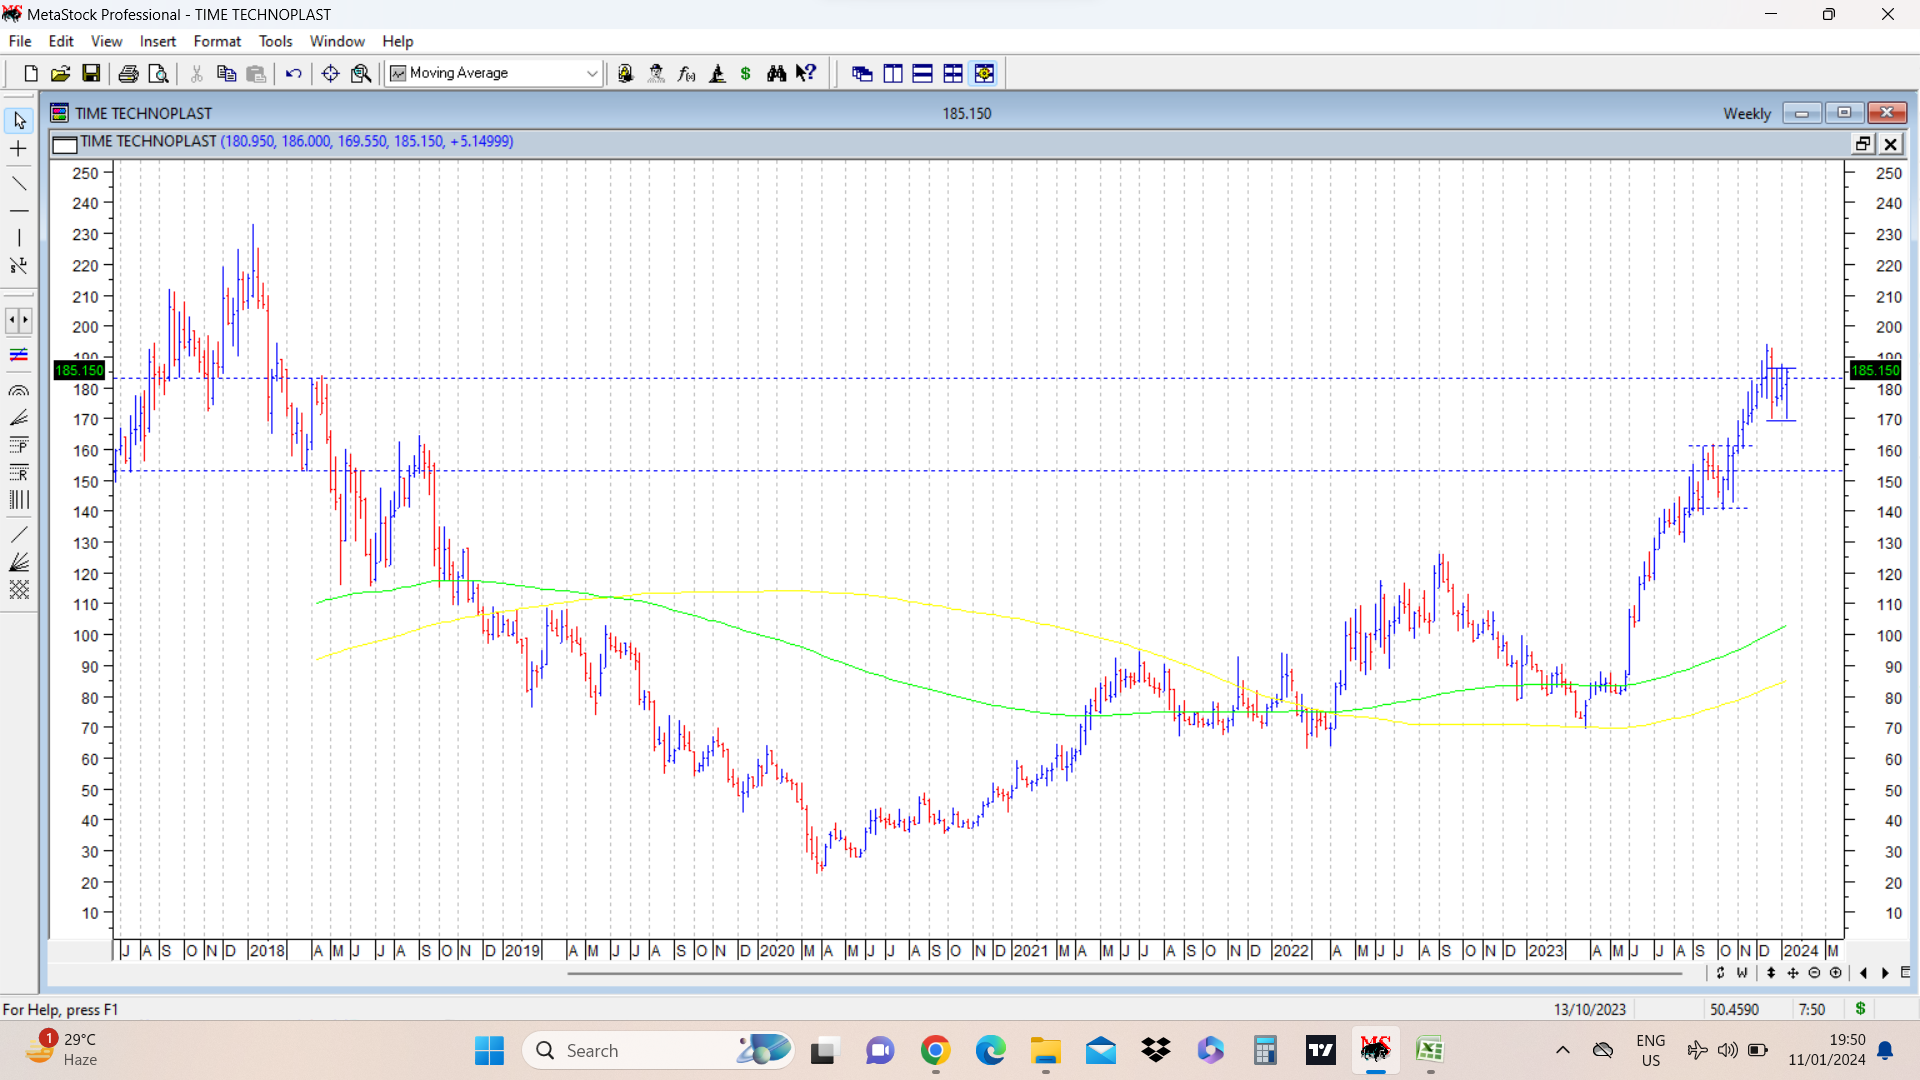
Time techno Ltd. cmp 185. Stock price today gave a sharp upmove after a shakeout move yesterday wherein a low of 169.55 was posted. This caused a double bottom formation at around 169 and the high between the two double bottoms is at 187.55. If stock price crosses above 187.55 and closes above it, a double bottom confirmation target would be at 203 .
Now coming to an observation of mine related to past movements of the stock price. During Feb 2018 to Sep 2018, when stock price was at the beginning of its major decline, ( in line with sharp correction in small and midcap spaces) the range between 154 to 184 on left side of chart (marked in dotted blue lines ) acted as a consolidation range before stock price broke down. Stock price then went down and posted double bottom at 115 and bounced back to post high of 164 ( weak pullback) before it went down again in a major decline. Now this shows the area where bulls and bears had a lot of fight lasting nearly 7 months and was a sort of battle ground where range was established, breakdown happened and a pullback materialised but failed within the range.
On the way up we have been observing a lot of action in the same range where we had first a tight consolidation between 140-160 for nearly 10 weeks and then broke out posted a swing high of 194 and stock price again went into consolidation within a range of 170-188 for nearly 4 weeks. Breakout from this range will happen once stock price closes above 188. Till now on way up we have had two tight range consolidations. This is often necessary to prepare a launchpad for a strong move. ( not saying that an upmove is a given, but can happen)
This is an observation that previous consolidation zones during downtrends will act as tough areas to negotiate during subsequent upmoves. Real strength in this stock will be seen once it crosses its previous all time high of 232. ( Usually these resistances are never a definite number but a broad range within a price band)
27 Likes
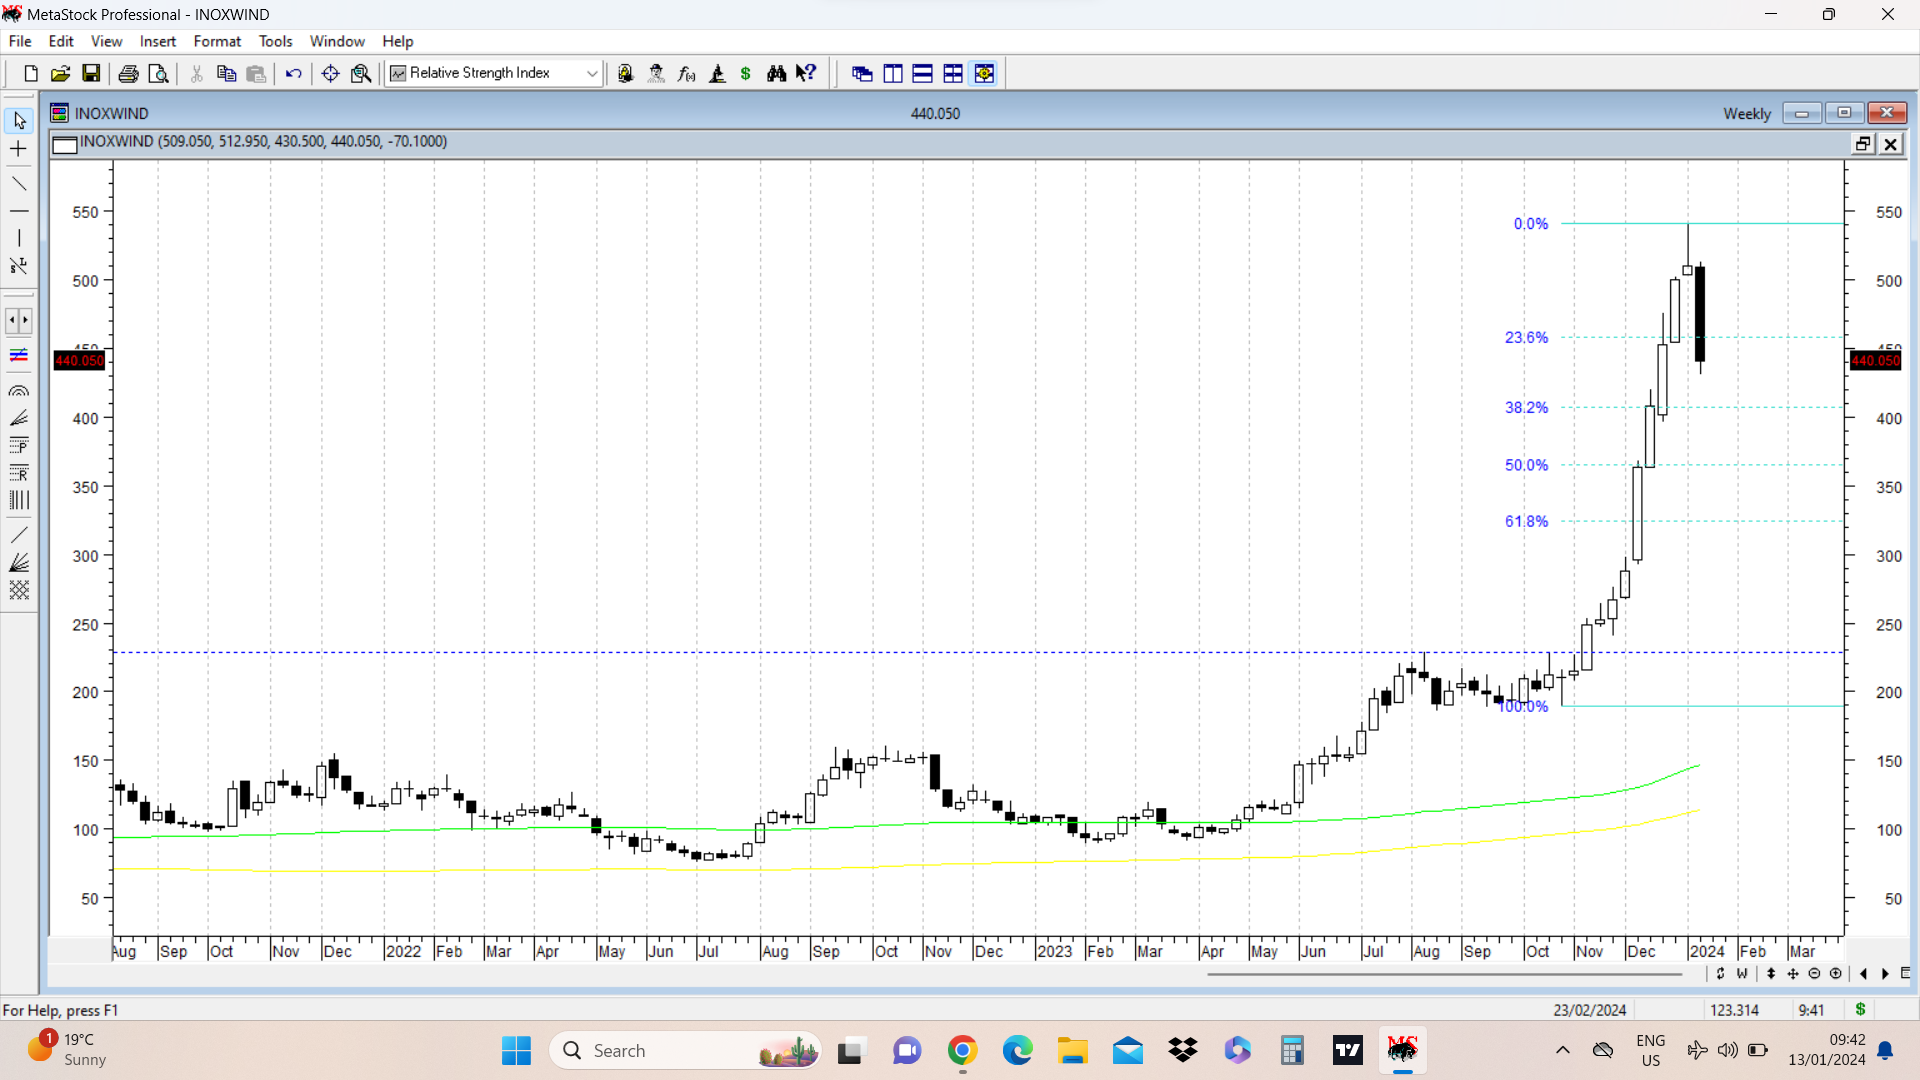
Inox wind chart put up shows an evening star candlestick on weekly charts. This pattern consists of 3 candles wherein first candle is a bullish candle, second candle has a smallish body ( nearly a doji preferably with large upper wick) and third candle is a big bearish candle whose body covers the body of the first candle. I have also put up Fibonacci retracement levels to watch out for in the future for possible supports.
Inox wind had a breathtaking rally from levels of 200-220, especially after it took out a 7 year high resistance of 229 in Nov 2023. The stock price raced to post a high of 540 in Jan 2024 and posted a near 2.5 times upmove from levels of 200-210 within 2 months. This is typical of a parabolic move.
The psychology surrounding this move is that in the initial phase there is strong sectoral chatter ( tailwinds is the real deal, but the chatter is where everyone extrapolates order books into future revenues, unmindful of any hiccups the company might suffer) , lots of newsflow/rumours related to the sectoral opportunities, very high visibility of company representatives ( CEO, MD, promoters any or all of these) on TV channels and interviews in magazines promising very rosy picture. All this happens well before actual numbers are reported. And the stock price takes off only on narrative. Before the actual earnings are reported, the best upmove in the stock price is already done. Future stock price movement will depend on the actual numbers that will be reported in the future but a lot of future positives will already have been captured in the upmove. (for anyone wanting to do a self study kind of comparative study, look at the chart of Som distilleries. Stock price posted a rally of nearly 3.5 times from Jan-Feb 2023 to Oct 2023 a six month period where the story was of capacity expansion, product approvals and launches in various states, lots of newsflow, TV fanfare etc and then a slew of bad news including an income tax raid leading to a major correction in price. And the company still manages to post decent results, management is very bullish in commentary, announcements related to company’s launch of products in various states continues and still stock price does not go anywhere. )
Usually during such strong upmoves within a short period of time as seen in Inox wind, Som distilleries etc, everyone who is bullish, or turning bullish on the stock has joined the bandwagon, unmindful of the valuations. Smart money knows where to exit and do exit at right time. Rest of the crowd gets caught up in the narrative and is not able to exit in time. So even if the numbers keep coming, stock price remains lackluster till all the froth is removed from the counter. And if still company continues to perform well, in future another upmove can begin. ( We saw such upmove in Neuland labs, where after a crazy upmove to around 2800 levels stock price collapsed to around 1200 and then again rallied hard on the back of better than expected earnings)
disc: no holding. posted only for academic purposes to demonstrate frothy upmoves in a stock, which can be a reminder for future such situations.
62 Likes