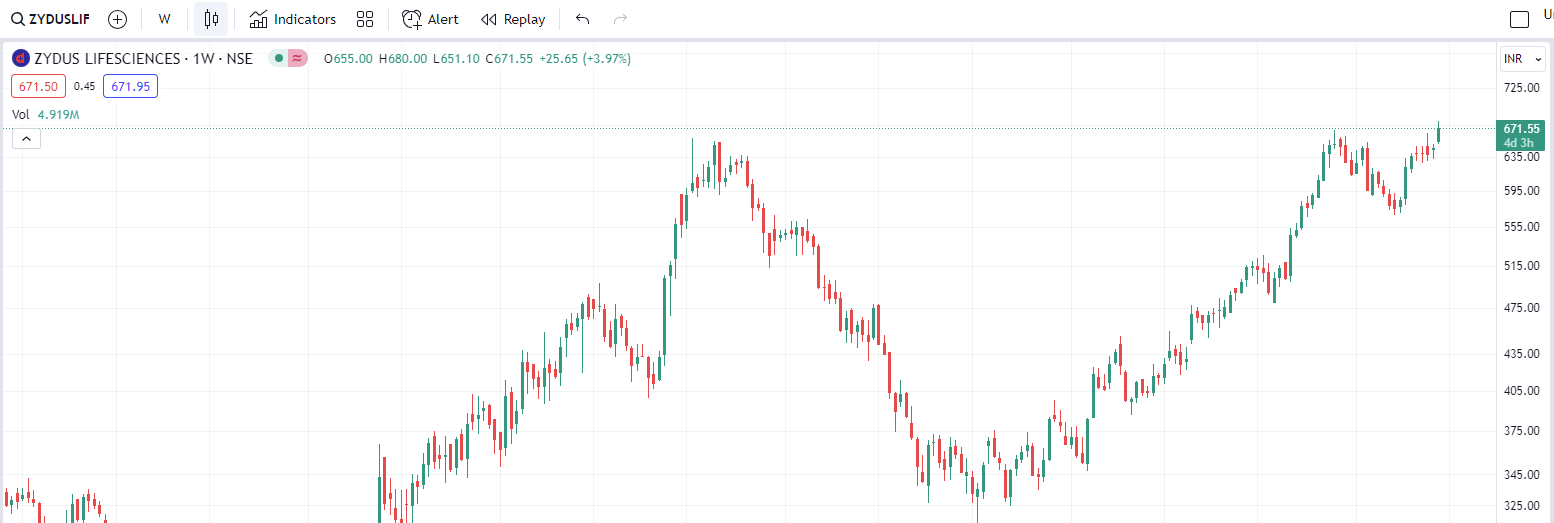
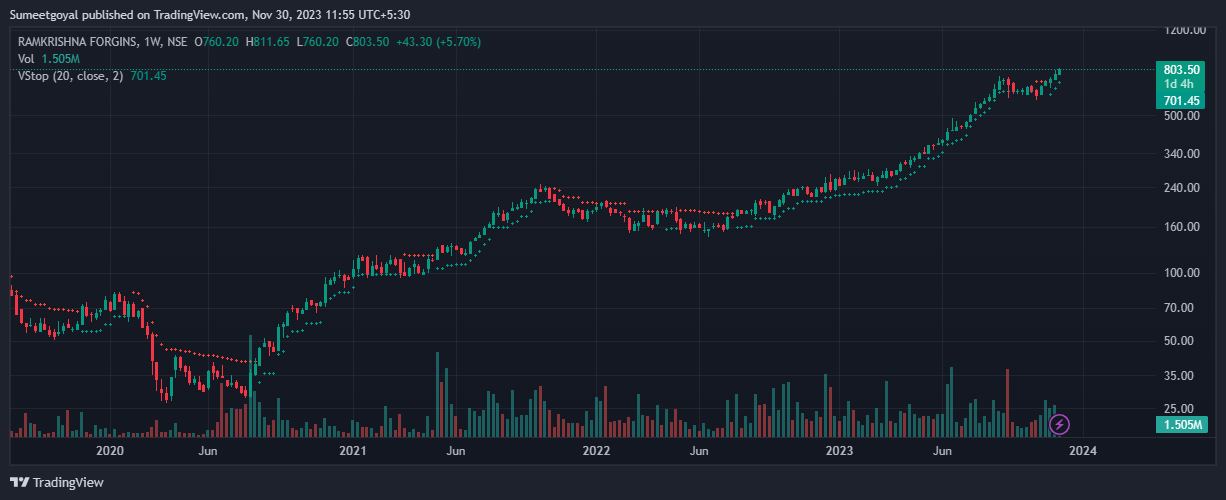
Ramkrishna Forging weekly chart
The upmove has resumed after 8-9 weeks of consolidation
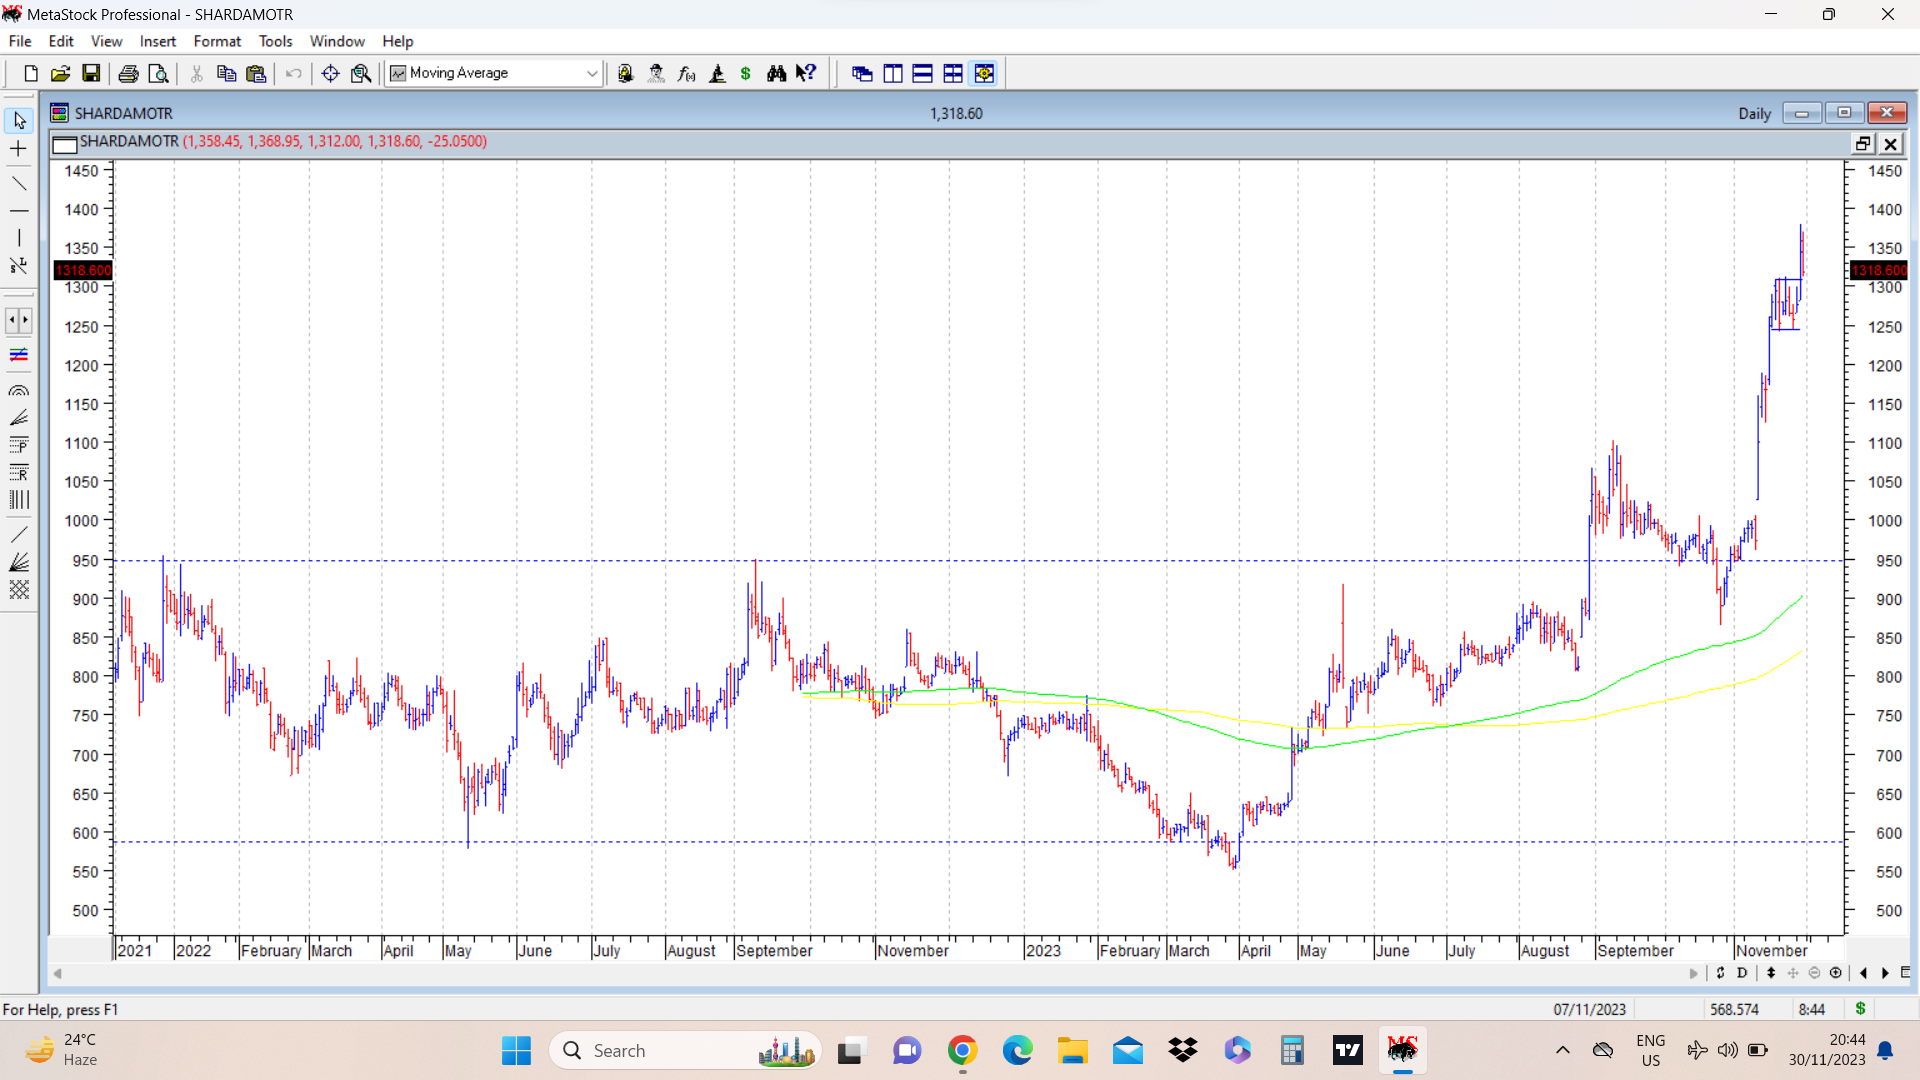
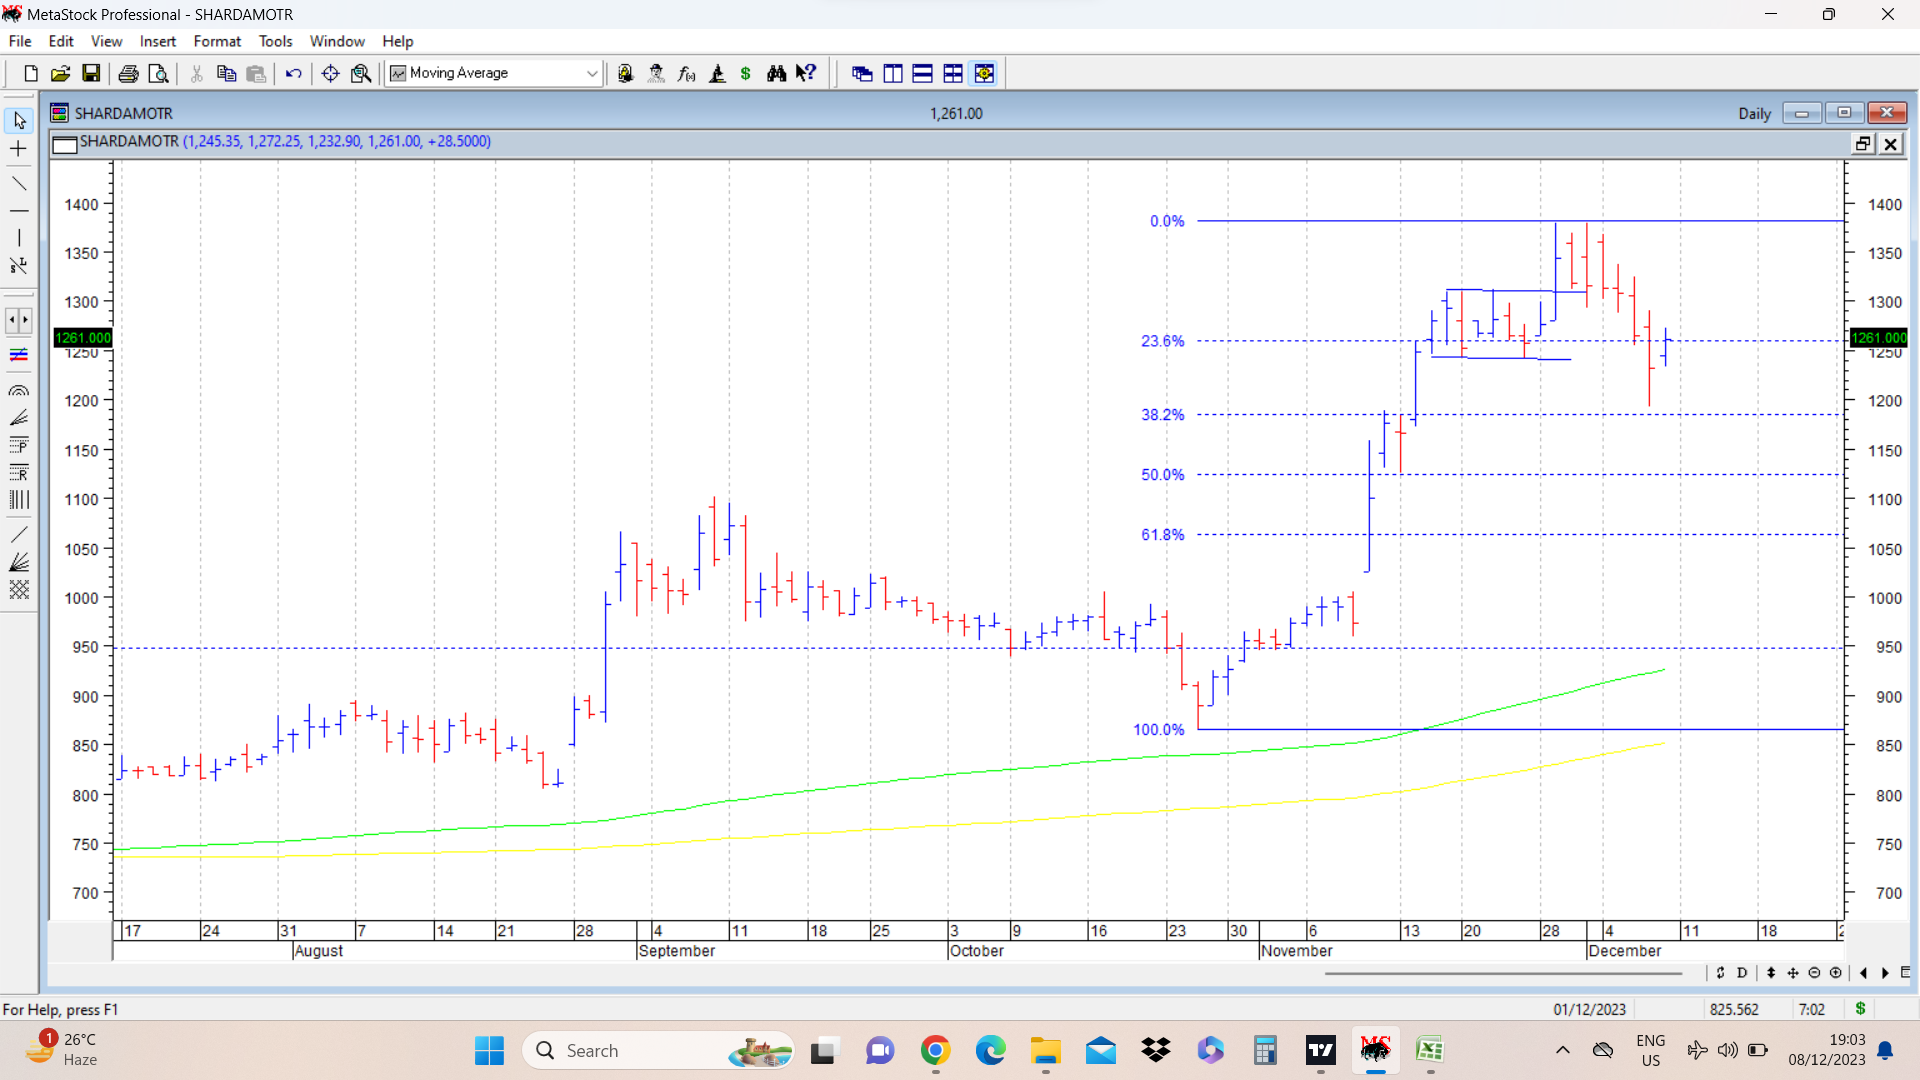
Sharda Motors update. After the q2 results we have seen a strong rally in Sharda Motors stock price. Since past few days stock price was consolidating within a tight price range of 1242-1310 and yesterday gave a big volume breakout and posted a fresh all time high of 1378. Today it came down with much lower volumes and closed at 1318. The whole structure on daily charts resembles a flag pattern breakout and now a retest seems to be on the cards.
Flagpole extends from 960 to 1310 which is a distance of 350 Rs. Adding that to the breakout point of 1300 provides a pattern target ( if the pattern plays out) of 1650. Need to see how this plays out. disc: invested as disclosed earlier.
26 Likes
Update: EXIDEINDS 199-294
- Excellent reversal seen in monthly chart. H&S reversals lead to strong bullish upmoves as seen by previous examples post by me.
- currently making a ATH after topping out in August 2018. Big multi year breakout happening.
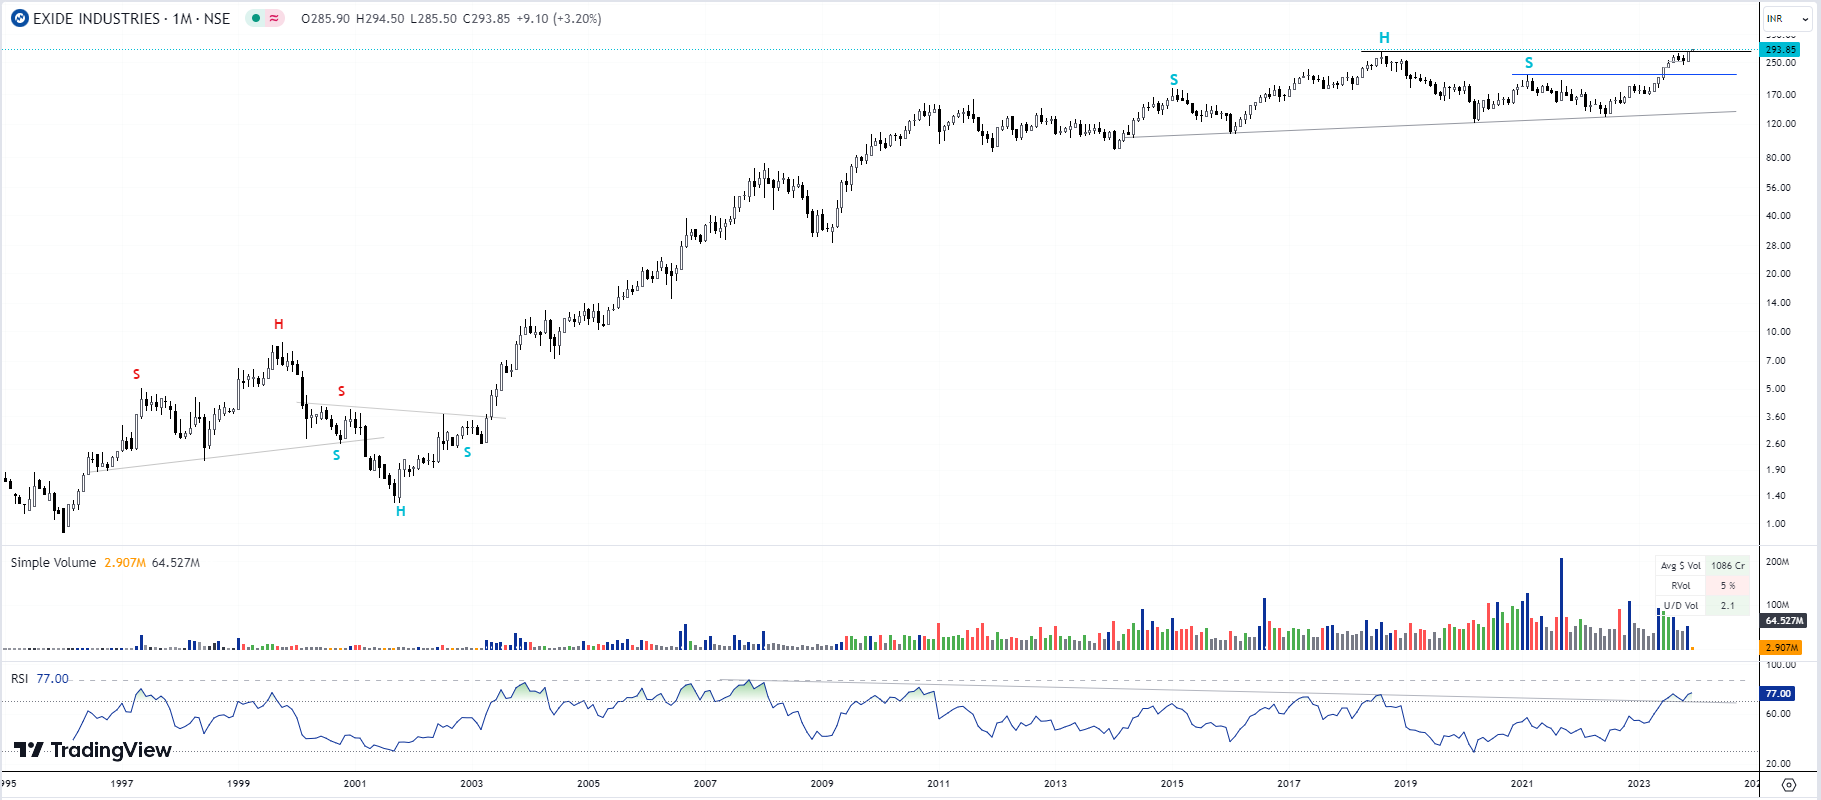
- Daily Chart one can see another H&S reversal that has taken place after a shakeout.
- Currently price above Right shoulder
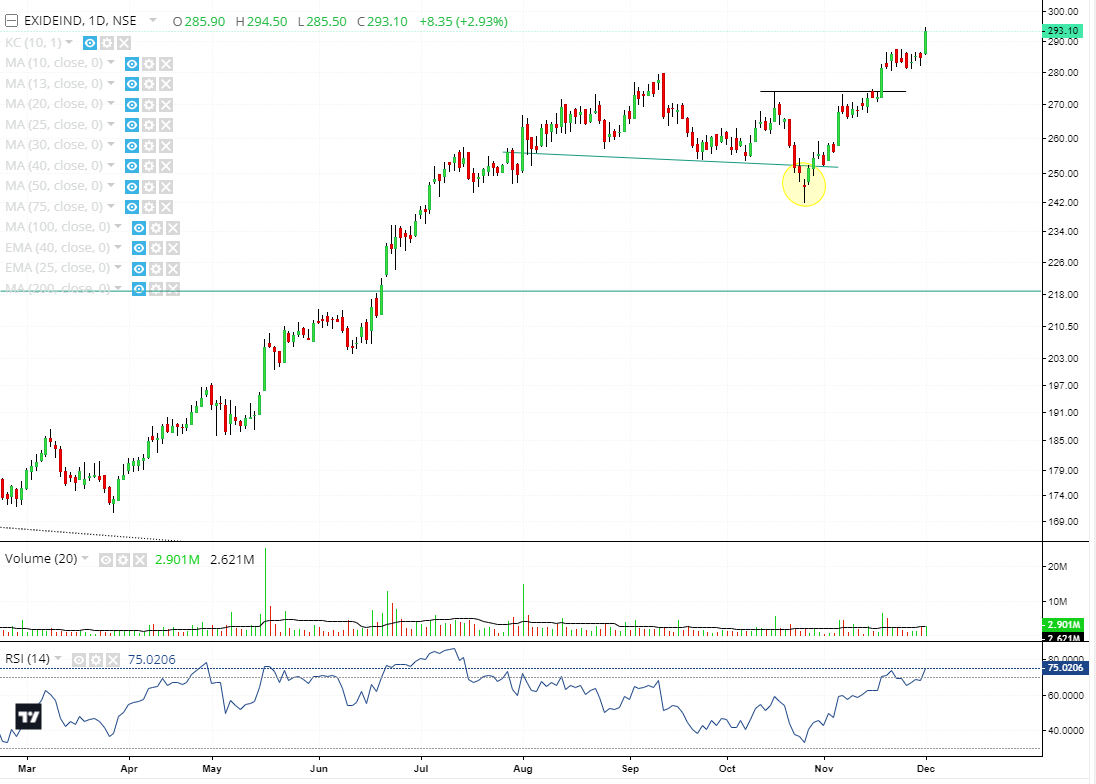
Safe to assume bullish bias ahead.
8 Likes
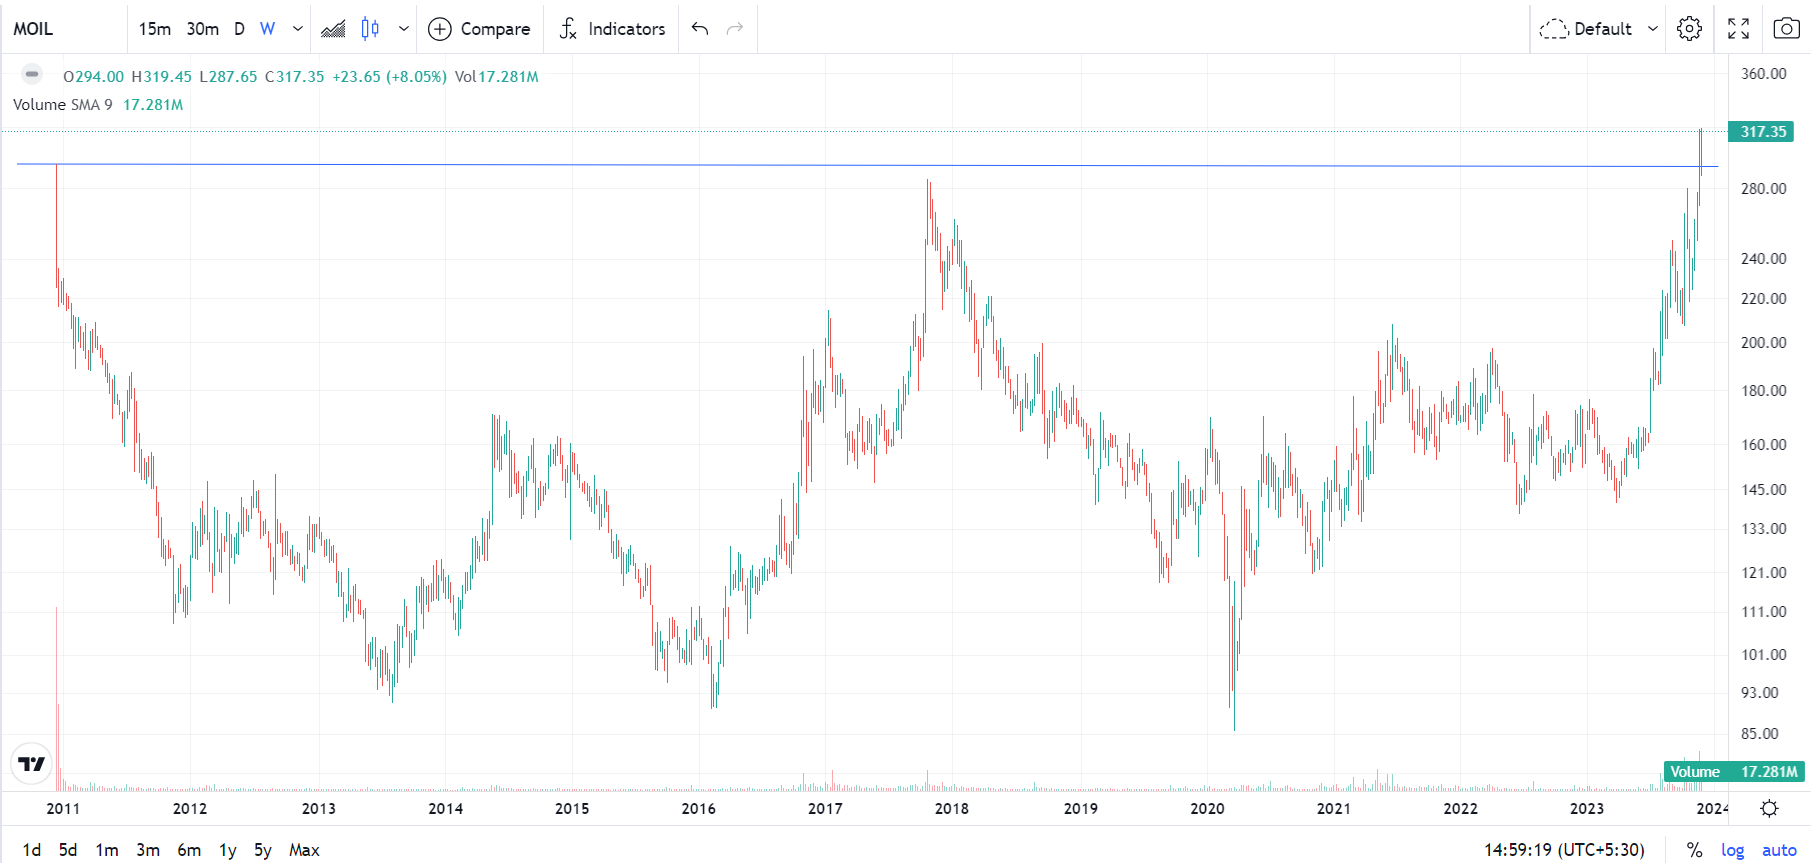
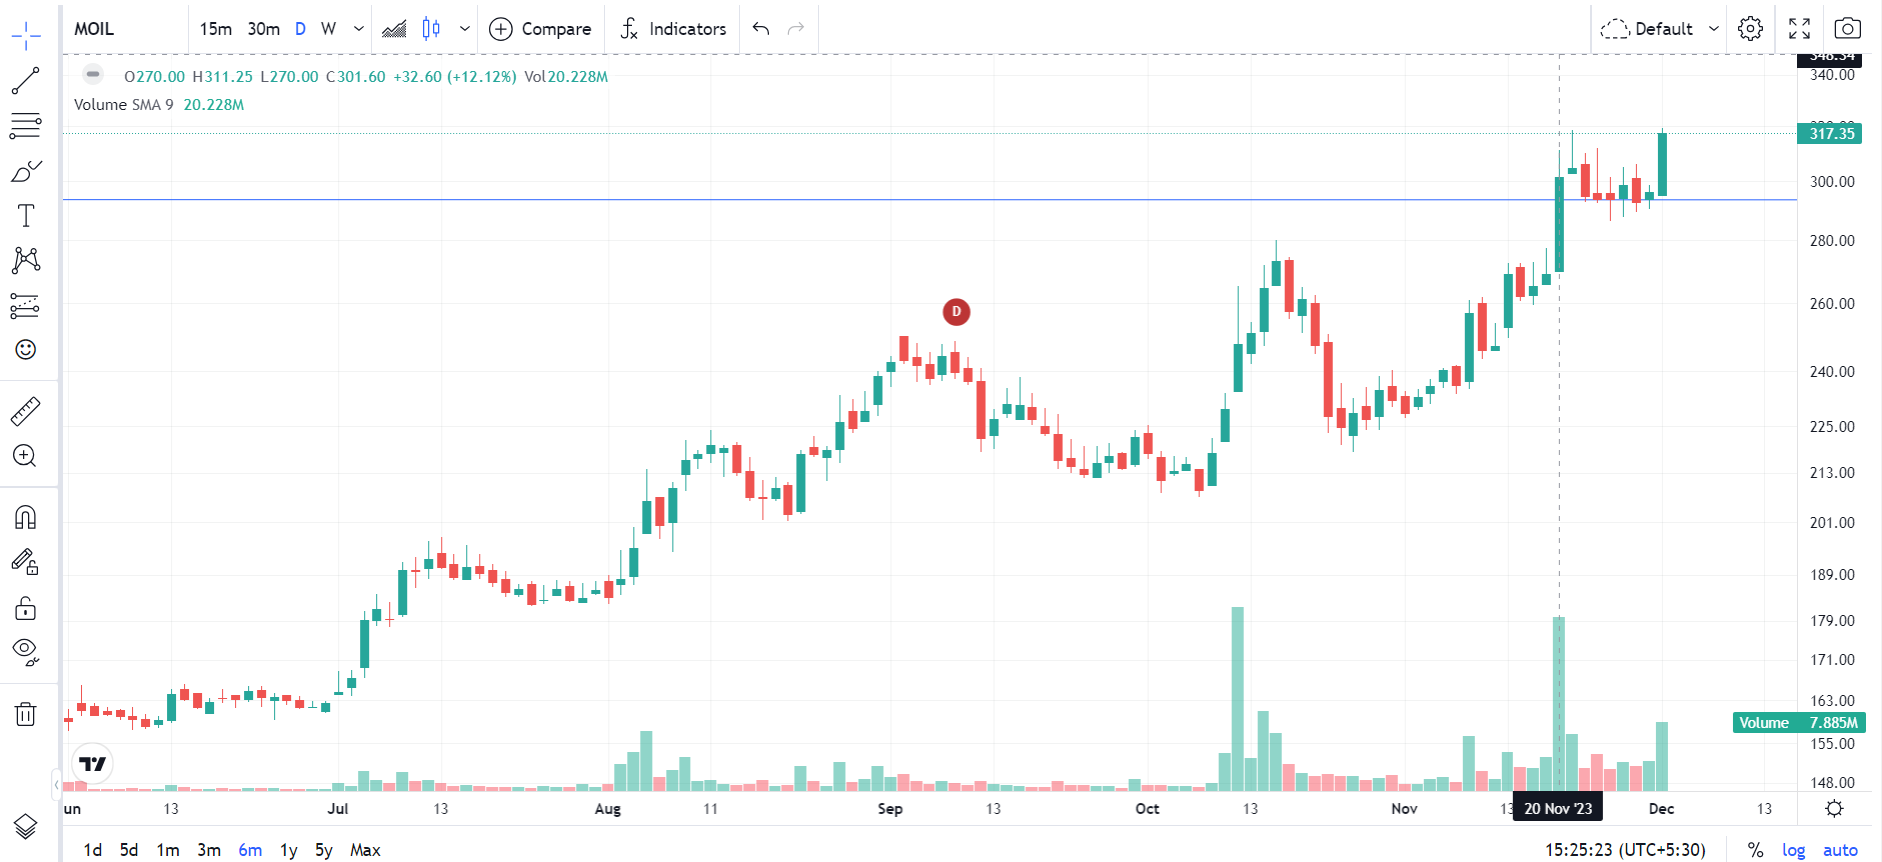
MOIL Ltd - CMP 317 (Update)
MOIL’s previous Life time high was 295 rs (adjusted for bonus) on its IPO listing date back on 15 Dec, 2010 which the stock had managed to clear on 20th Nov 2023 after almost 13 years and consolidated for a week. On Friday Dec 01 2023 the stock price again reclaimed the All time high mark and gave a comfortable close above that price with good volumes.
Fundamentally the Monthly production update will be announced by the company in the coming week.
Disclosure : Same as earlier
2 Likes
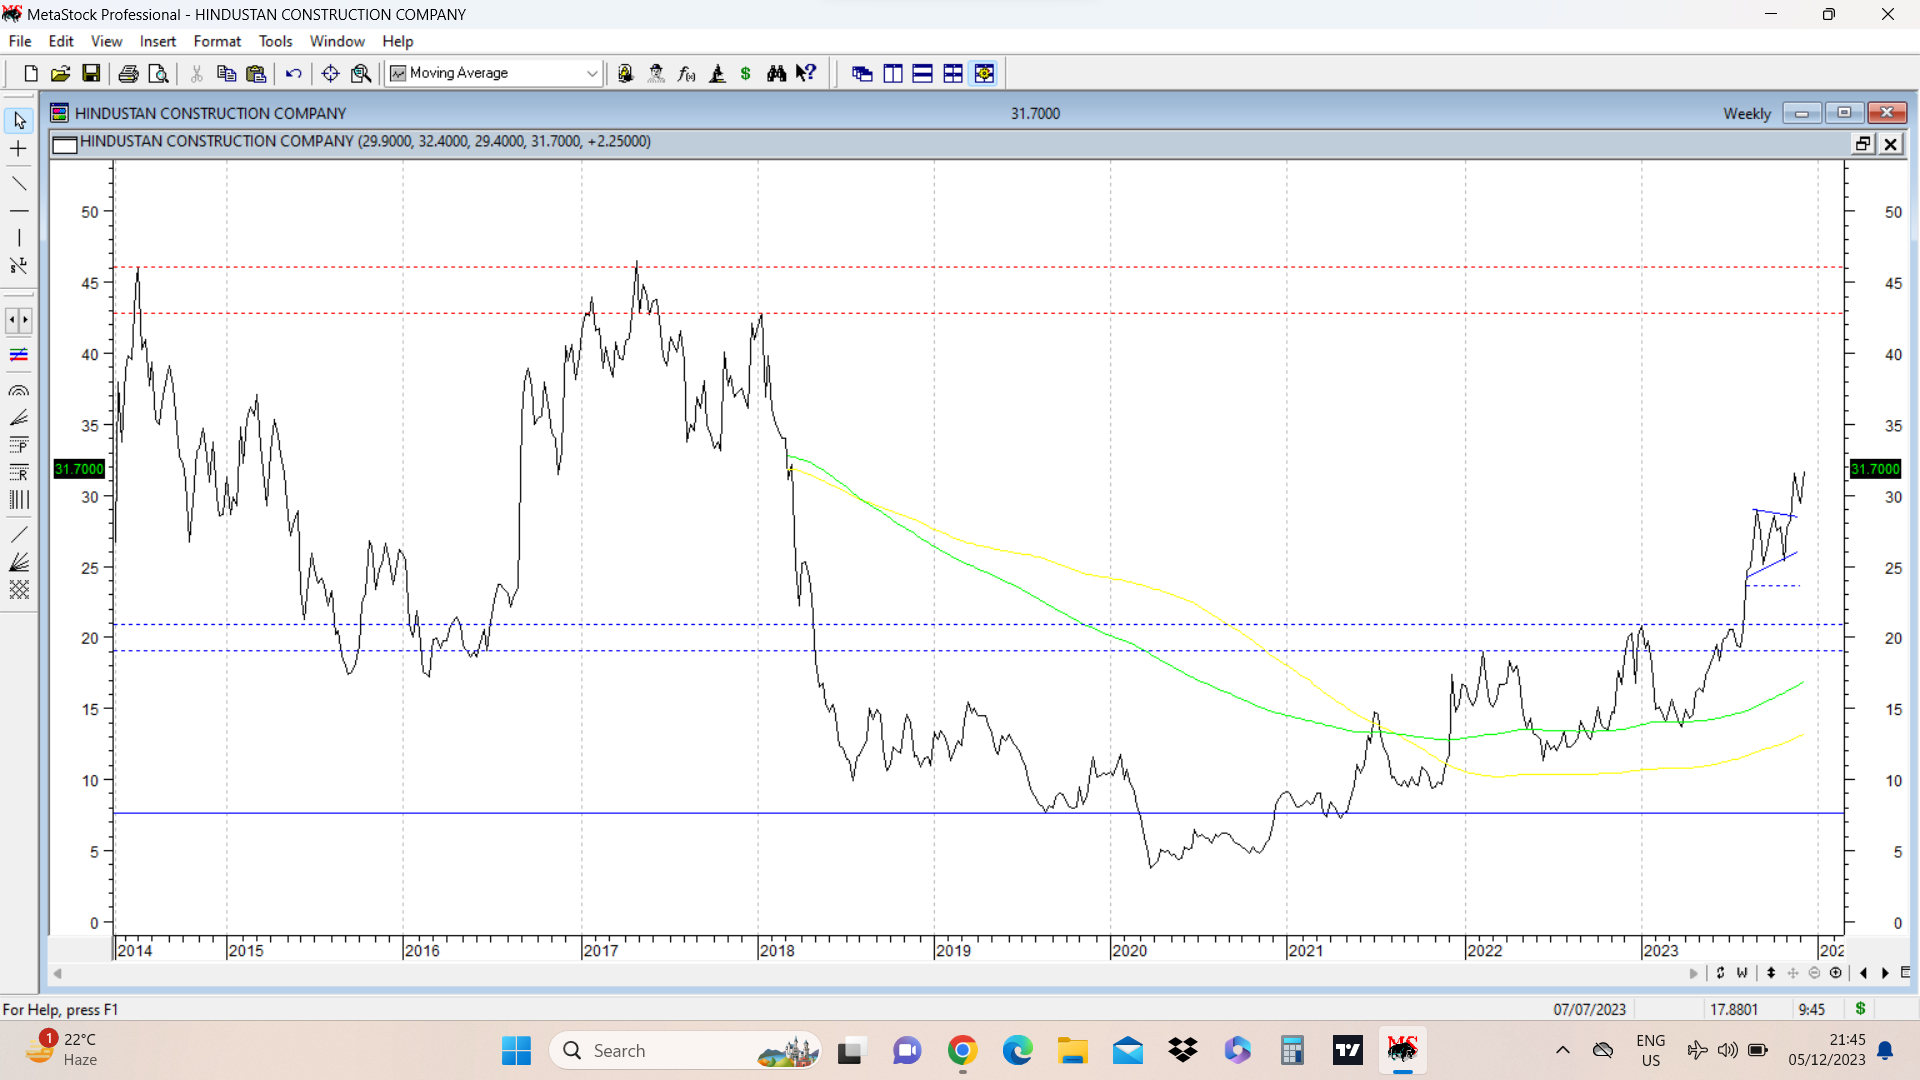
HCC update. Today company made an announcement related to stake sale in its Swiss subsidiary Steiner AG for a consideration of 928 crores. (including debt and liabilities) This was hinted by the management in its last concall and management is walking the talk on that front.
Based on this newsflow stock price rallied and closed strong with 7 % gains. If we see some follow through buying and the flaglike pattern marked on charts plays out then potential technical target is close to 39-40. Also note the rounding nature of the whole structure with tops in region of 43 and 46. disc: invested as disclosed earlier.
11 Likes
Time techno update. Stock price today broke out above its recent overhead resistance at 180-182 and managed to close above 184. It surpassed its highs posted in April 2018 of 183.75. Now we have the stock breaking out above its 5 year highs. All time high is at 232.70 posted in January 2018. disc: invested as disclosed before.

21 Likes
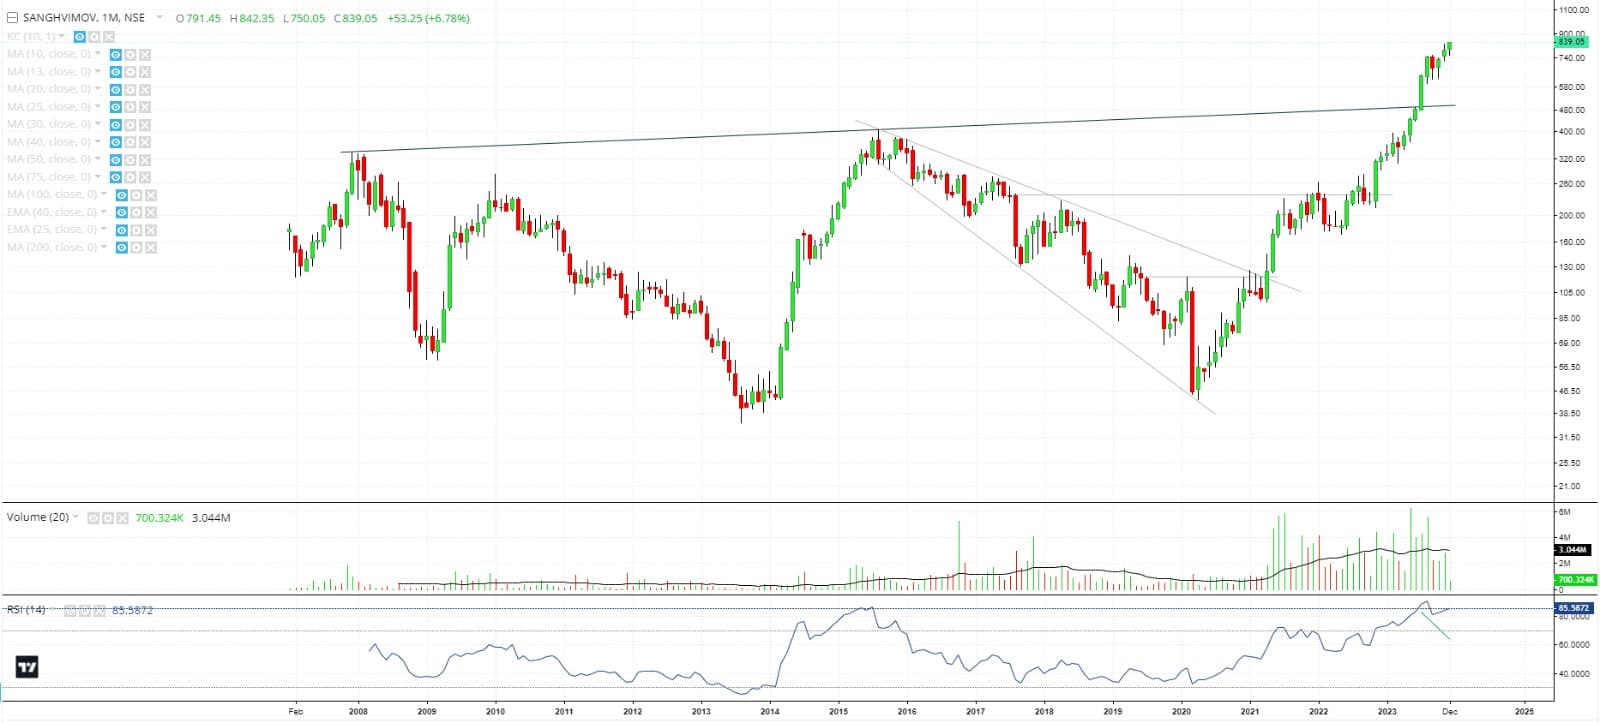
Update on Sanghvi Movers: 370-624-706-850
- A series of bearish HnS patterns negated,
- A multi year downward wedge played out,
- Shakeouts at multiple junctures along with positive RSI divergences
Has all led to it making an ATH. Monthly chart below
5 Likes
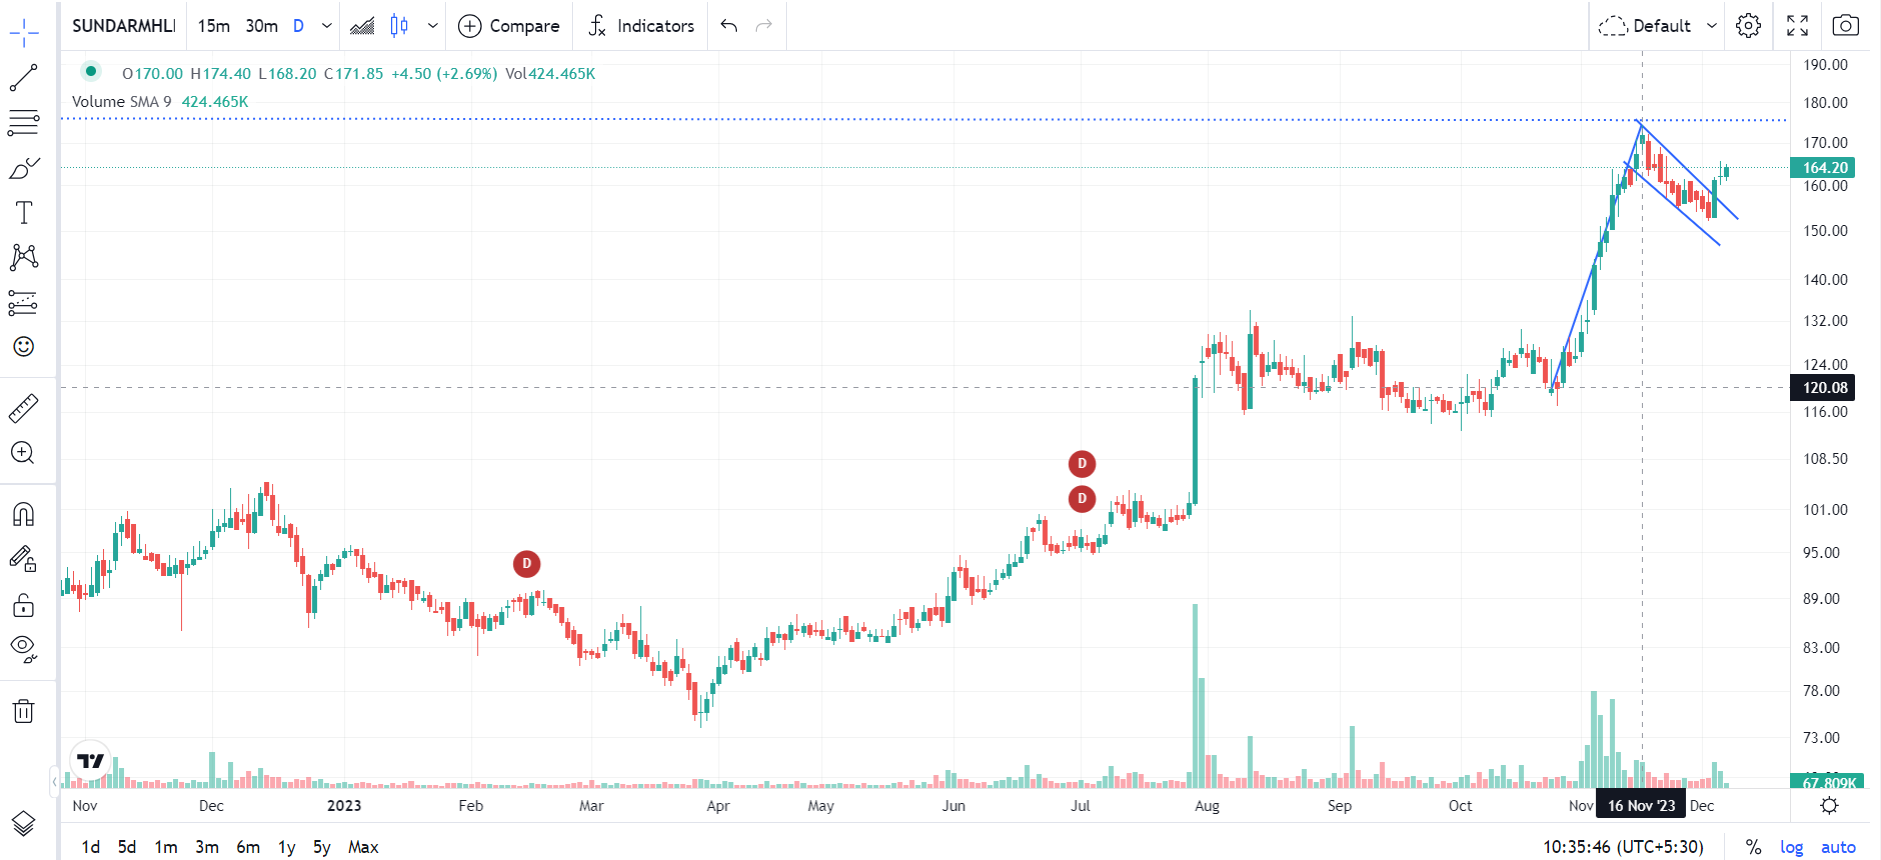
Sundaram Finance Holdings Ltd is listed only on NSE (SUNDARMHLD) and is a holding company. The company is involved in making investments, primarily in automotive companies. Significant investment includes Sundaram Clayton, Wheels India, IMPAL, Brakes India, Turbo Energy, Axles India – most of them leaders in their respective markets. Through its 100% subsidiary, Sundaram Business Services Limited and its own operations, SF Holdings also provides outsourced business processing and support services.
The company derives majority of its income from divivdends. Past three quarters have been good for the business.
Technically After the Q2 results were declared on Nov 02 2023 the stock price moved up and hit a 52 week high of 174.4 on 16 Nov 2023, since then the stock price has consolidated and recently formed a flag pattern. If the flag pattern works out, the length of the flag pole is 55 rs so the target could be 230 rs (175+55)
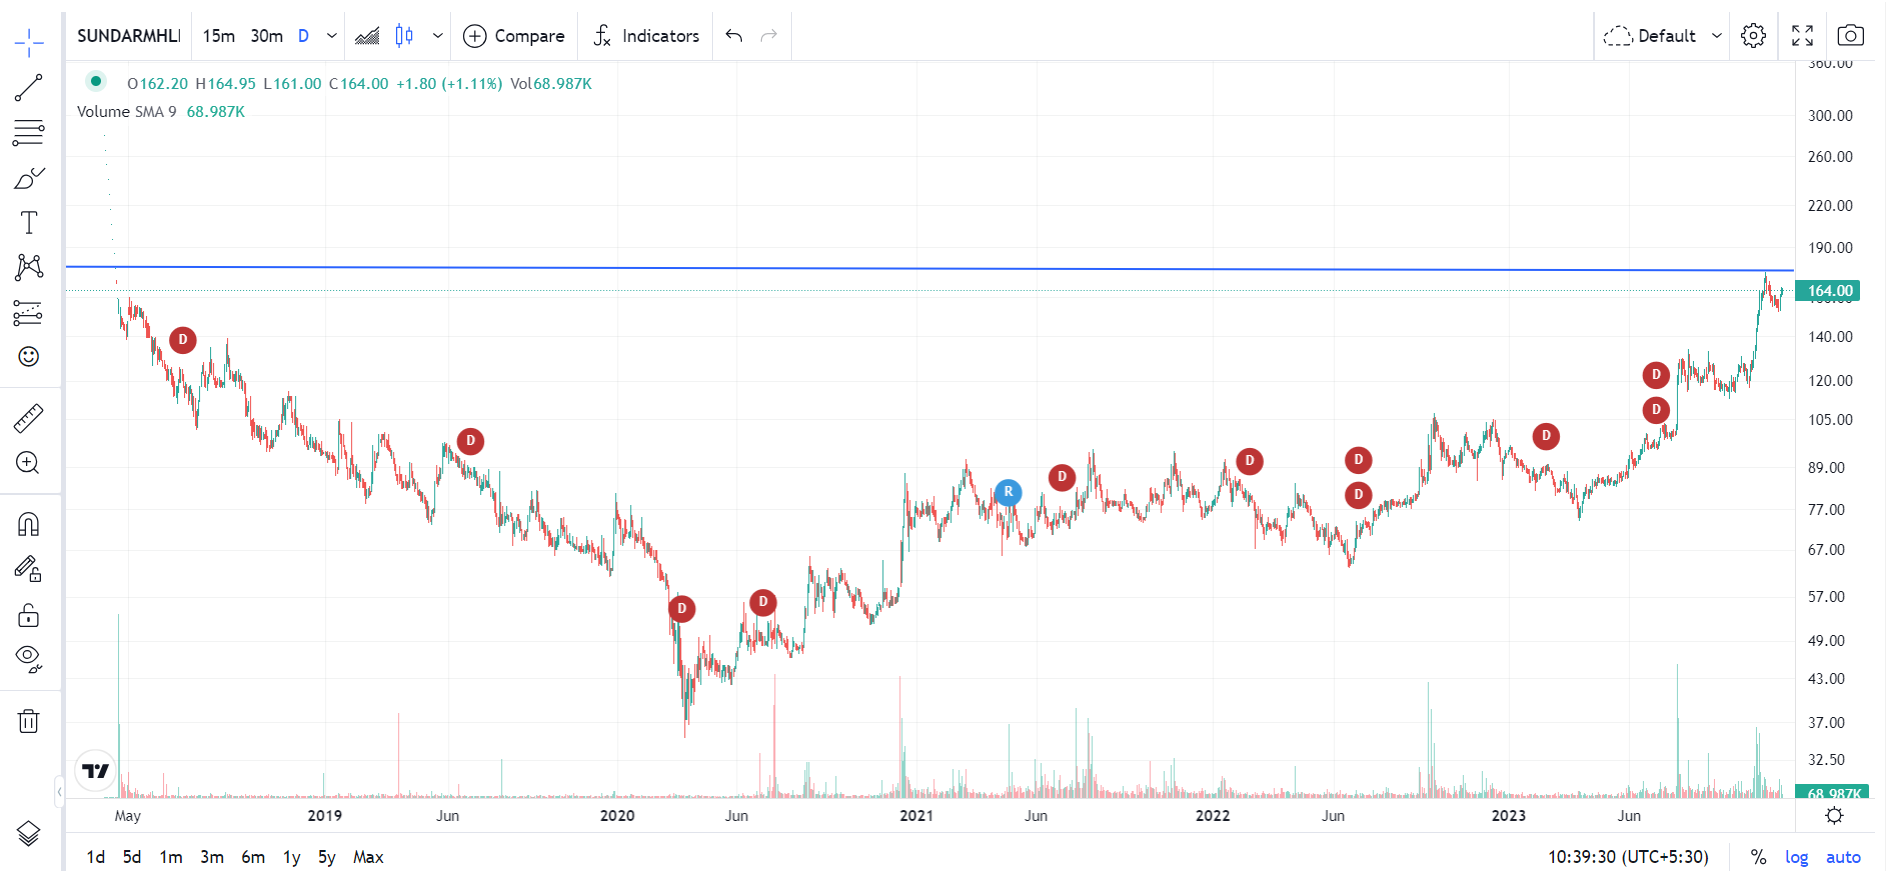
On a larger time frame the stock was de-merged and listed on NSE back in March end 2018 and the price settled around 170 to 160 levels in mid April. The stock has formed a rounding bottom. Larger time frame targets could be more than 230, if the pattern works out.
Disclosure : Invested. (not a recommendation, anyone contemplating investing needs to do their own diligence).
5 Likes
The small daily flag mentioned in above post failed and the stock price broke below the lows of the flag at 1242 and went down to post a low of 1193 and recovered today to close at 1261. It retraced nearly 50% of the previous upmove. On the medium to long term the bullish structure seems intact, but on daily time frame, stock price has undergone sharp correction. Need to watch next few days how it plays out. (disc; invested. no trades in last month)
15 Likes
Jain Irrigation chart update. The breakout from above mentioned cup and handle pattern did happen successfully and stock price has managed to reach and stall near level of 73. In past few weeks it managed to cross an important resistance zone of 68-69 and managed to cross 70 and post swing high of 73. Currently it seems in a retest phase where it is trying to take support at zone of 65-68.
Pattern target of the cup and handle pattern marked on chart is 98-100, and it remains to be seen if and when it is achieved. disc: invested as a techno funda bet.
Put below is an updated chart with GMMA (similar chart to the one posted above, but updated with recent readings )
Sep quarter results have shown 30% revenue growth and improved EBIDTA. Management in the concall have started talking about growth being a priority after having been in the process of cleaning up the mess due to debt and recoveries.

17 Likes
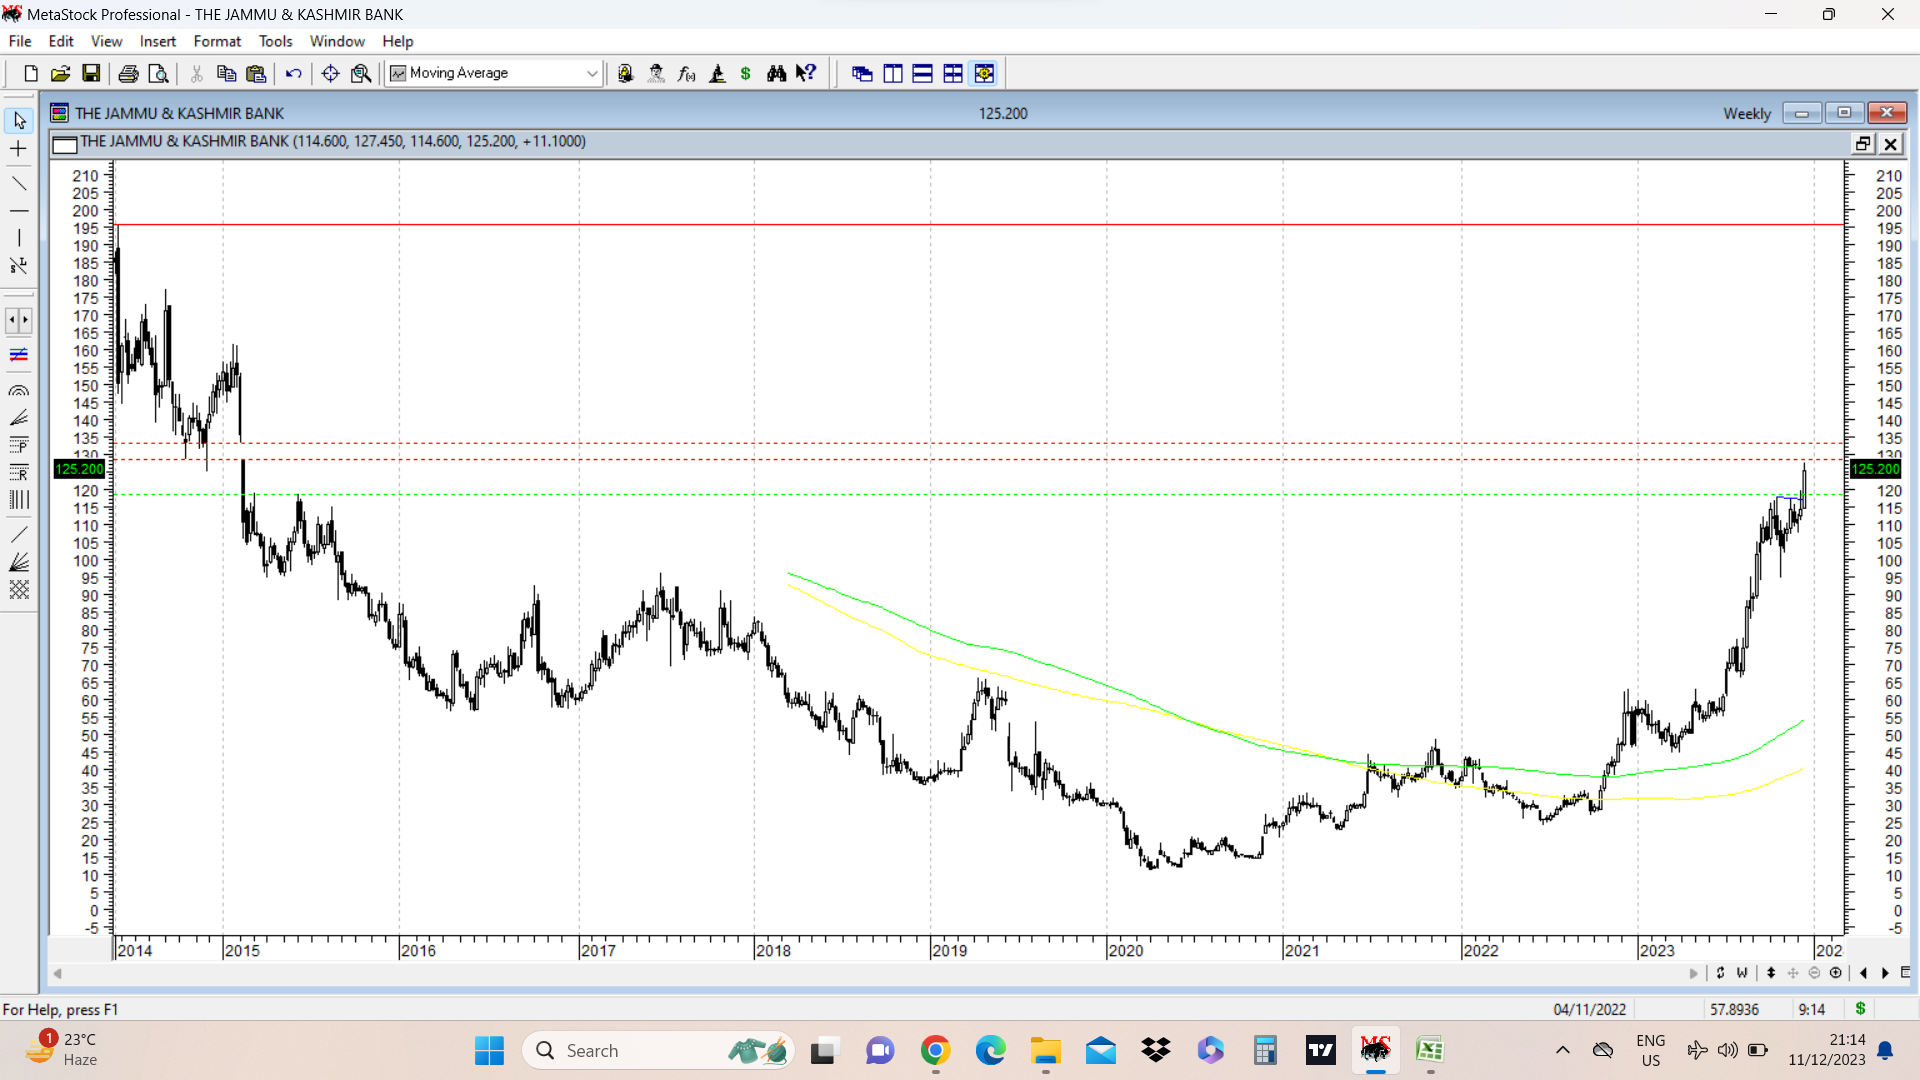
JK Bank after a lot of consolidation between 110-118, and a short dip to below 100 in past few weeks today managed to cross important resistance of 118.50 talked about in the above post and closed at 125 . Going ahead, a gap down area of 128-133 is next key level to watch in terms of resistance. Above that there can be resistances at 160 and 176, and finally all time high of 195.
The overall structure as mentioned in above post is a nice rounding structure These are usually considered to be much stronger structures than the V shaped upmoves that often happen in volatile stocks.
disc; invested, not a recommendation.
20 Likes
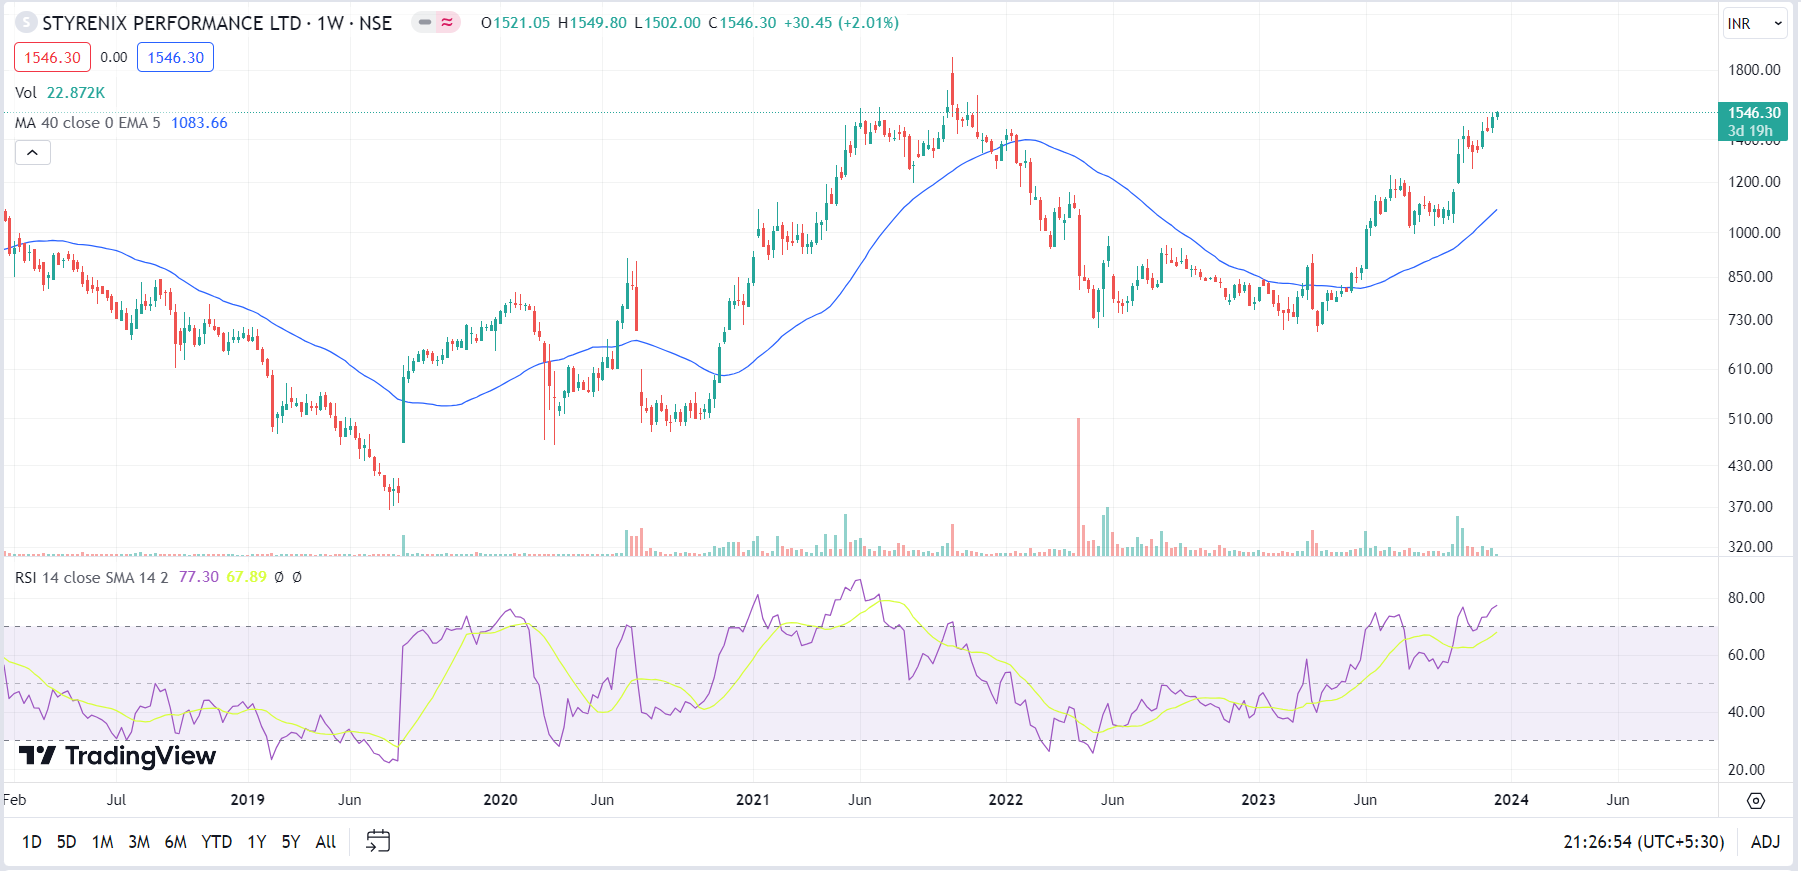
Sharing the weekly chart of Styrenix Performance Chemicals here.
The company breached its 52W high today.
It is involved in the production of ABS and SAN chemicals which are used in the auto sector which many are touting would see a turnaround as interest rates lower from here.
In Dec 2022, the original promoter of the company, Rahul Agrawal brought back the company from an MNC that had taken over the operations a few years ago.
The last quarters results were truly incredible compared to the performance earlier. After this a doubling of capacity was announced by the company.
The stock pledge is high because the company was taken over through debt in the name of the promoters and the company will possibly pay higher dividends to enable the pledge to be paid off in the coming years.
Too many positive factors playing out in the company at once.
4 Likes
Flag formation on Eureka Forbes weekly.
On Daily also, it has taken multiple supports at 200Day moving average, before moving up.
Nomura recently initiated coverage
4 Likes
On weekly chart of Equitas SFB, the cup with handle played out very nicely. Today’s strong price action can be seen with large volumes.
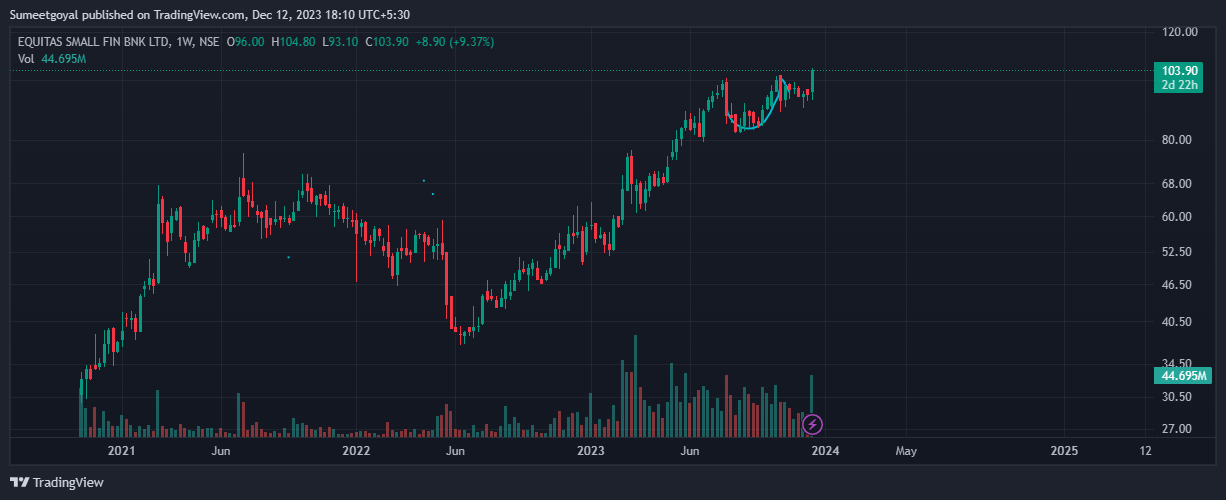
3 Likes
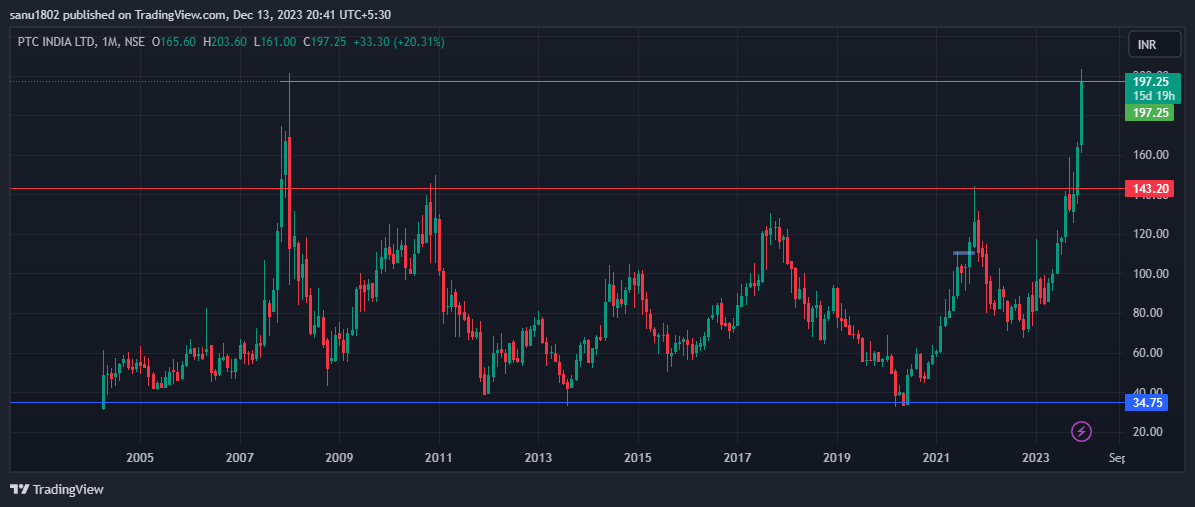
PTC INDIA: this is a monthly chart of PTC India ltd. For last 15 years, it was consolidating between a range of 34 and 145 (marked in red line). It broken out this range last month and today it crossed its All Time High last made in 2008 with good volumes. @hitesh2710 sir you used to track it. your view on it sir.
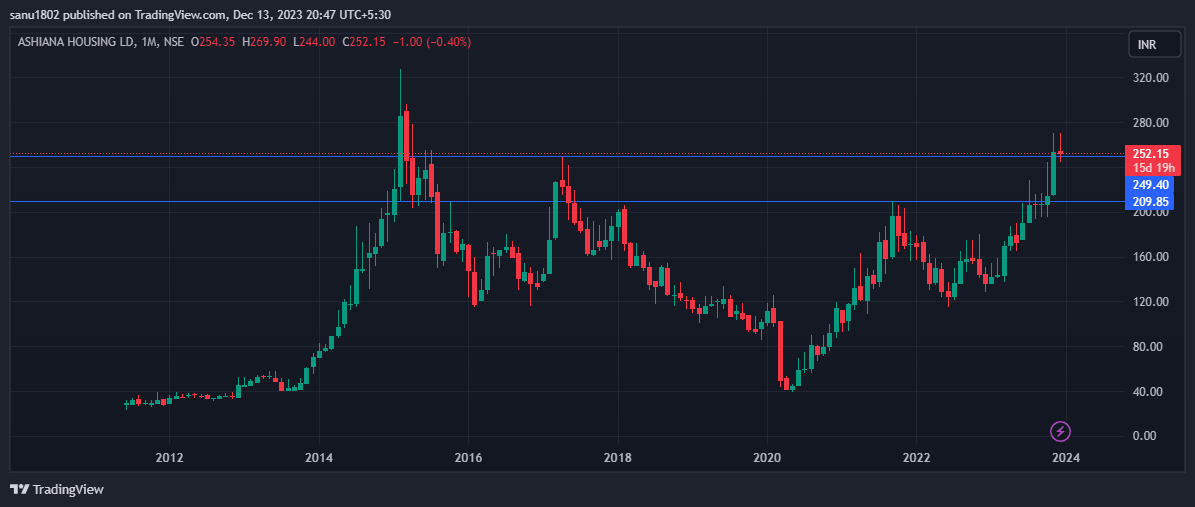
(2) Ashiana Housing: This is a monthly chart of Ashiana Housing. whole Real Estate sector is already performing very well in this bull market. Ashiana housing is a one of the clean company in this sector. currently its trading at 250 level and it is the level from where it gone down in 2015 and 2017 and if it consolidates here and closes above this area then it can be looked upon.
2 Likes
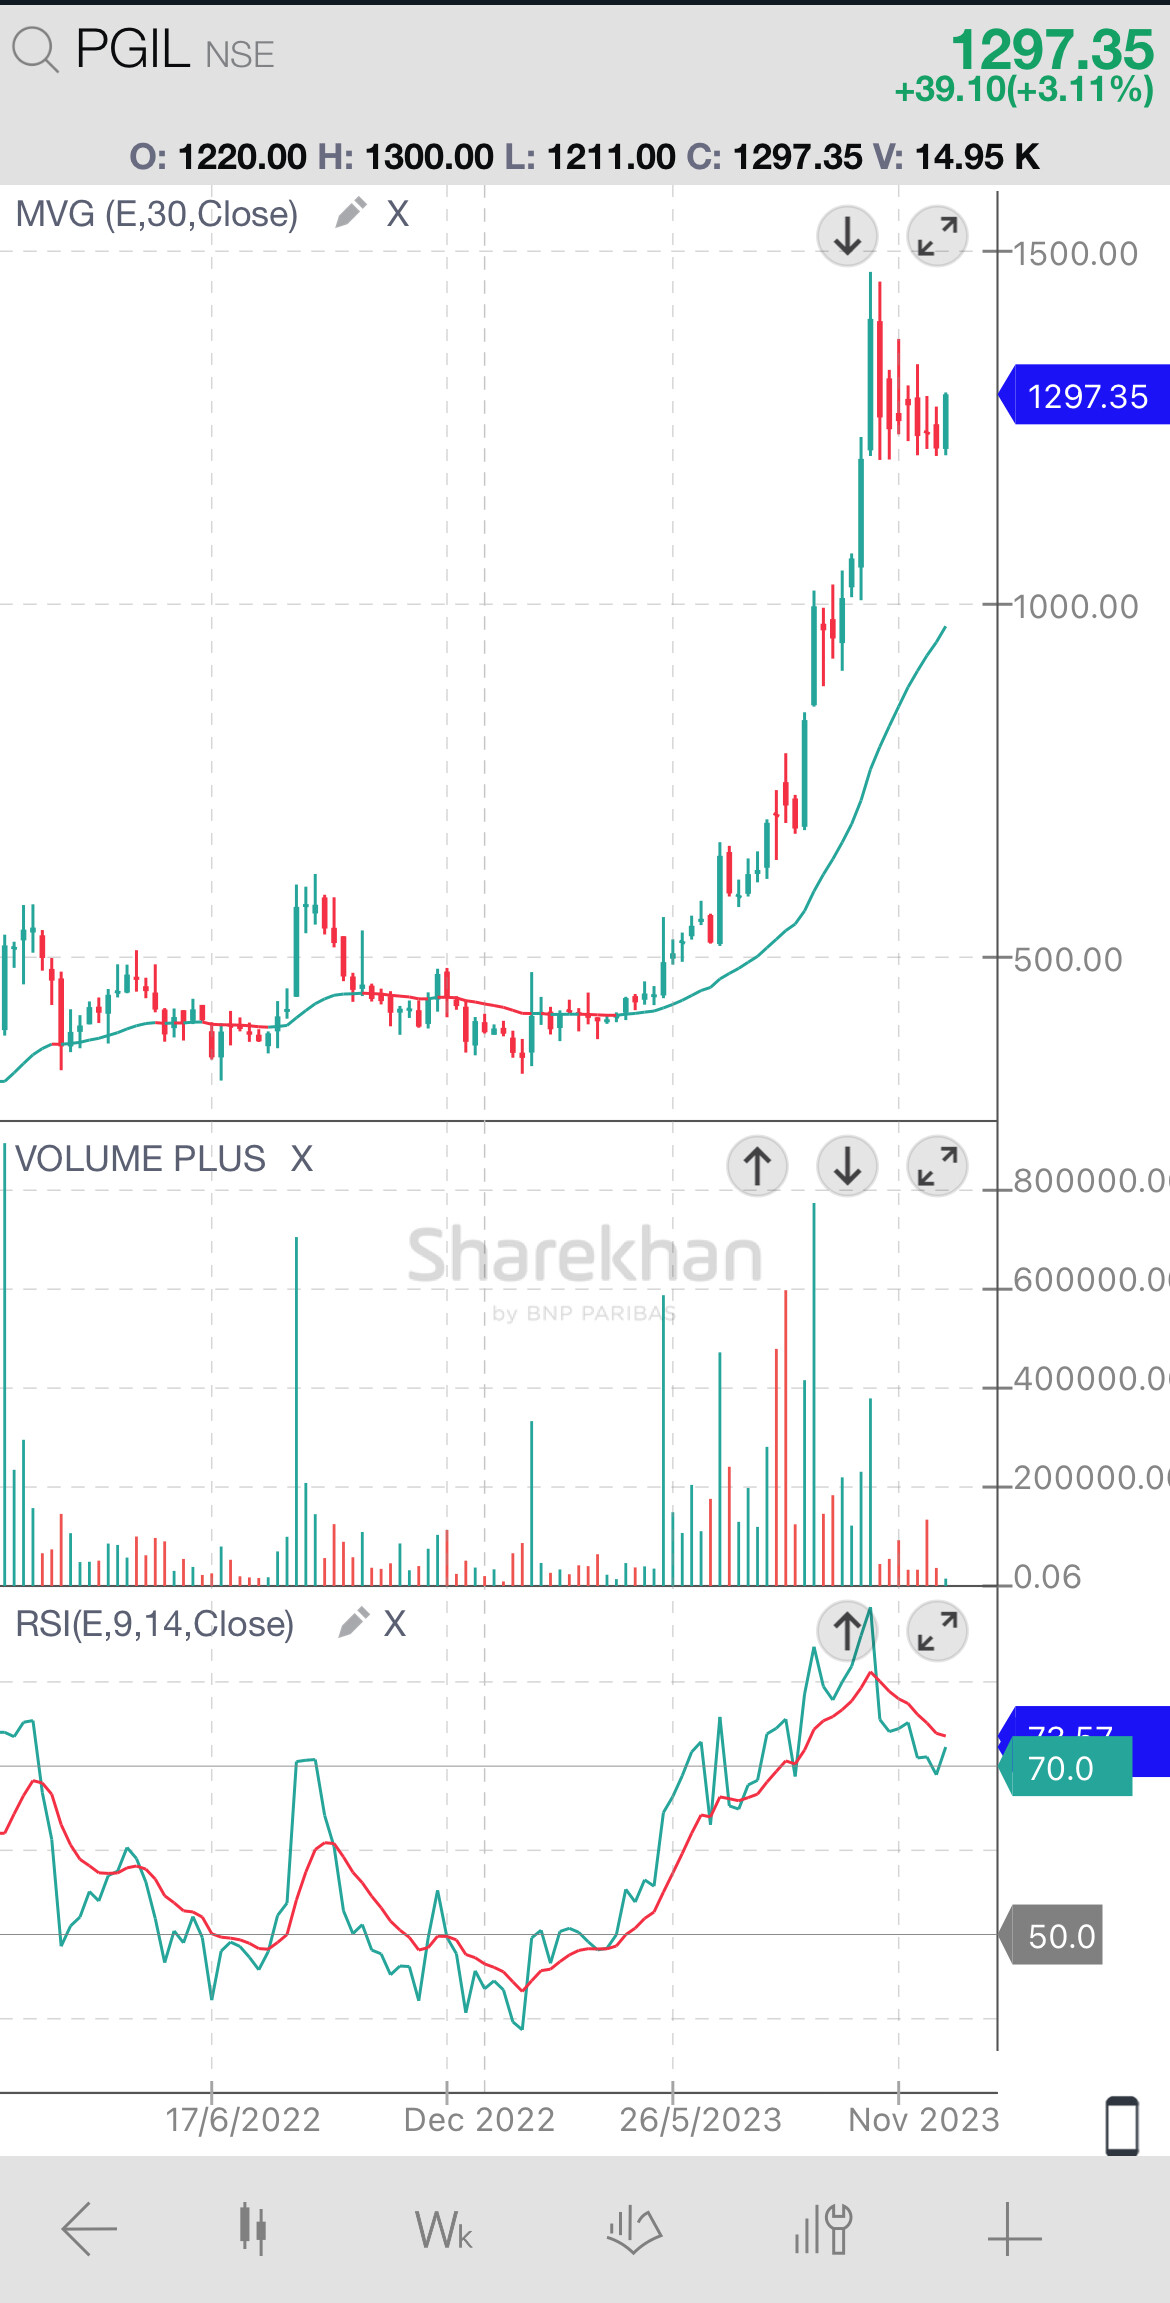
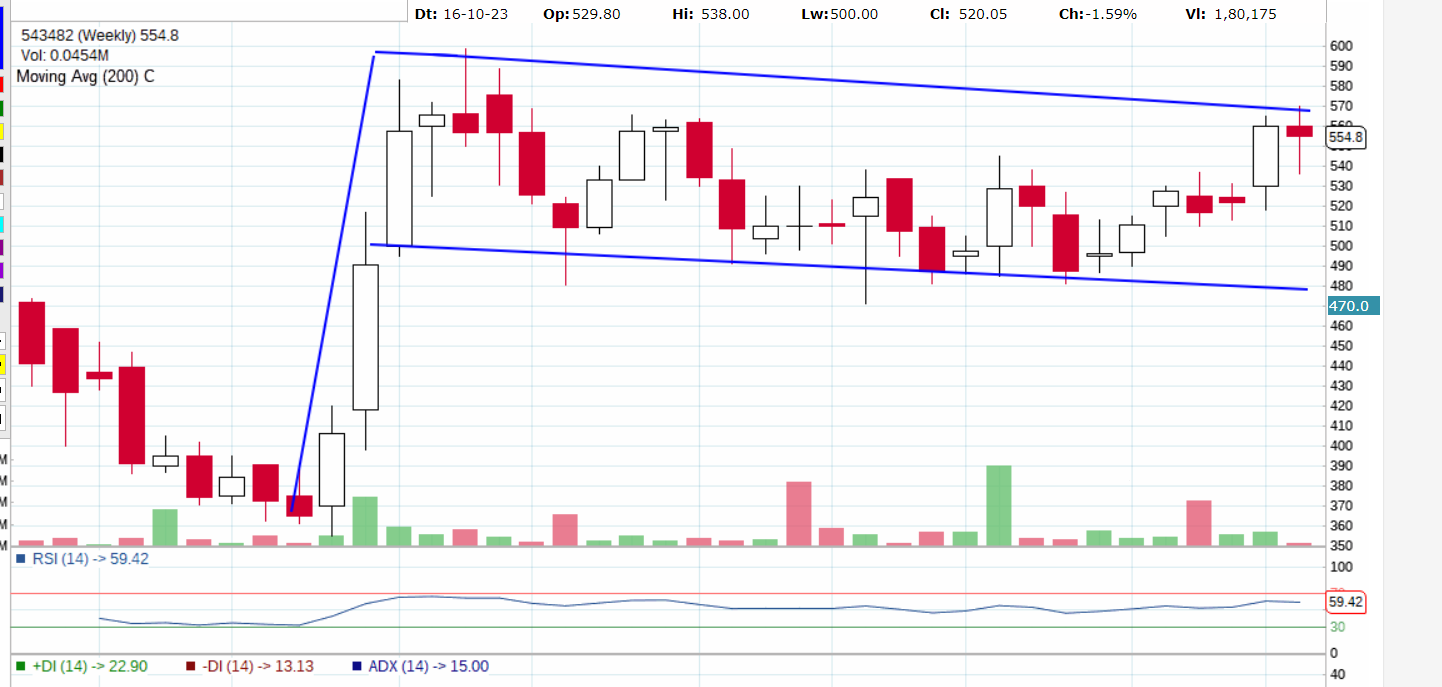
Can this be called a valid flag formation in Pearl Global on the weekly chart? It’s been consolidating after a sharp run up in October. It ran up from 550 in June to 1450 in October and has been consolidating in a tight range between 1200-1300 with drying up of volumes. Fundamentally, they have produced quite a few good quarters, with their Bangladesh unit breaking even in the first year itself. So far they’ve mostly followed an asset light model with factory partnerships - recently launched their Guatemala factory to cater to their US clients. Supplies most fashion marquee brands and wholesale suppliers in US. Still seems reasonably valued to me.
1 Like
Hello Sir, How are you looking at EIL now ? I took my first position at 72 and kept building it until stock touched 100 (Avg Buying price came out to be 82). I rode the rally but then sold it at 140 and 120 when stock was breaking down because i thought that these were key support levels and i wanted to retain my profits.
Subsequently after the stock again broke 140, i have re-entered the stock to play the next rally. This has been more of technical trade (with fundamental backing) for me.
I wanted to understand how do you play these trades
- Do you book your profits when there is decent correction (it corrected from 165 to 120) to protect your profits (admittedly it never broke 200 DMA but since the runup was so steep, dint want to lose the profits)
- Do you re-enter stock after you have sold if it has resumed its uptrend ?
4 Likes
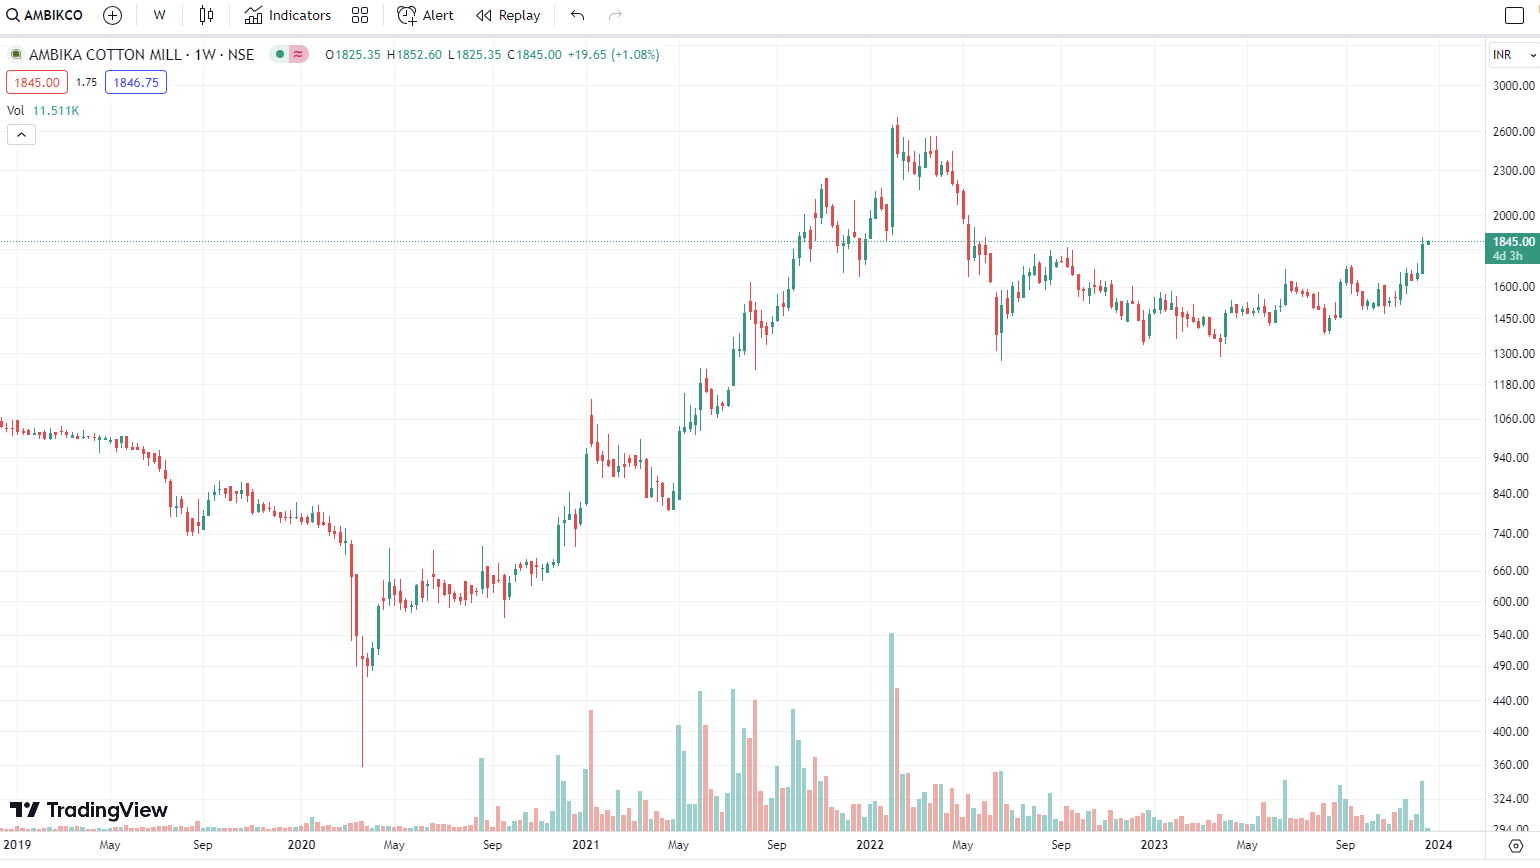
Ambika Cotton Mills
Seems this stock is also moving up after a good rounding bottom formation with good volumes
Also the anticipated UK Free Trade Agreement would give a boost to the textile sector. Hopefully giving opportunity for Ambika to go for expansion using its free cash reserves.
4 Likes