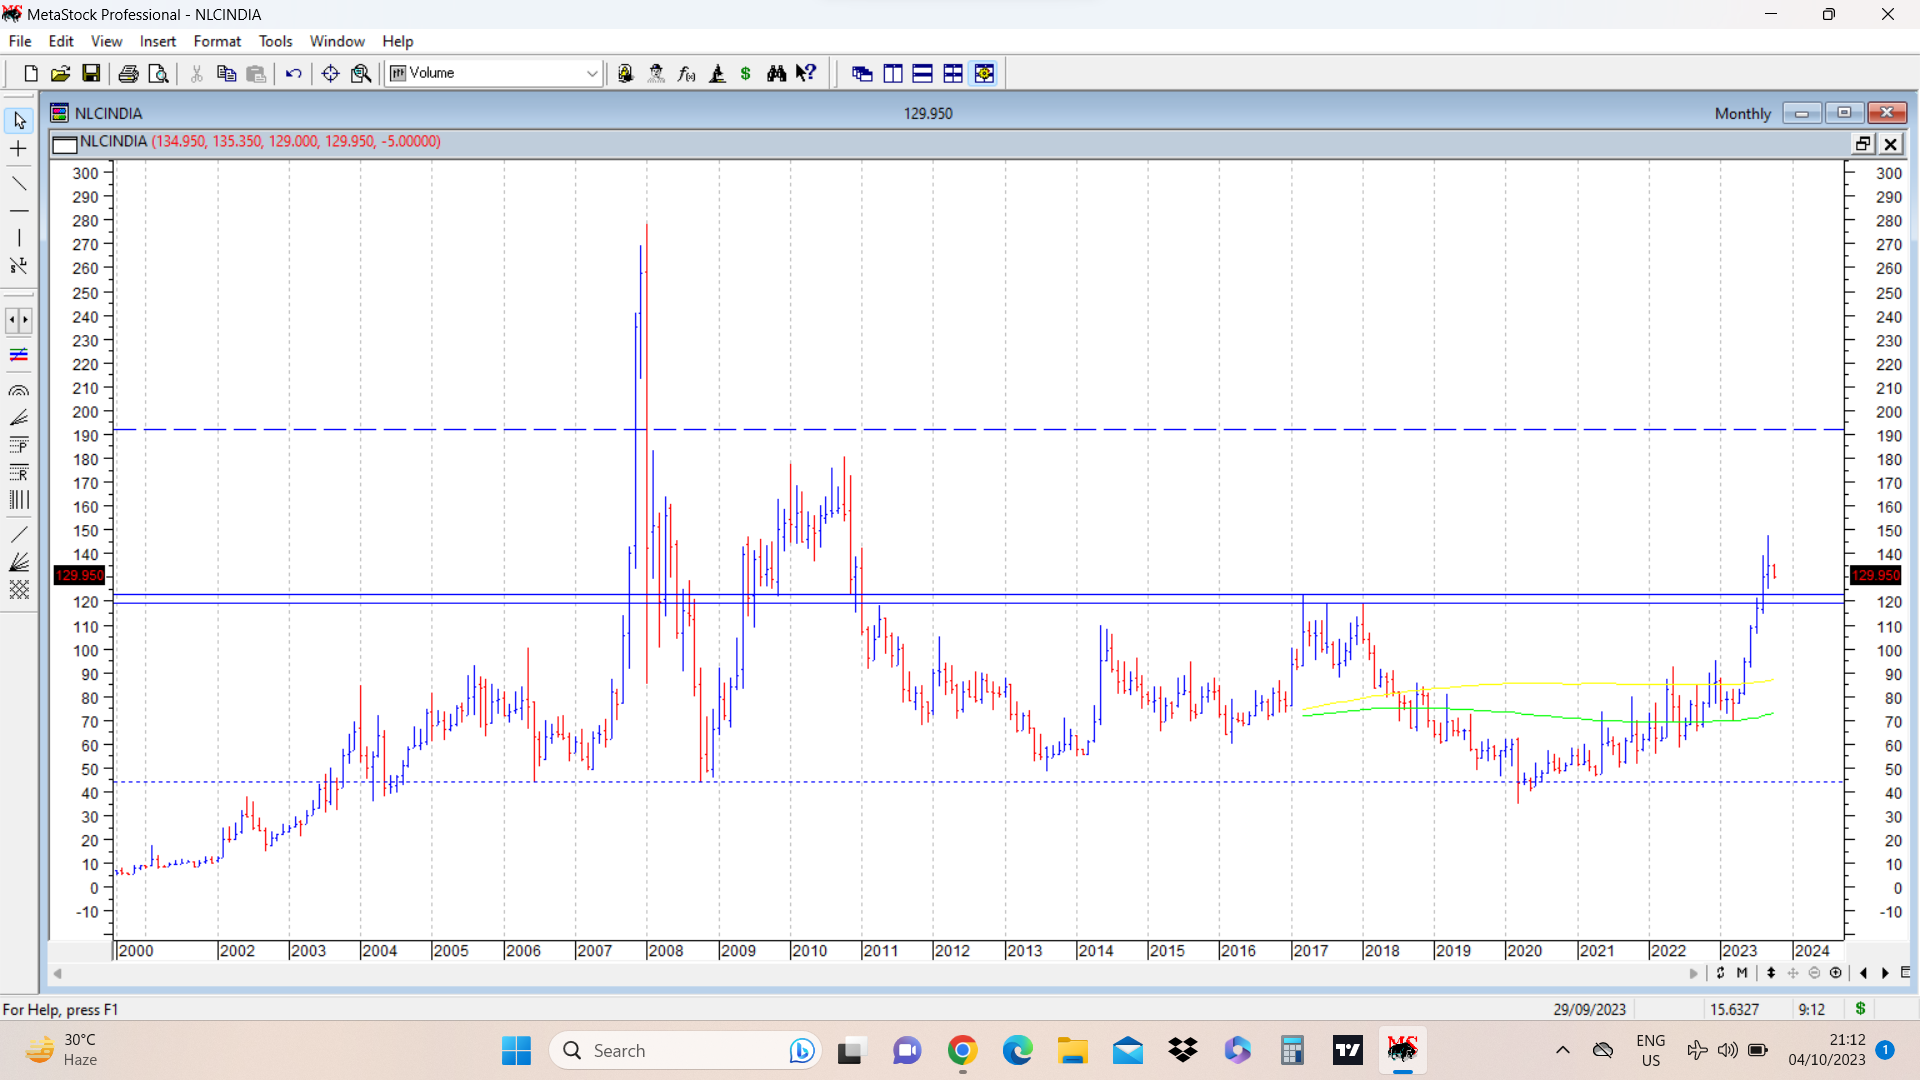
NLC India recently broke out above its 12 year high of 123 in August 2023 and posted a swing high of 147, before it started correcting. Currently it is at 129. Attached monthly chart shows a previous strong band of resistance between 119-123, which offered resistance multiple times in past 12 years. Previous major peaks are at 180 and 277, in years preceding 12 years. Earlier name was Neyveli lignite corporation and it is a PSU company.
A similar company, ( though with much more fancied prospects in rare earth metals) GMDC has been making the waves by crossing its all time high. Its major product also remains lignite. Lignite is an ancillary play to power sector, which is used to produce electricity.
I got interested in this company because it had two current fancies within it. Power ancillary and PSU. And to top it, it crossed a 12 year high. A good thing I like about the chart is the rounding structure from Jan 2018 and then a breakout above the highs of that structure.
The cons about this situation . First the PSU tag is getting bandied about too much in markets these days. How long this fancy lasts is anybody’s guess. Secondly overall markets have been a little bit rocky. And third, govt holds 79% stake and there is always a risk of govt coming out with a FPO kind of offering once there is a rally. We have seen these things in PSUs recently.
disc: I have a small starter position, which I intend to scale up if and when the trade starts going majorly in my favour. ( not a recommendation, anyone contemplating investment should do their own diligence. )