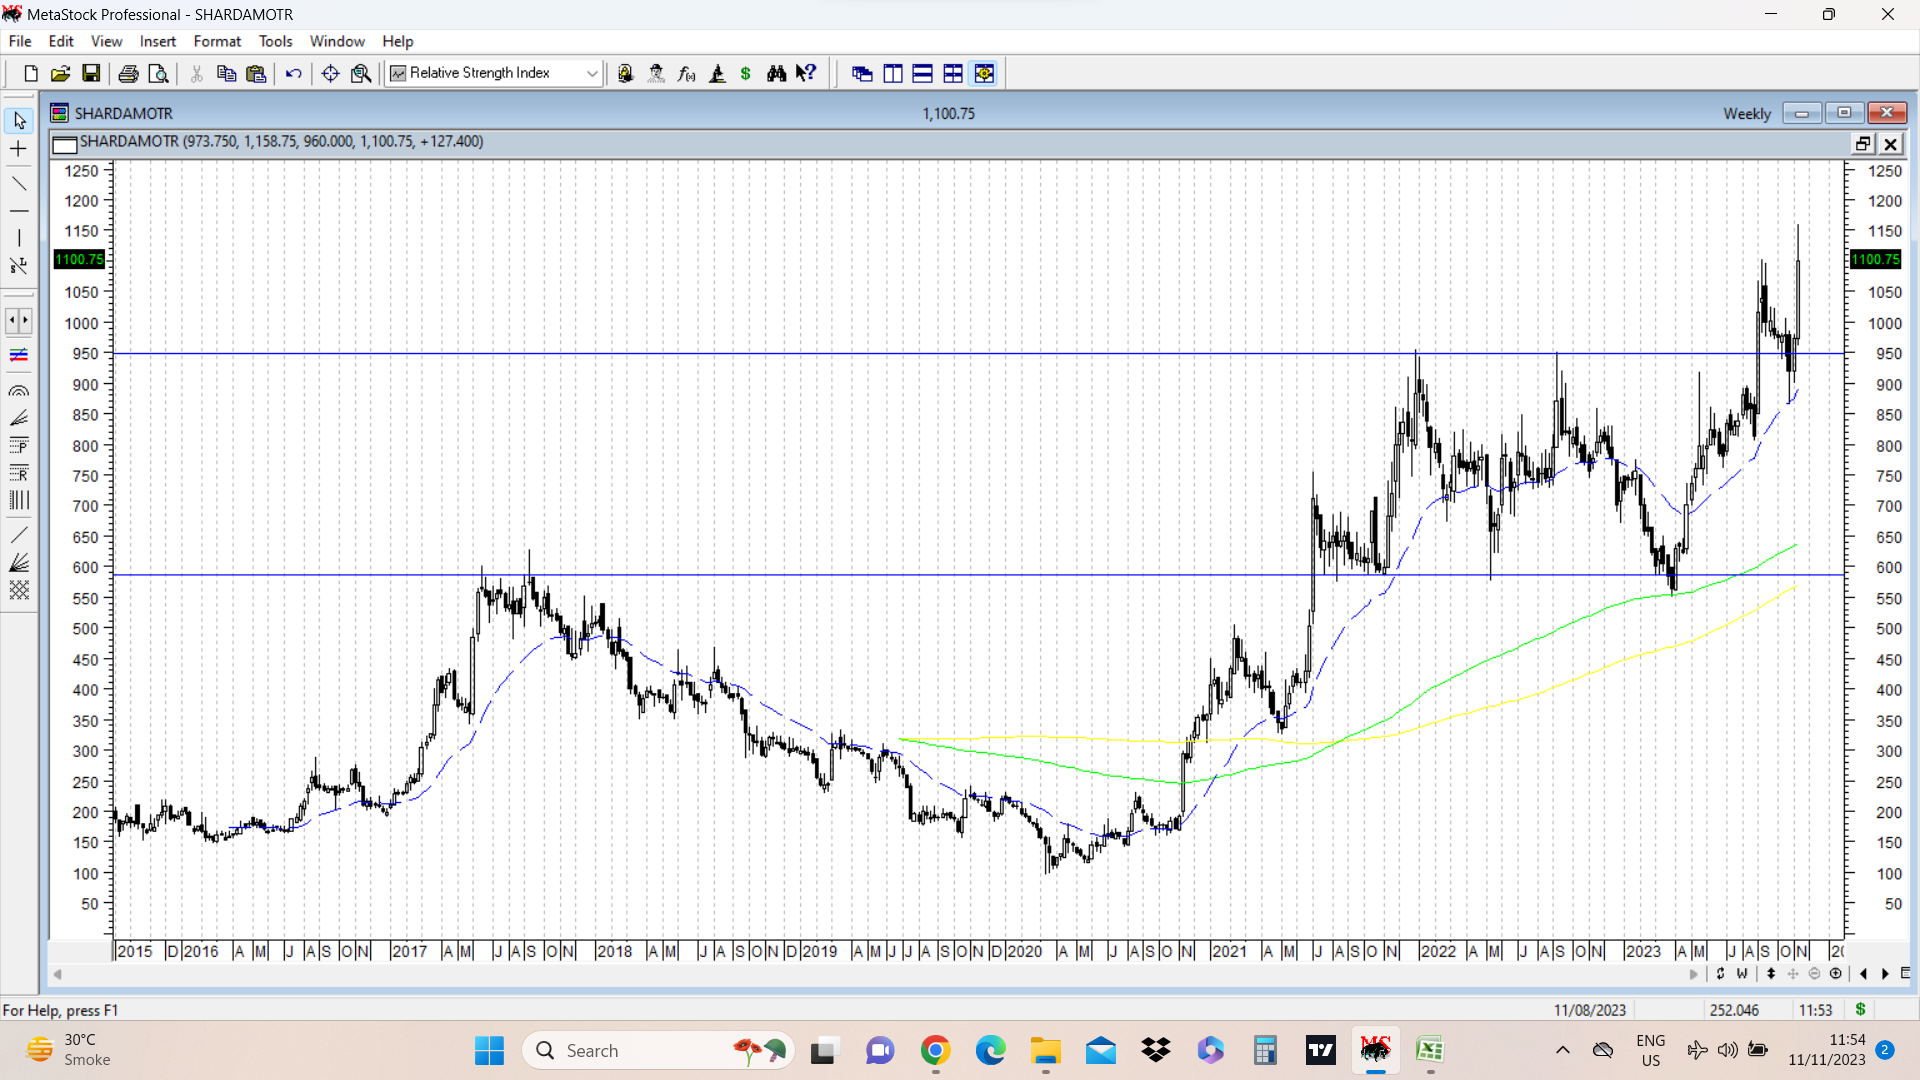
Sharda motors came up with very good q2 fy 24 results. Stock price gapped up above 1005 and went up to hit a high of 1158, before settling to close at 1100. Breakaway gap has been between 1005-1025.
Stock price had been consolidating between 590 and 950 during July 2021 to Sep 2023. It broke out above ATH of 955 and went on to high a fresh swing high of 1101 and then along with market correction went down and tested support of 30 WEMA (marked in dotted blue lines) and bounced back. On the back of good results it gapped up and hit another fresh swing high of 1158. Weekly close is with a big bullish high volume candle.
It is one of the examples of how to play all time high or multi year high breakouts. Whenever there is a retest post these kind of breakouts, they offer very good entry points.
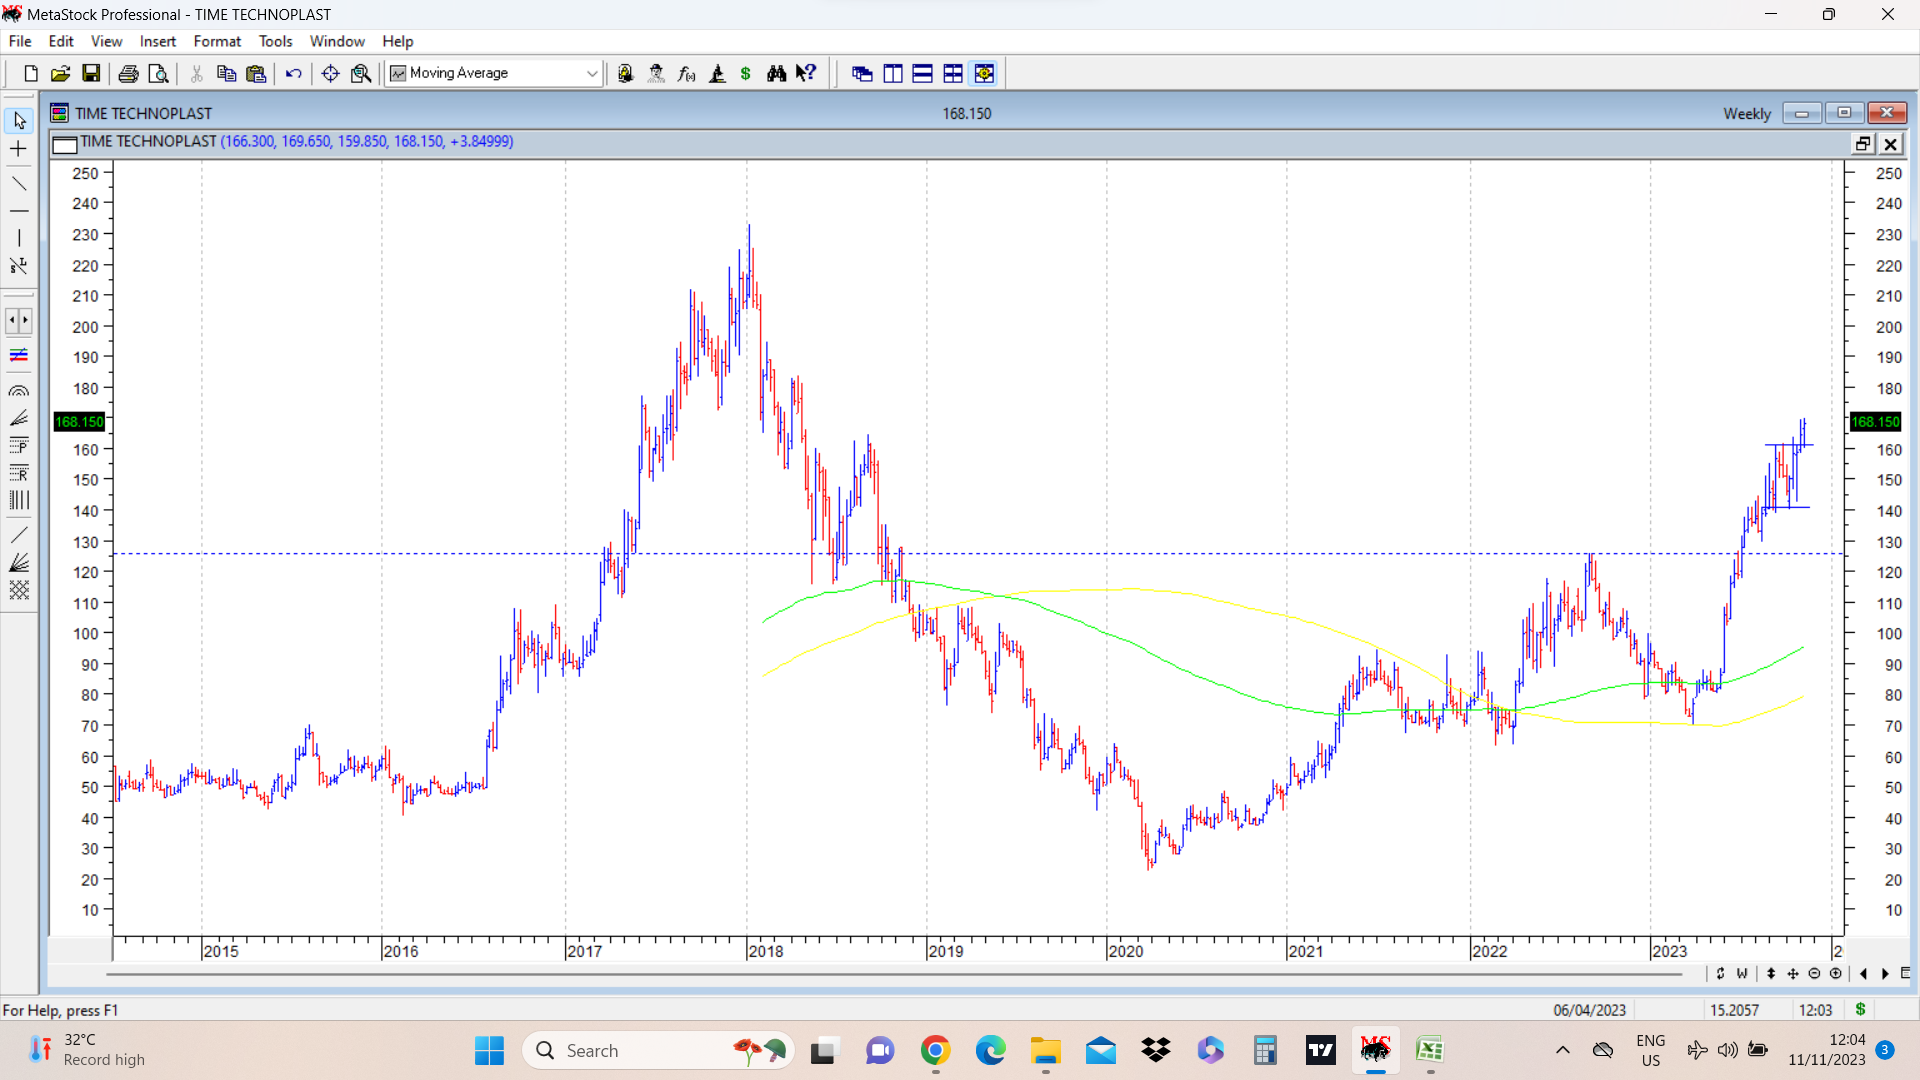
Time techno has been discussed many times before on this thread. It came out with good q2 fy 24 results this week. Stock price managed to close above its 4 month consolidation range of 140-160 (marked on charts) . Concall scheduled on 16 th Nov.
In the presentation, besides the usual results details, an important announcement by the management has been the following quote… The Company is in advanced stages of discussion for 2 out of 3 geographies for the said consolidation cum restructuring of overseas business and estimating to complete the transaction including receipt of proceeds in FY 2023-2024.
This has been a long pending trigger in this company. First time management has given a timeline to this restructuring exercise. Going ahead we need to see the quantum of amount that is involved in this exercise. disc: invested. time techno q2 fy 24 presentation.pdf (2.4 MB)
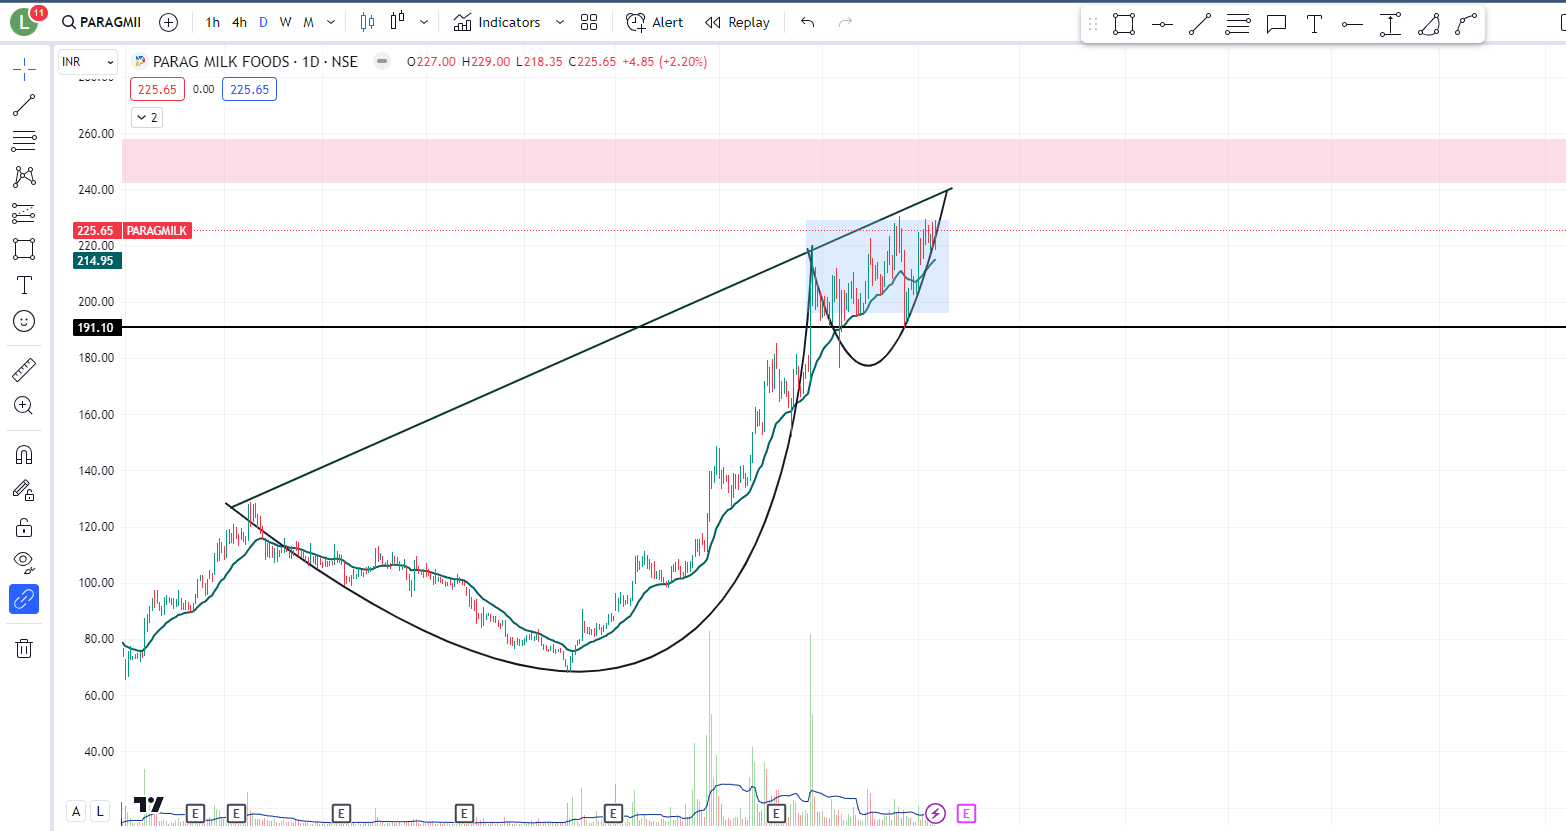
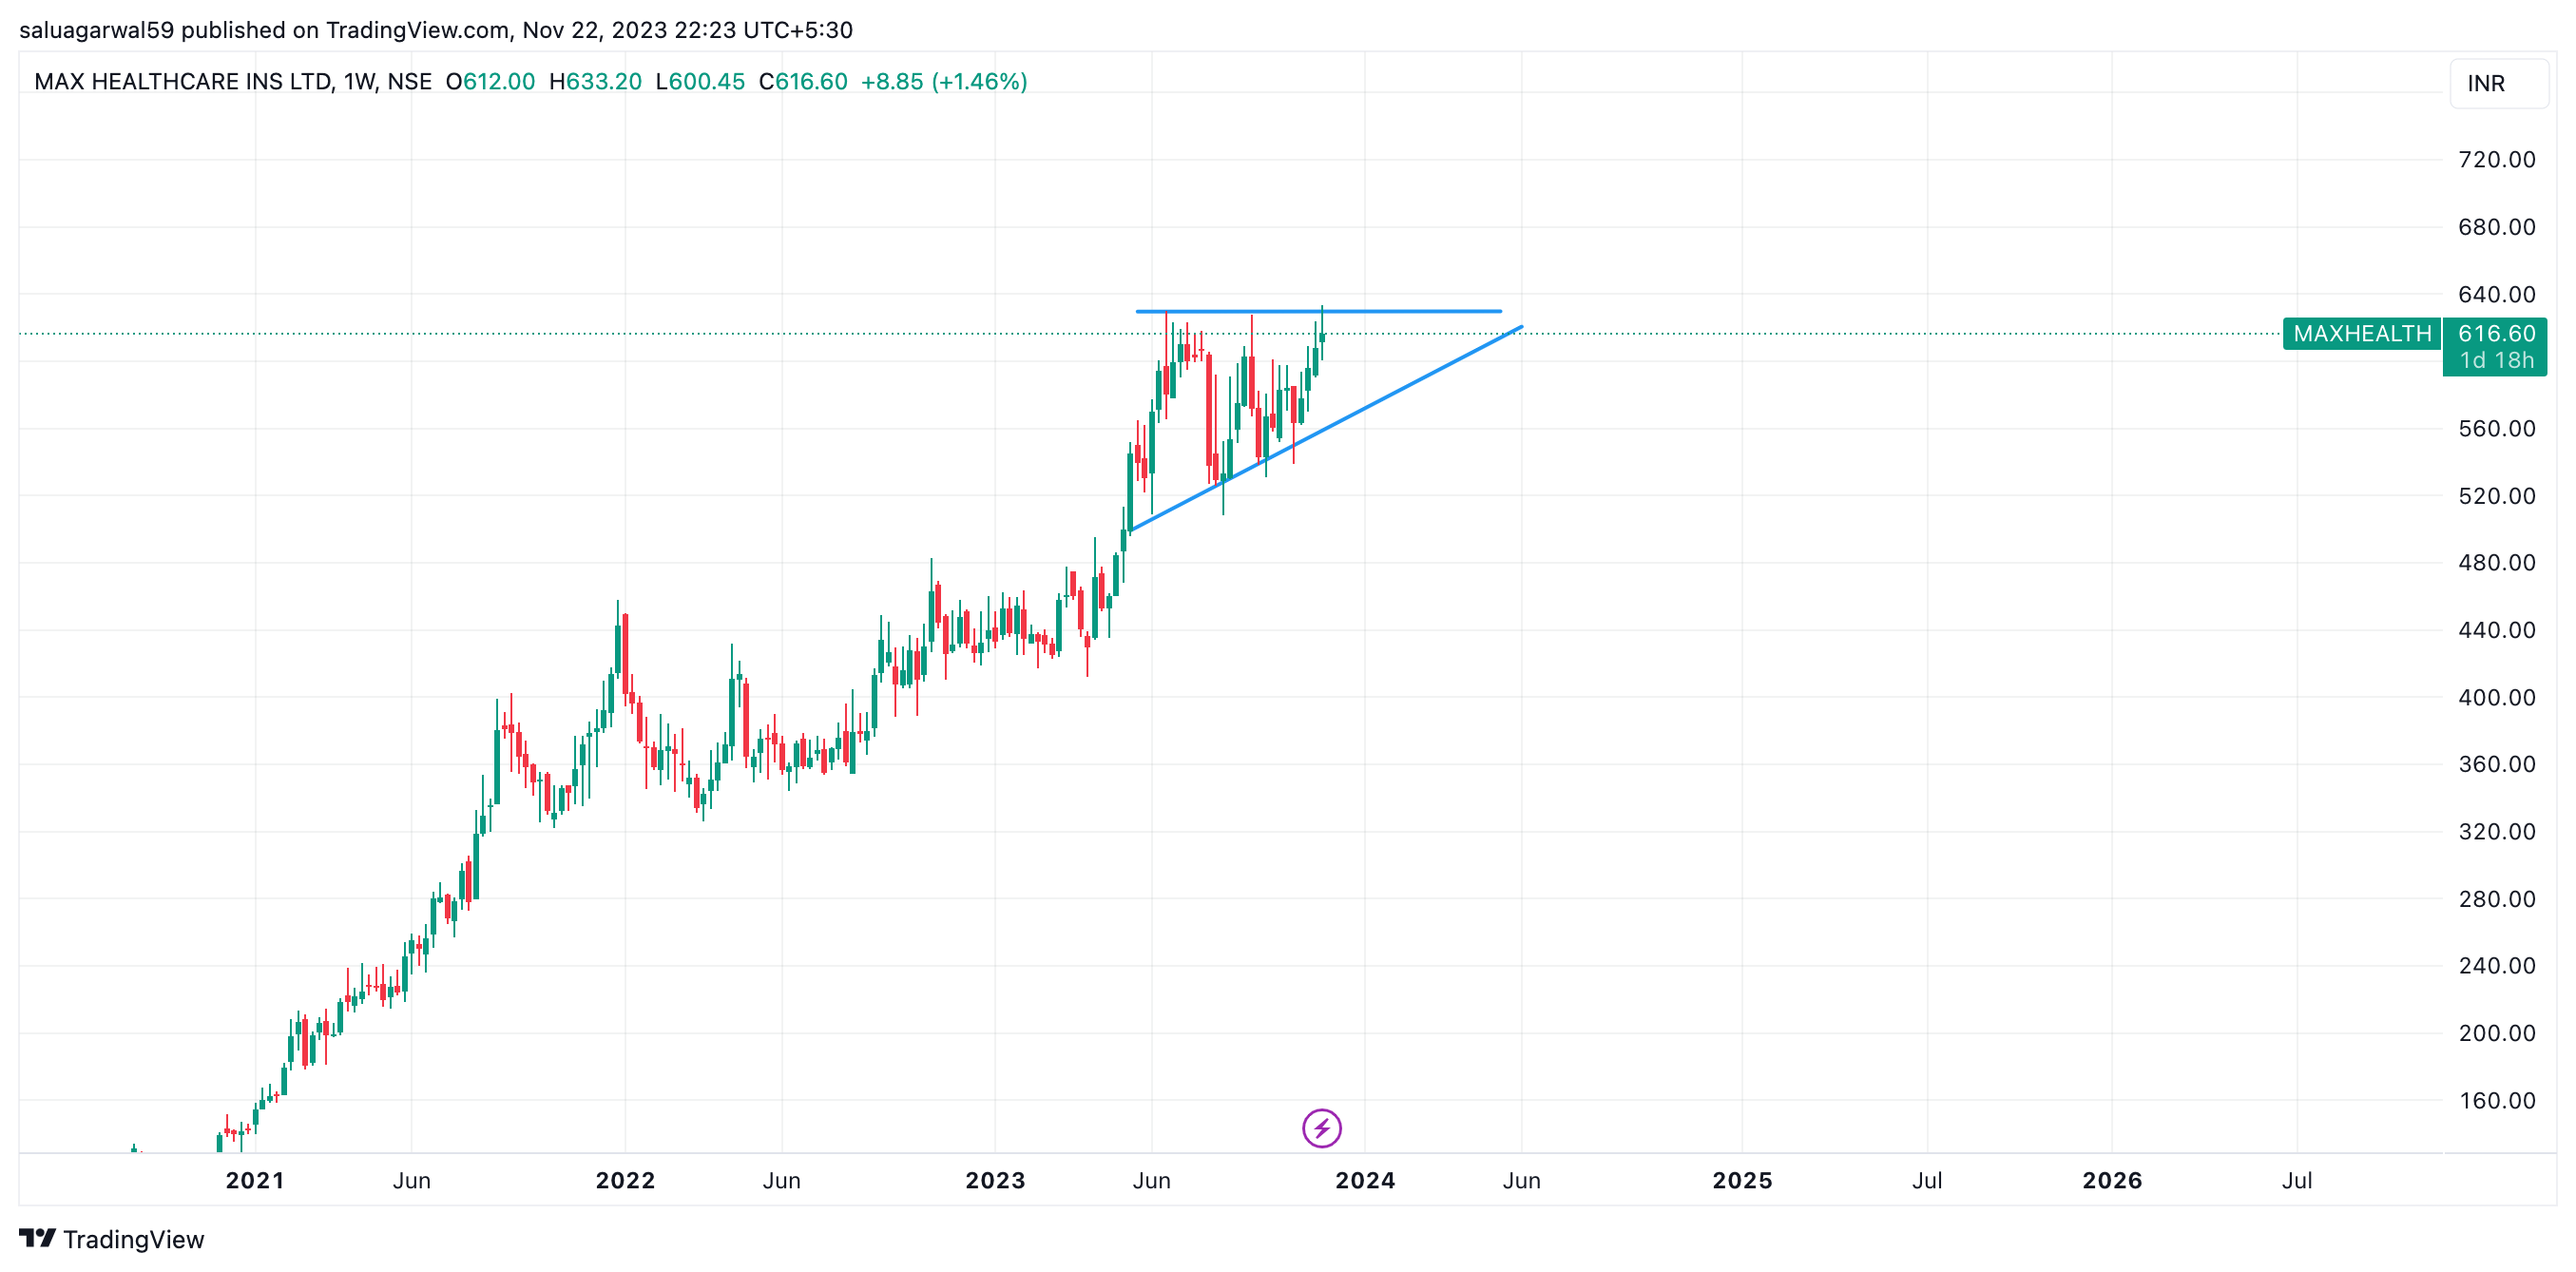
Parag Milk Food came up with very good quarterly results. The management always emphasizes on Parag’s image to be seen as an FMCG player rather than a commodity (dairy) player. These results are backed by their increase in sales in higher margin segment such as whey protein, ghee etc. Given such companies record the highest sales in festive season, a good quarter 3 is safe to assume. On the technicals, a VCP pattern is observed and in the recent days, price is mostly consolidating near the 20 EMA (see area highlighted in blue). Whether it breaks out of the VCP pattern or not, only time will tell, but if it does, it is a near a resistance zone (area marked in red).
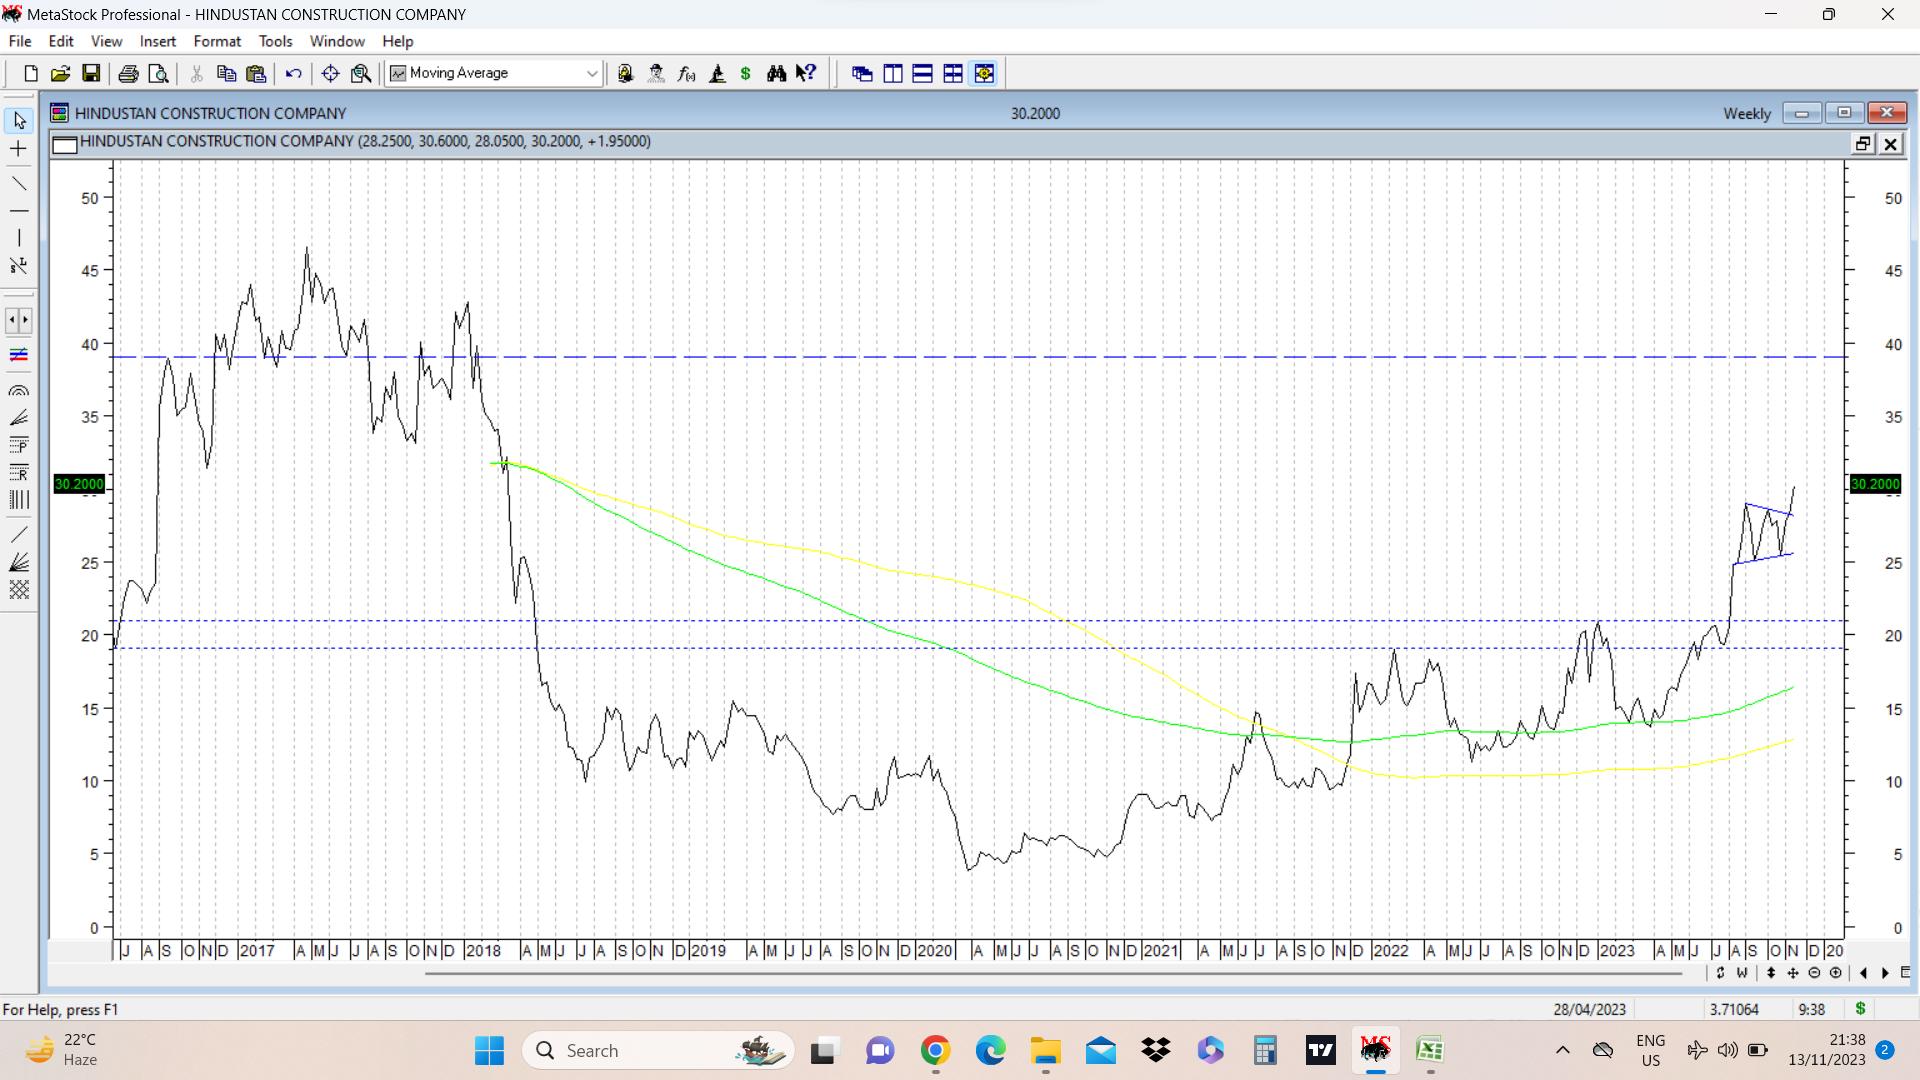
HCC cmp 30 . Fundamentally the company claims to be on a deleveraging path. If is one of the turnaround candidates. If it is successful, the pattern shown below can play out, but one has to closely monitor this kind of company on a regular basis to check how the story is playing out in terms of turnaround, or failure thereof.
According to their latest presentation, • Investor acquired 51% shares in Prolific Resolution Private Limited (PRPL). With this, PRPL has ceased to be a subsidiary of HCC, with effect from 30 Sept 2023. Consequently, ₹3,301.2 crore of debt has reduced on a consolidated basis.
Above is one of their latest exercises to reduce debt at consolidated level.
Company mainly operates in hydro, water, nuclear and transportation segments of infrastructure and power. Order backlog 12300 crores. Quarterly revenues as of last two quarters at 1800-1900 crores. Company does presentations, concalls etc which one can utilise for detailed research.
Technically, the stock price broke out of a 5 year high above 21 and the whole consolidation below it was an early rounding bottom formation. Since 12 weeks it was consolidating within a weekly triangular formation ( on weekly line charts) and now has broken out of this consolidation. The latest upmove also resembles a flag pattern with flagpole extending from 19 to 29, and breakout happening at 28.5.
disc: invested with a small allocation as a techno funda bet. ( not a recommendation, anyone considering investing should do their own diligence. )
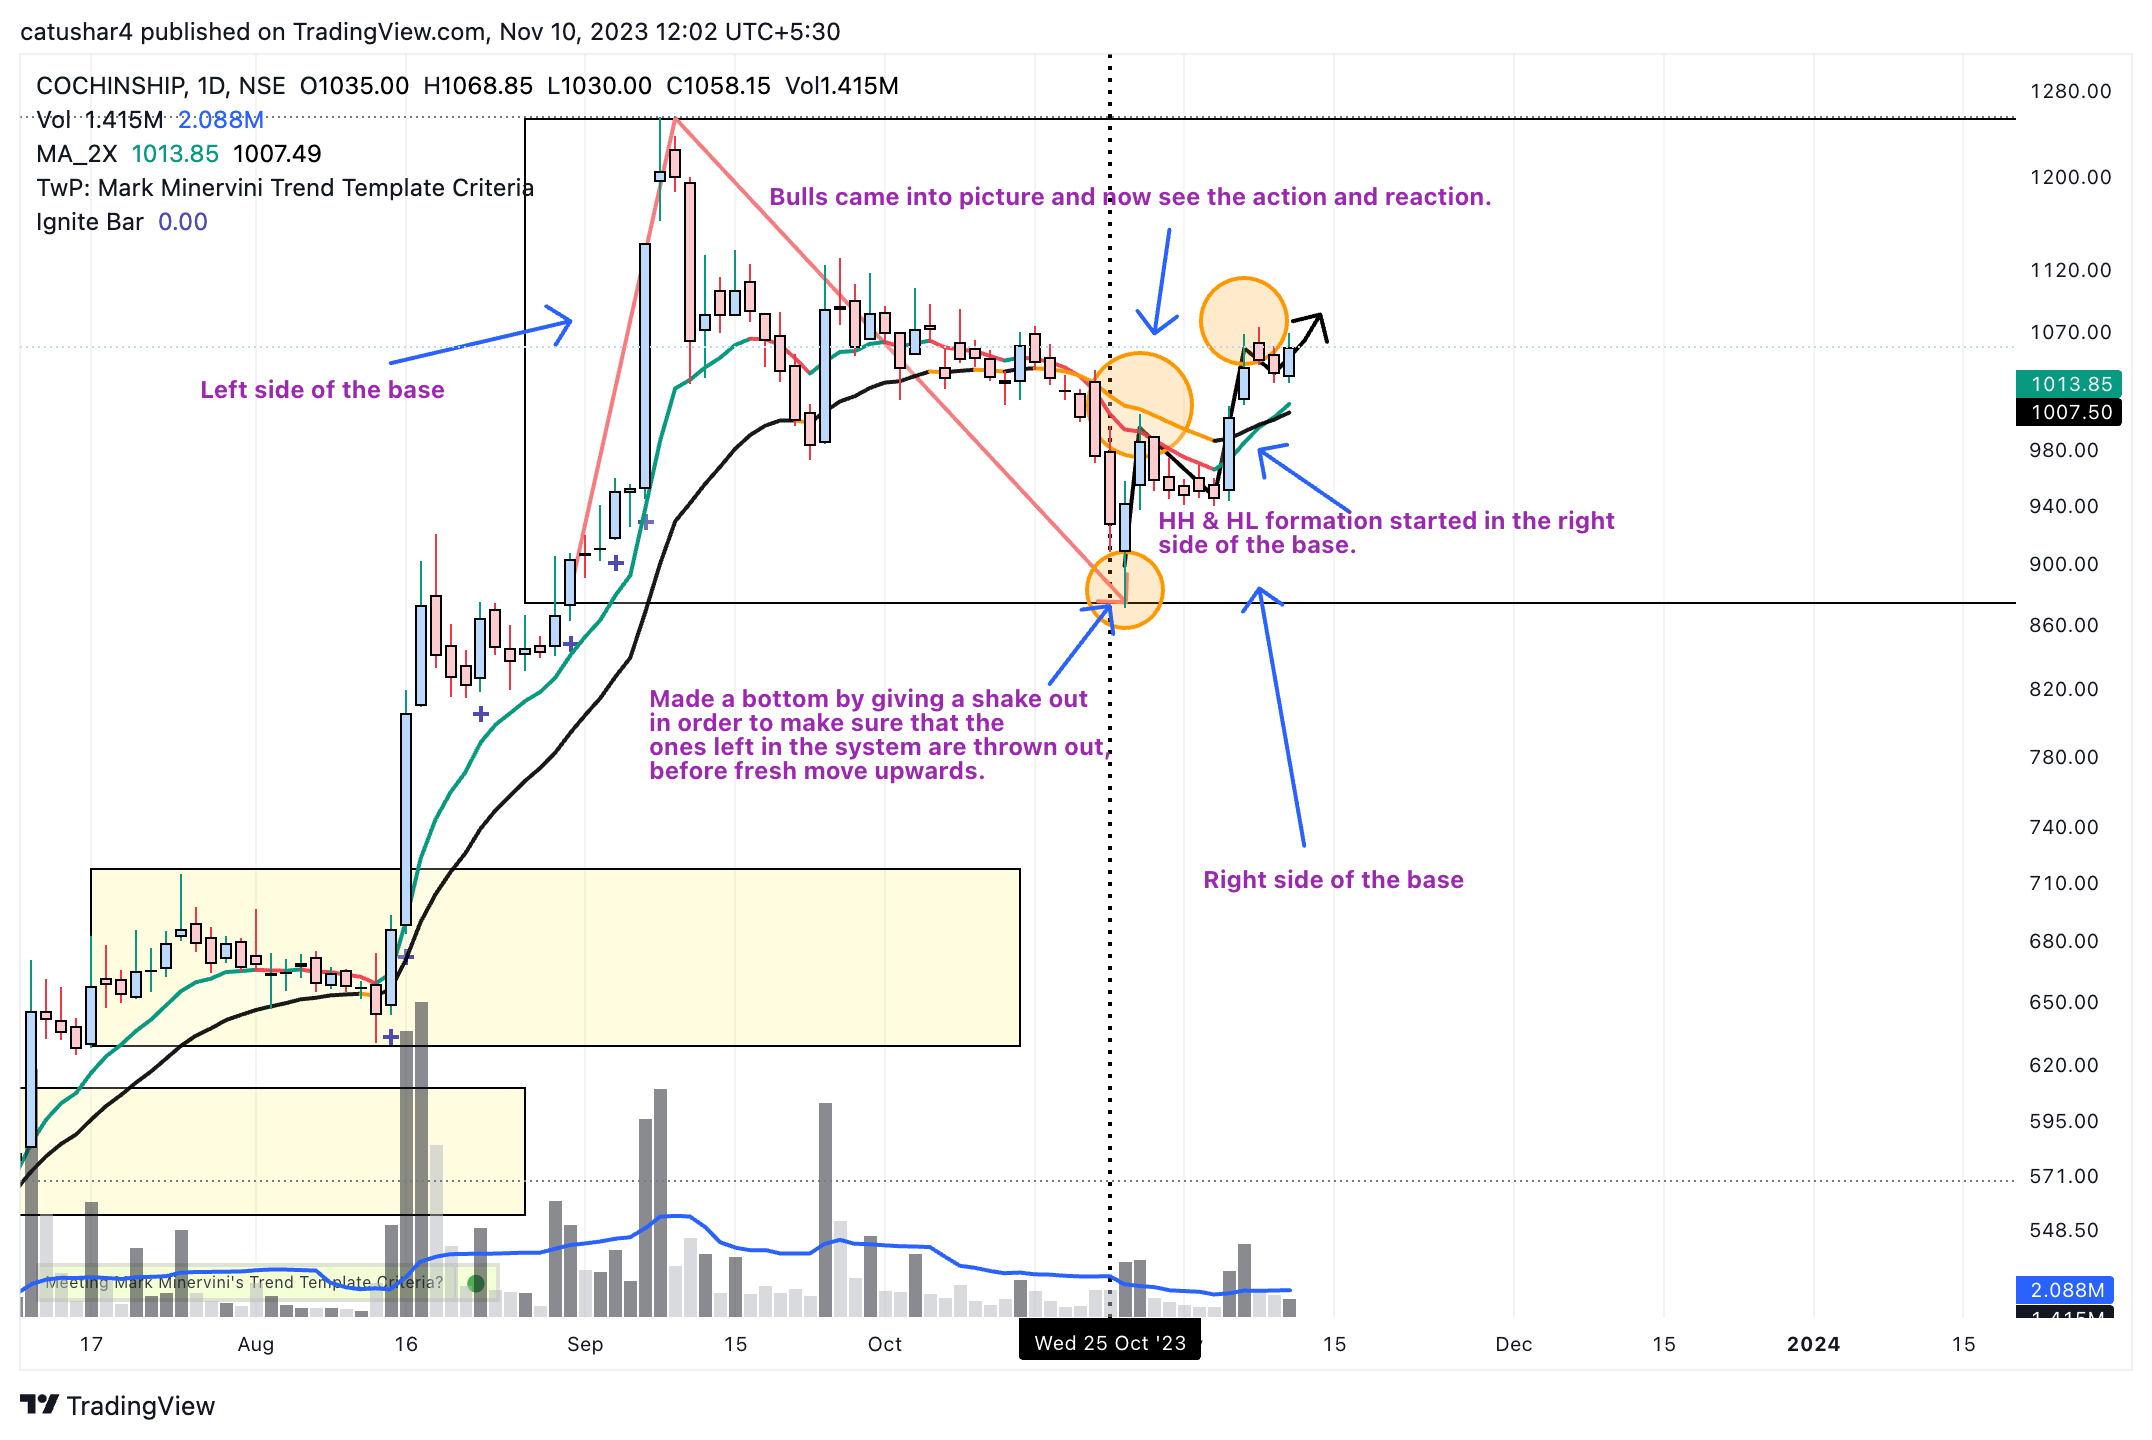
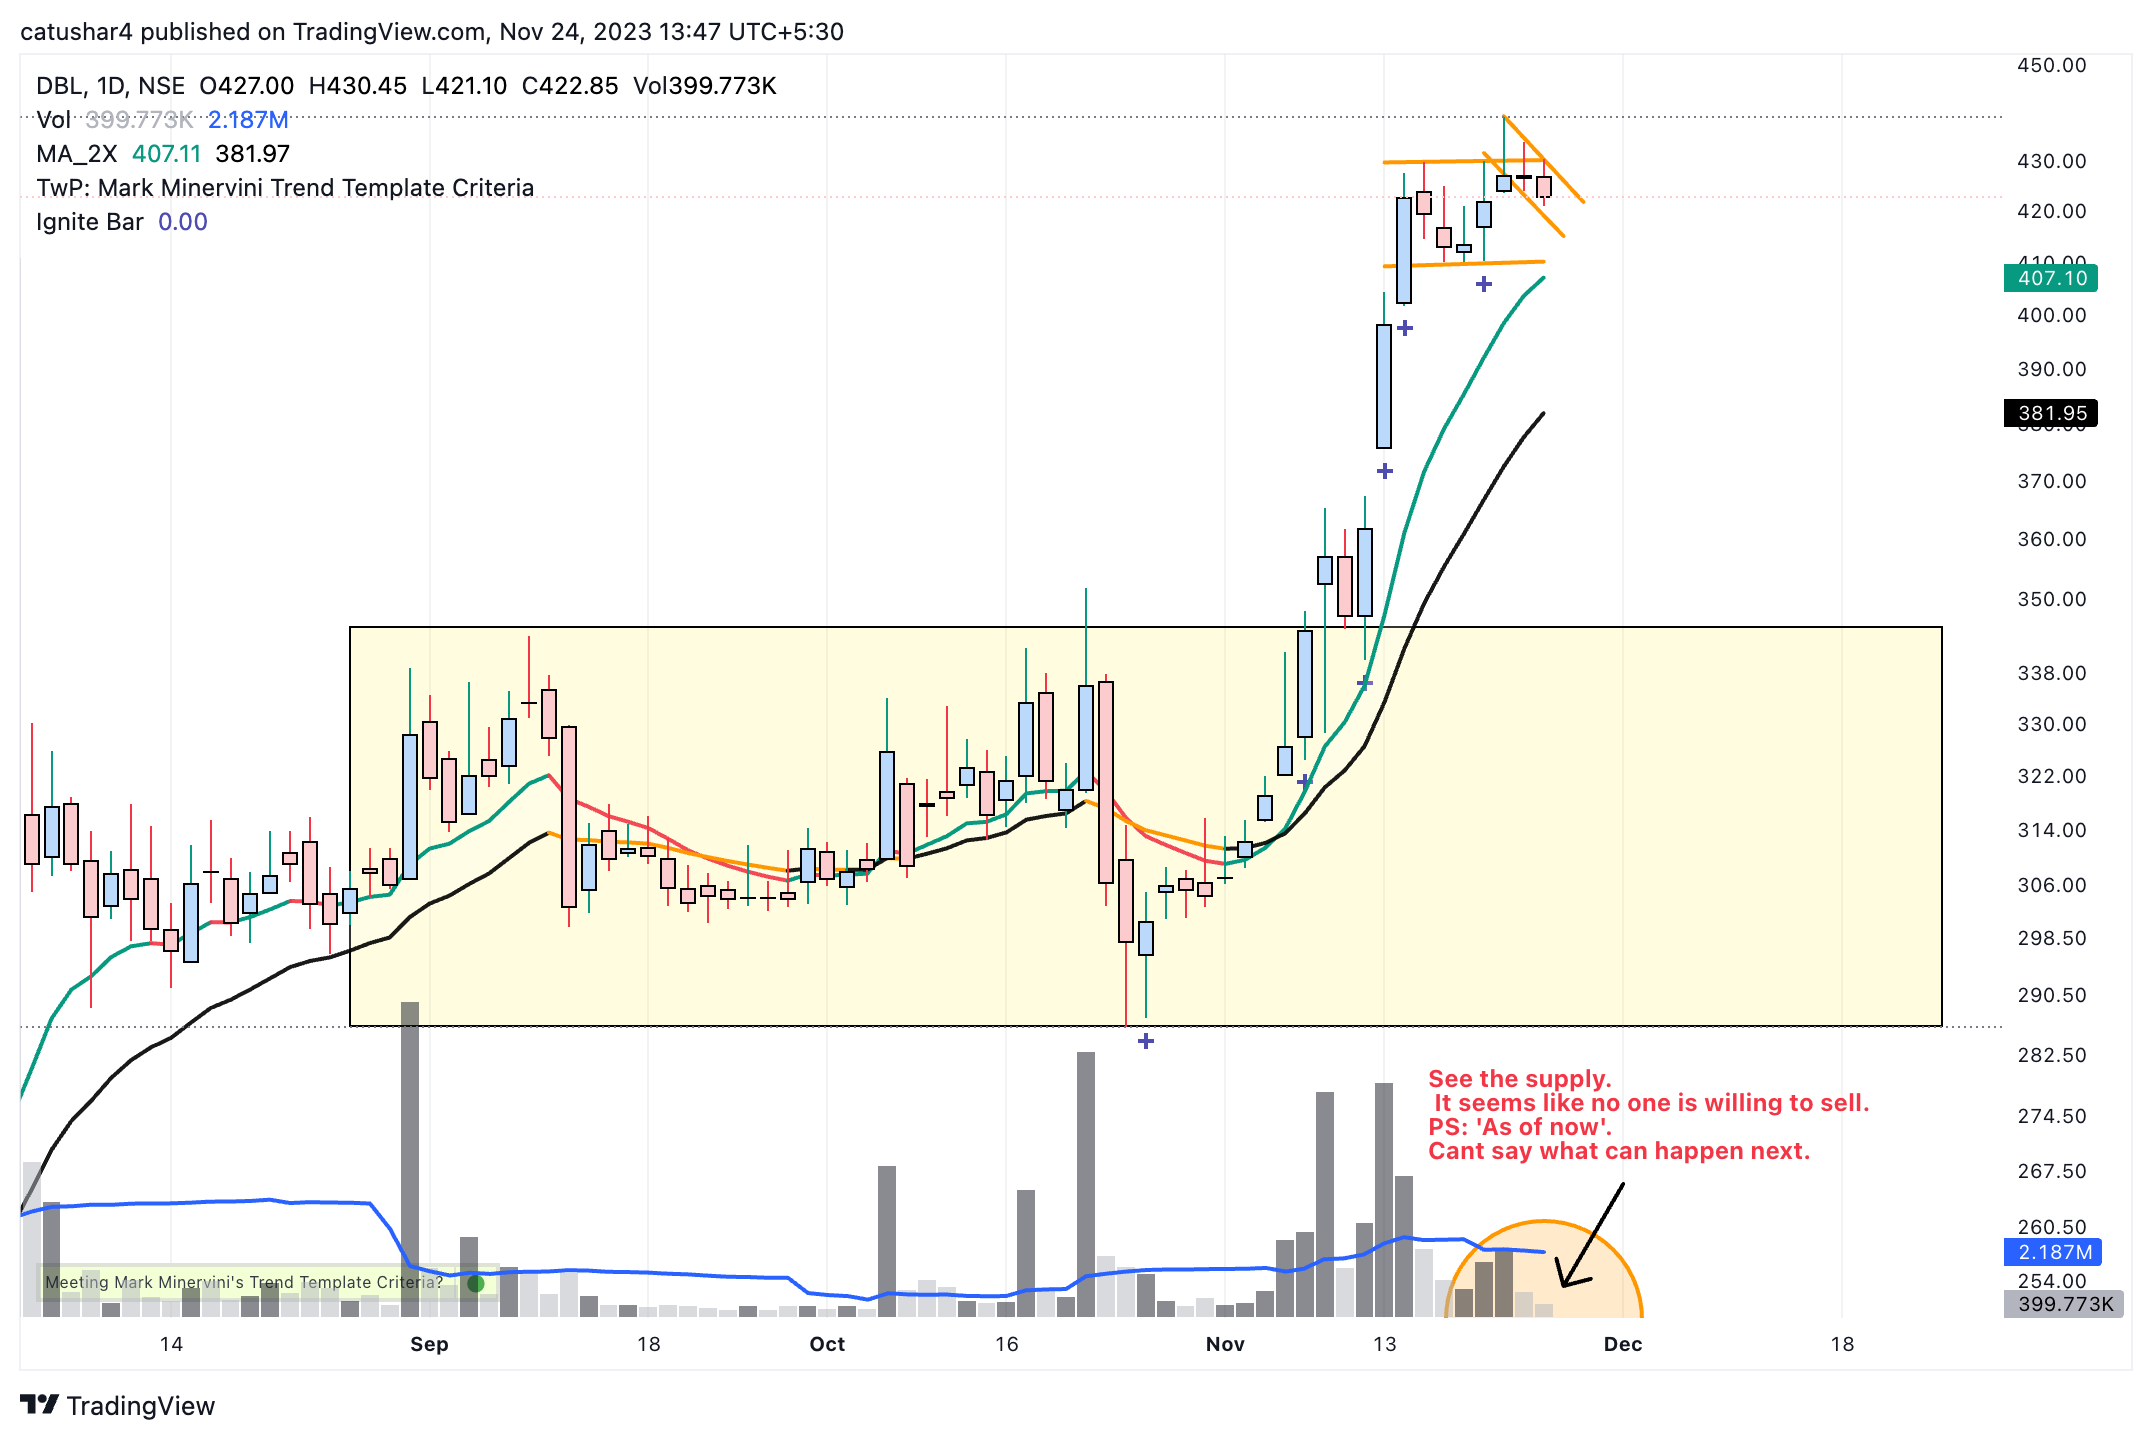
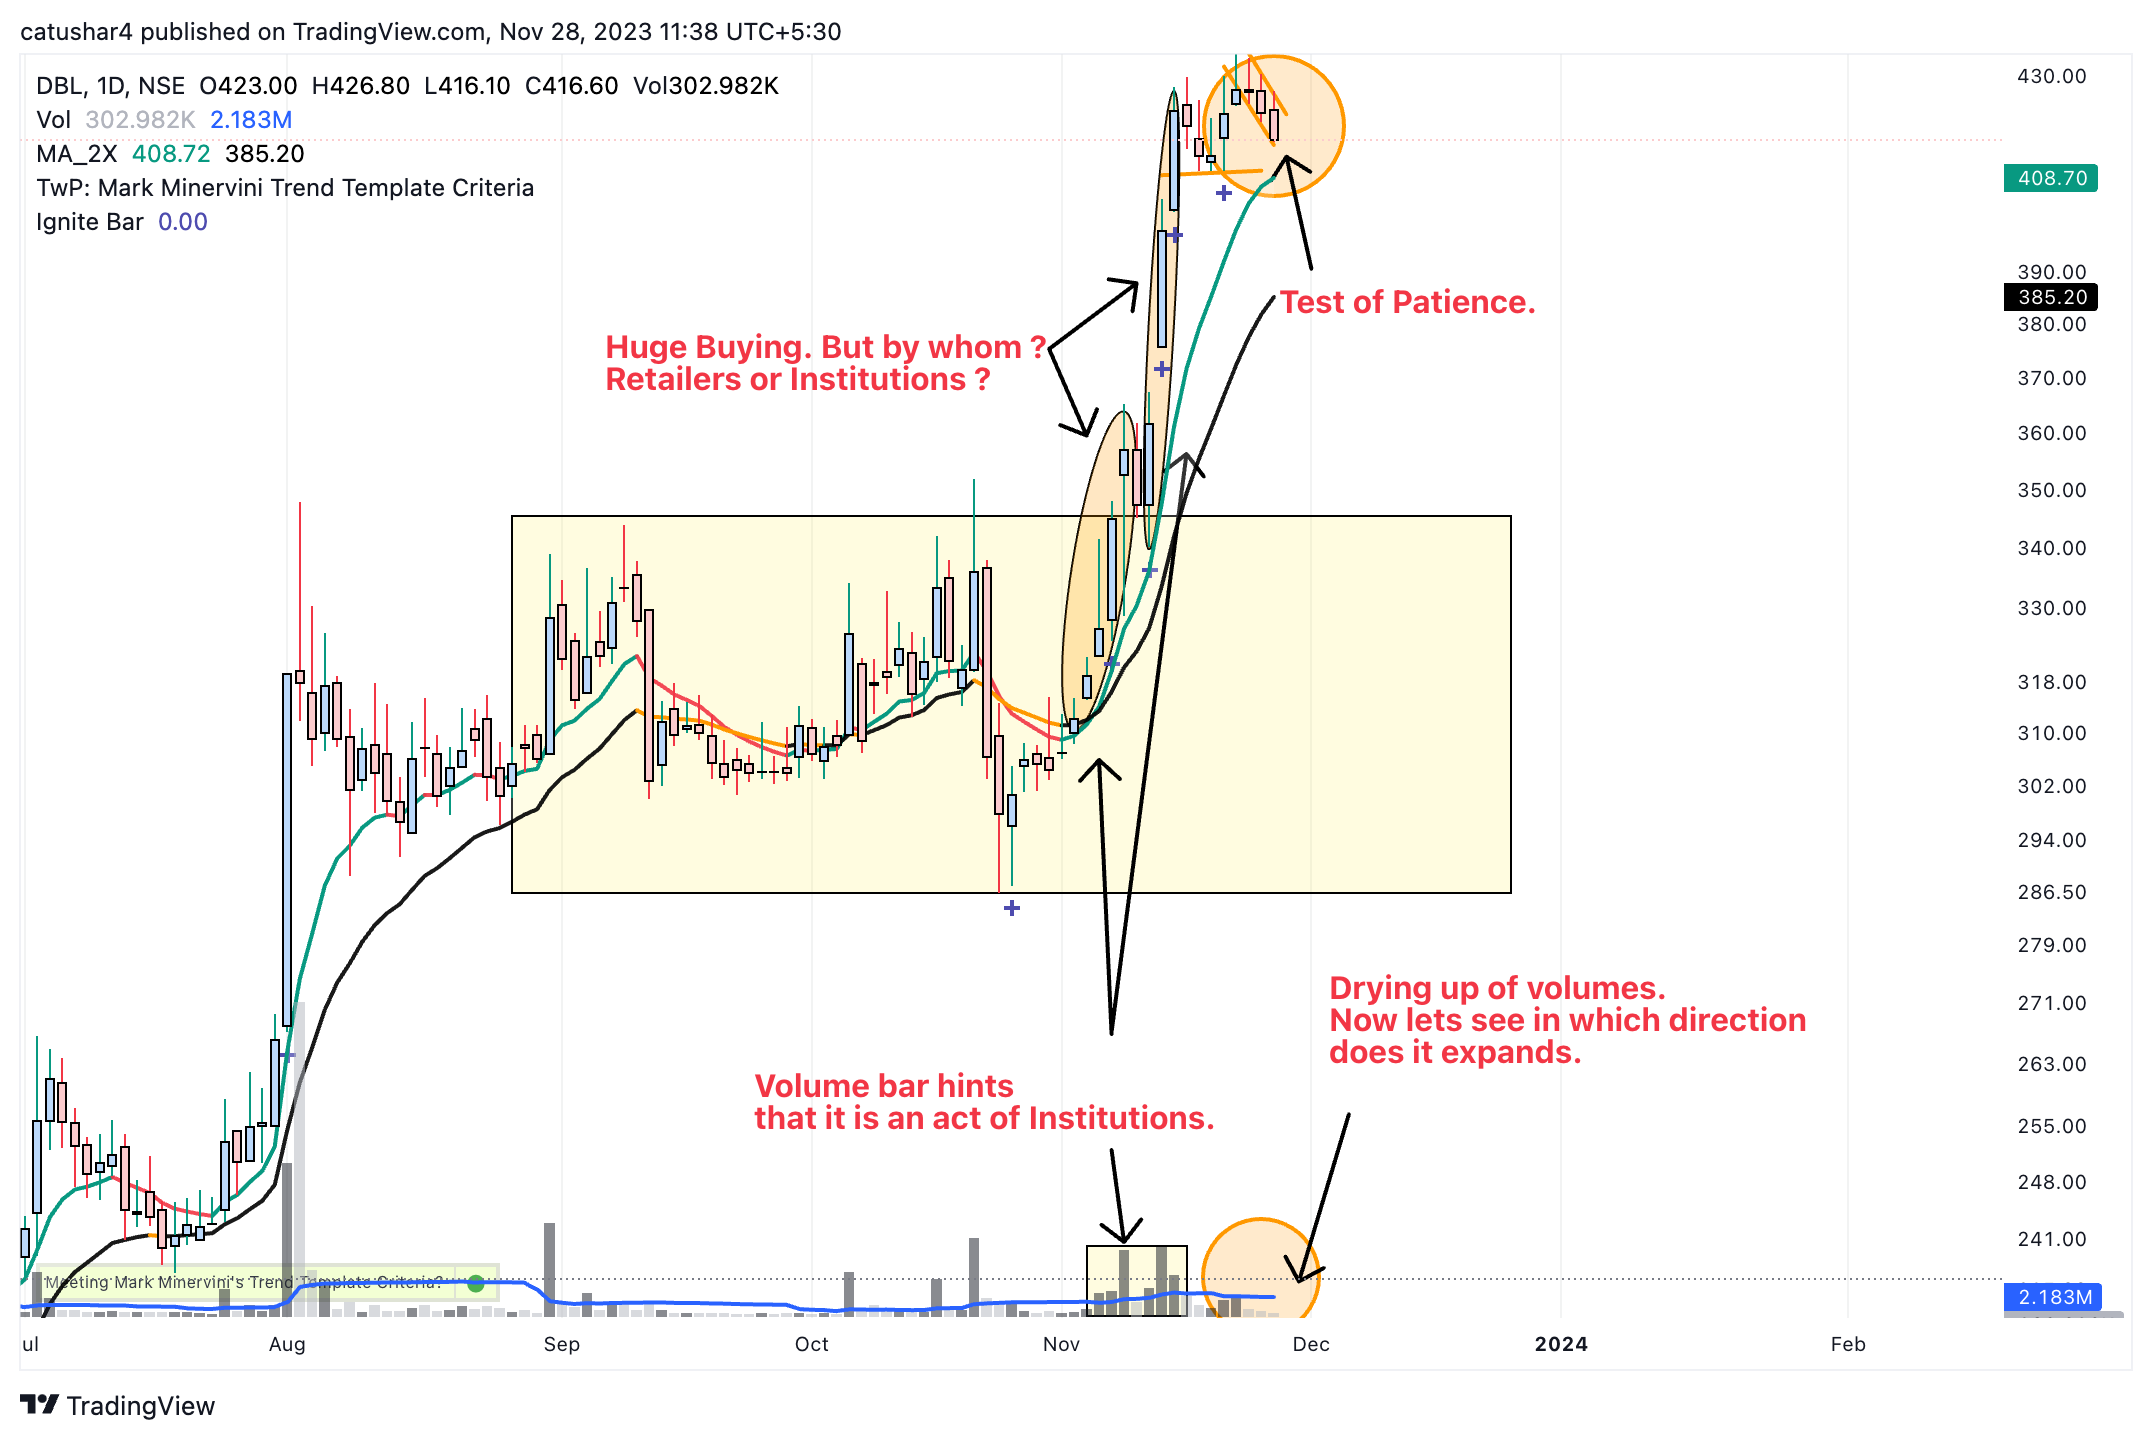
Maybe I am wrong, but I look at this price action in this way:
On 26 Oct it made the bottom of the base, by giving a shake out and started the right-side journey.
Between 31 Oct to 3 Nov, it made series of inside bars with very less volumes, as if institutions were absorbing the supplies left in the system.
On 6 and 7 November (follow through day), on good volumes. On 7th the volume exceeded the one on 6th Nov.
On these days it crossed its 10 20 and 50 dma.
On 8 and 9th Nov it again made inside bars (however on the back of medium volume), but the selling was not able to break the low of 7th Nov.
My only point and observation is the action of bulls on 6 and 7. And the reaction of bears to this action on 8 and 9, shows that strong hands entered this stock on 6 and 7 Nov and if these are strong hand, then they will fight hard and make sure that the levels of 6 and 7 Nov are not breached.
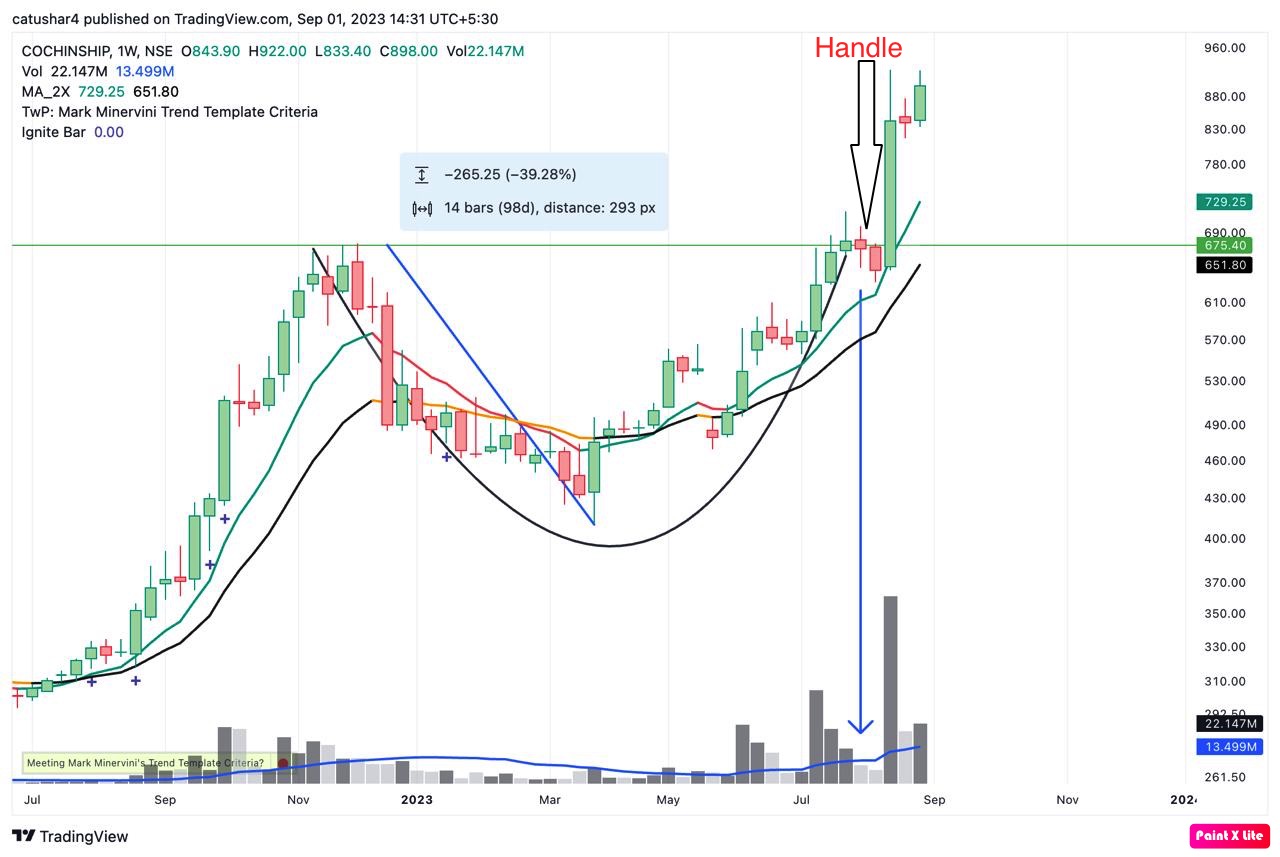
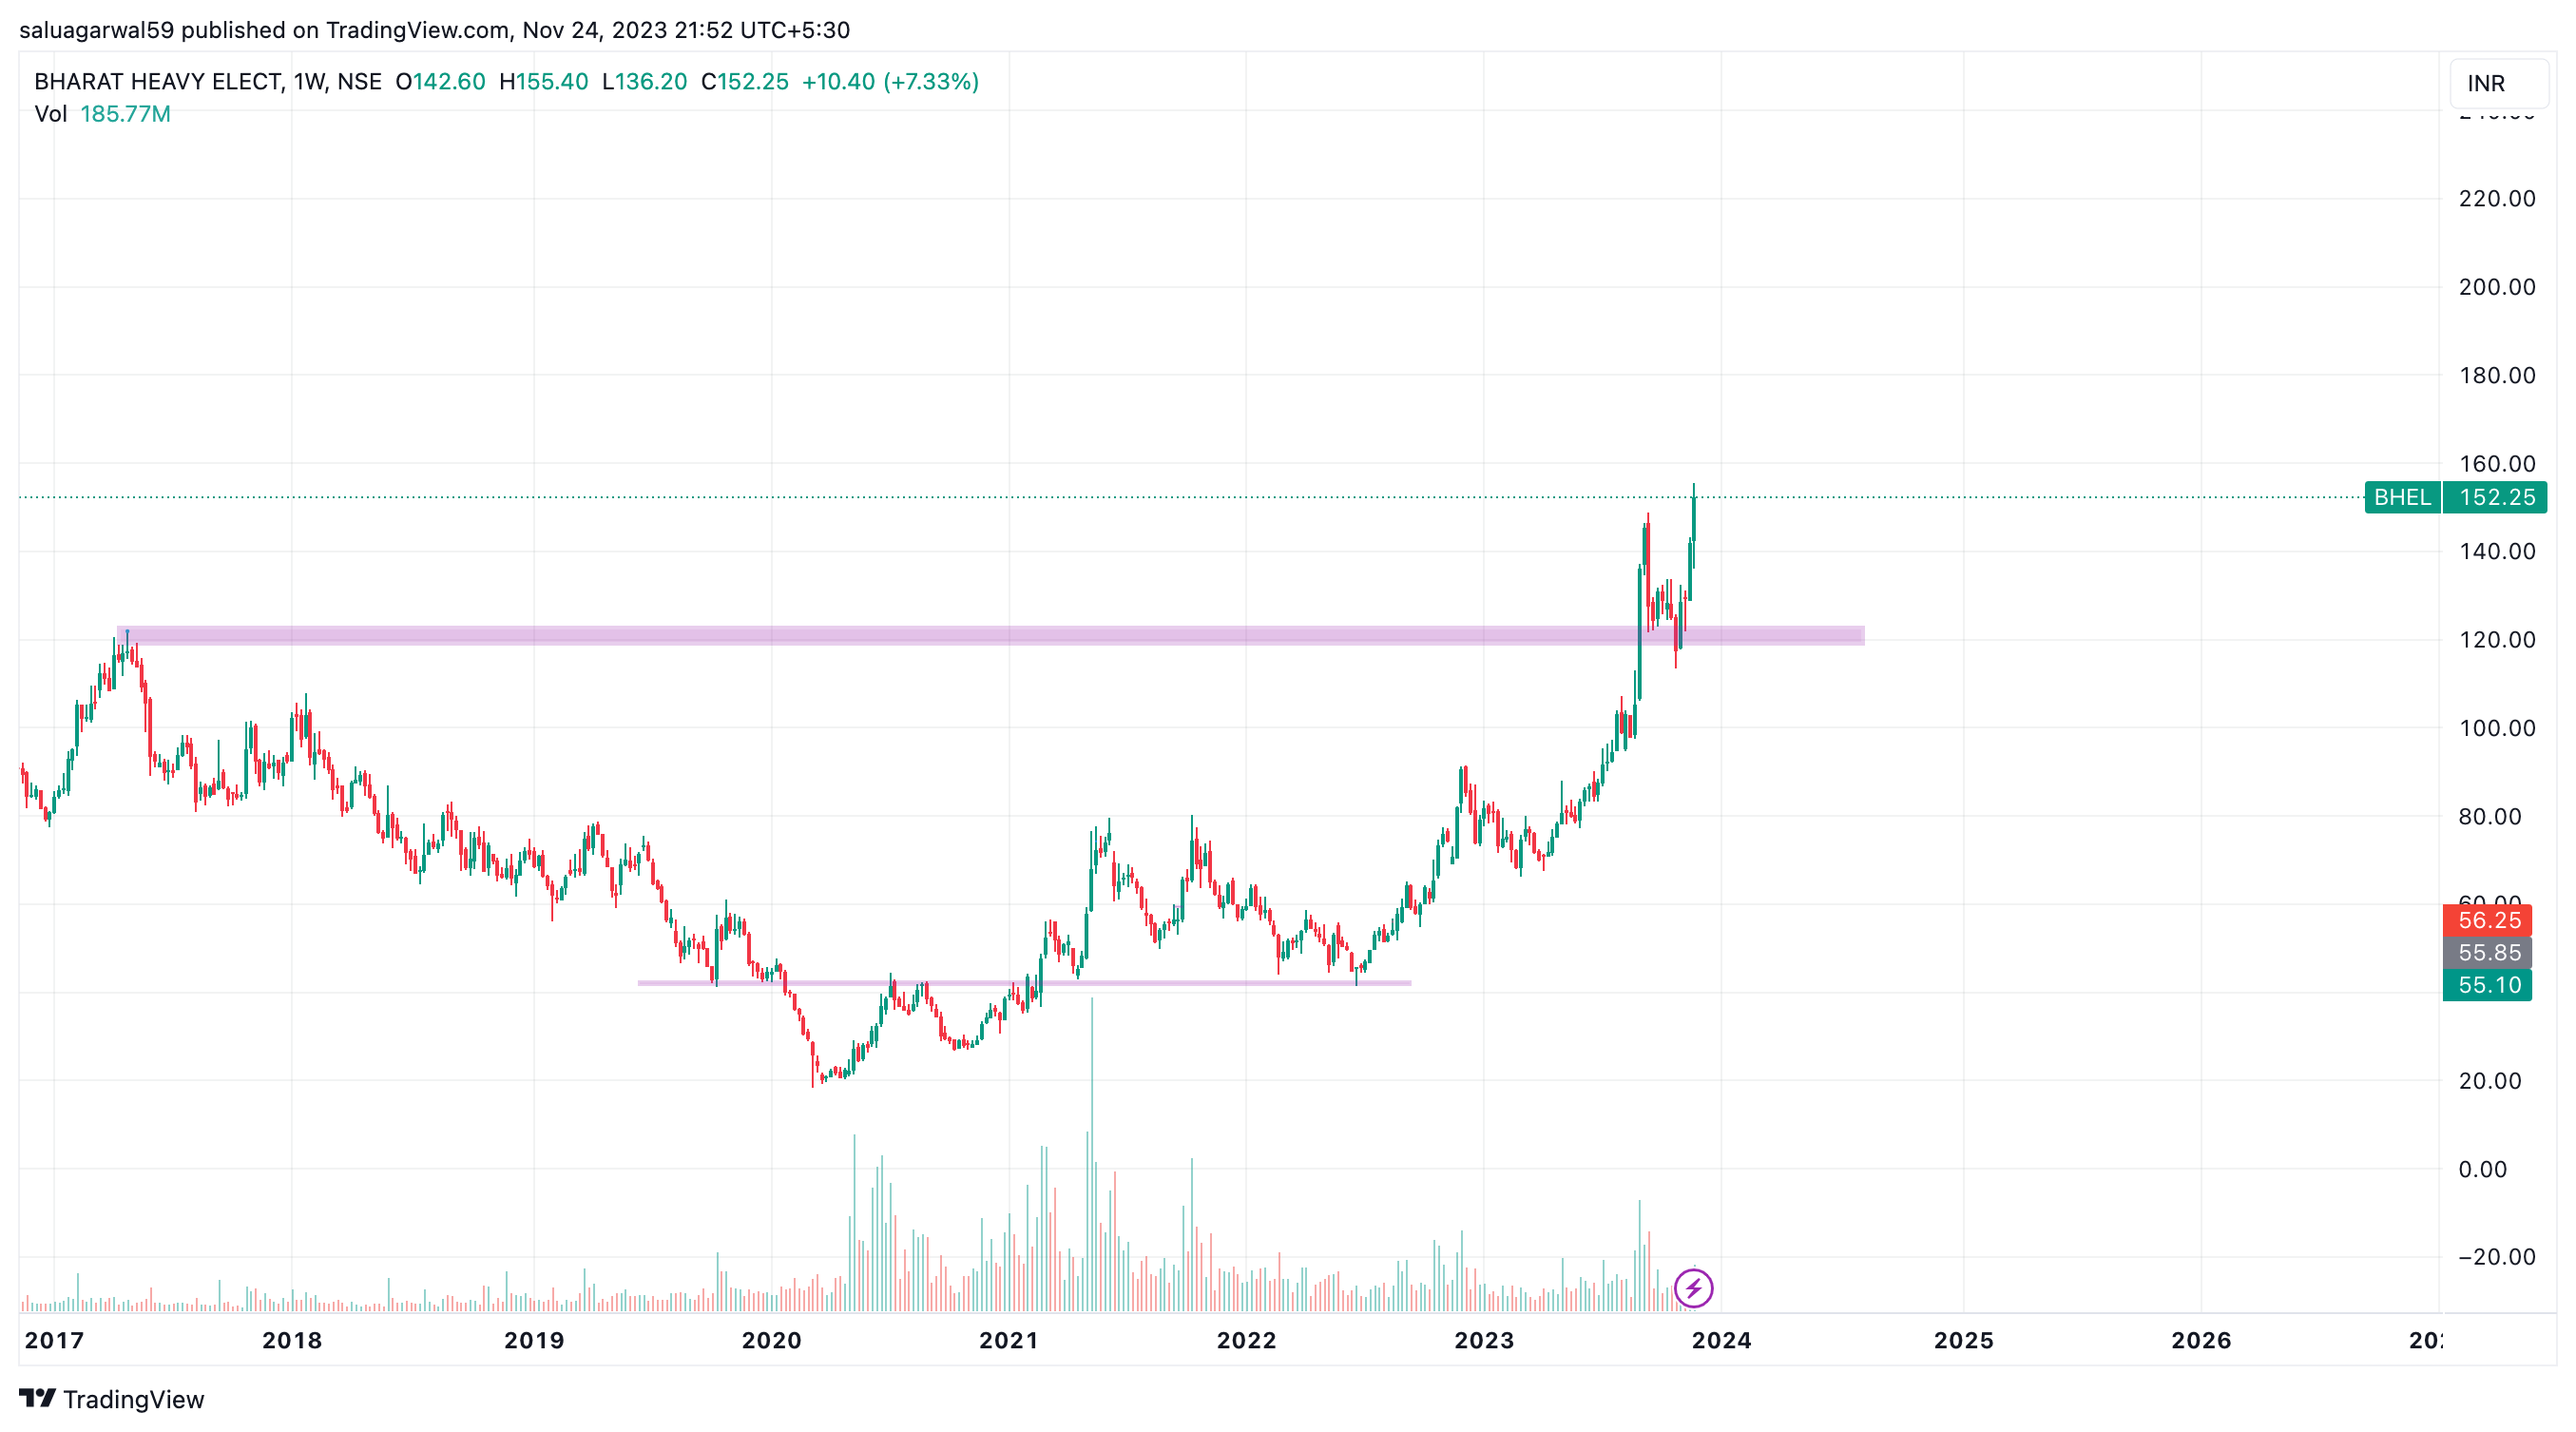
I have joined this esteemed forum last week, thus I had an opportunity to see various charts being posted on this thread. I saw some charts with ‘cup with handle’ pattern. So, thought of sharing one of an old chart wherein this pattern was formed.
Mr. William J. O’Neil’s in one of his best sellers explained this pattern. Thus, it is a small effort to bring out his book’s points vis-a-vis the description in the instant chart :
The depth should range from to the low of 12 to 15% range to upwards of 33%. However, in the chart it is around 39%.
Pattern must form a ‘U’ (ranging from 7 to 65 weeks) to make sure that weak hands are out of the stock. Also, it do not come to the attention of the speculators. In the given chart the U is of 35weeks.
The handle of the cup should take more than one or two weeks to form and should have a ‘shakeout’. In the chart the handle took 2 weeks with shakeouts.
Volumes may be dried up near the low’s in the handle’s price pullback phase. Observe the volumes in the chart (marked it with blue arrow).
Lastly, and a very important pointer to keep in mind is that the handle should be above the stock’s 10 WMA, as the handles that forms completely below the stocks 10 WMA are weak and failure-prone. Further, the wedging up or the side way handles have a much higher probability of failing when they break out to a new high. In the given chart the ‘Green” curve is of 10 WMA.
Does HCC fit your following mental model framework as explained in the attached PDF?
“BALANCE SHEET CLEAN UP : Aggressive focus on debt reduction as an
indicator of long term turnaround. Fund infusion from promoters, and external
investors instill confidence. Sale of assets, laggard low RoE divisions, free up cash”
Price behaviour and Price action along with demand and supply through volumes. Then I think there is no need of any fancy indicators which are available these days for technical analysis.
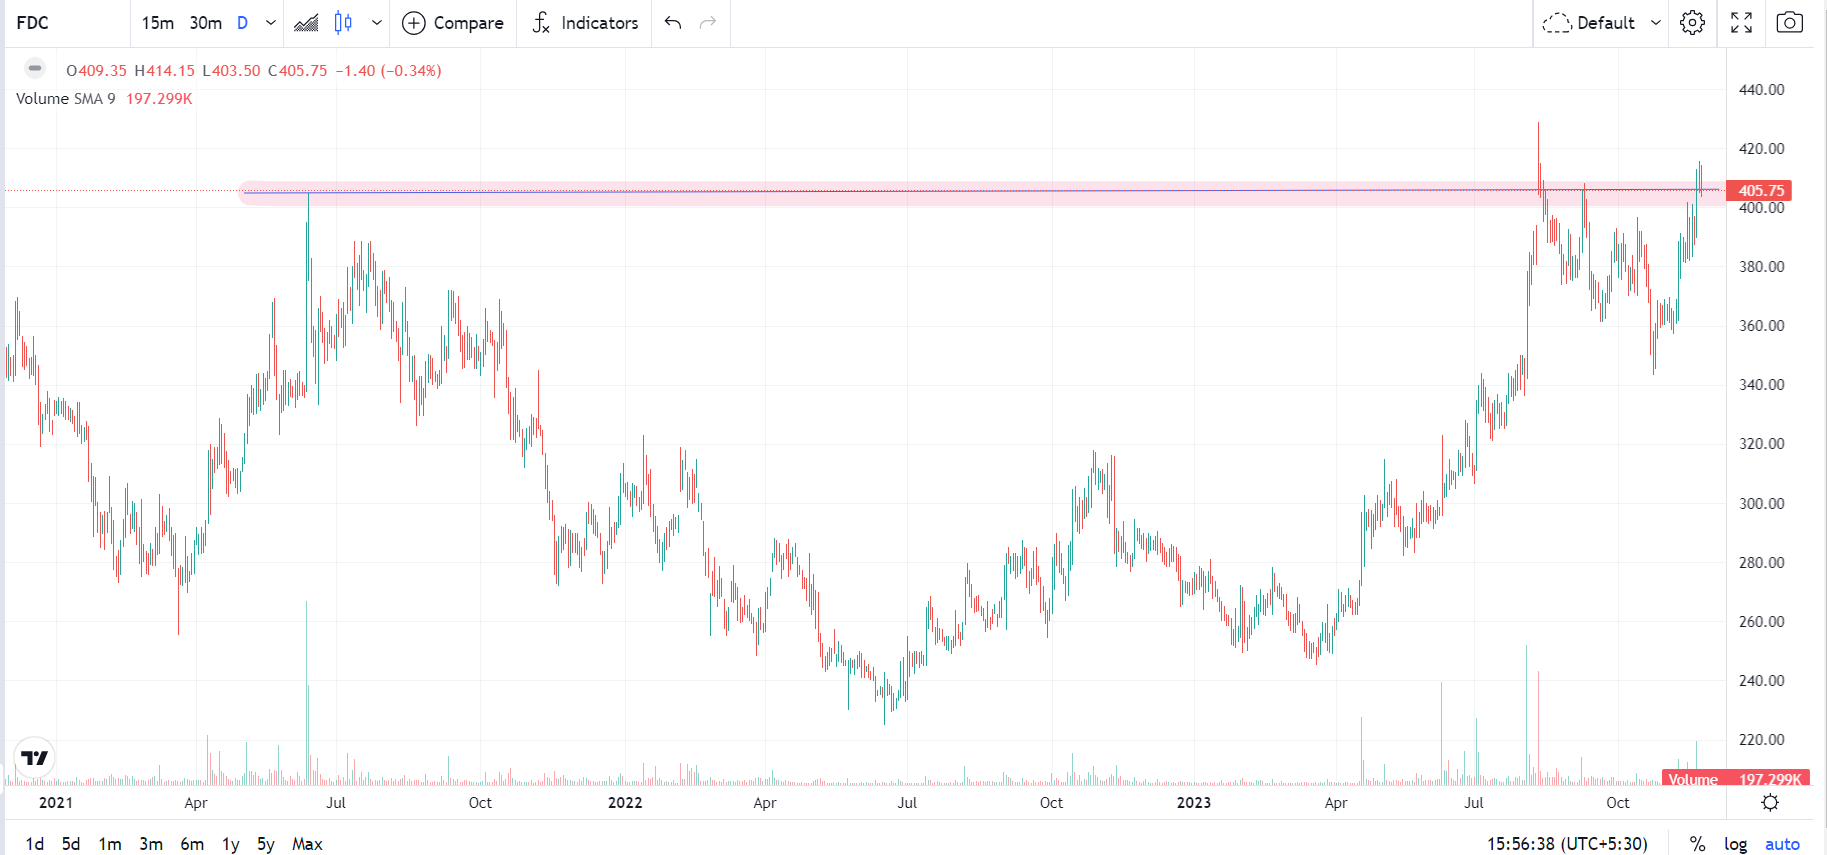
FDC Ltd is a leading fully integrated pharmaceutical company. The fundamental update of the business is available under stock opportunities, topic - FDC Ltd.
Technically the stock price hit an All time high in the month of Aug 2023 (swing high), its previous high was two years ago in the month of June 2021.
After hitting all time high in the month of Aug 2023 the stock price is consolidating as the company had announced a buy back at 500 rs per share. The Q2 results which were decent if one compares Y-O-Y. Recently the stock price has moved up after consolidation and formed a handle to the cup. The base of the cup was about 240 to 250 and the top was 405 to 410. If the stock continues its upward journey the target can be 550 to 560 rs.
Disclosure : Invested as a technical bet (not a recommendation, anyone contemplating investing needs to do their own diligence).
Hello Hiteshbhai, trust you are doing great. Today time techno promoters acquired 117938 shares. Indication of things to come in terms of restructuring process.
I haven’t tracked this promoter acquisition of time techno shares. But here according to latest concall a definite time line is given for sale of stake in overseas subsidiaries. And a rough estimate figure of 800 crores to be received for sale of 80% stake in these subsidiaries has been disclosed. While the number may vary a little bit here or there, it remains a significant number as compared to the debt 865 crores, as also the market cap of 3900 crores.
The key takeaway for me here is that management is walking the talk that they have been talking since past nearly 3-4 quarters. Which is reduction of debt by cash flows and subsidiary stake sale (material impact needs to be seen) , and improvement in topline and bottomline and improvement in return ratios (has been visible since past few quarters, more so in the latest quarter.)
Technically the stock price was stuck in a range of 140-160 from August 2023 to October 2023 and now has moved above this range. The current range of consolidation co incides with the distribution ranges when it fell down from all time highs of 232 posted in 2018. 115 to 165 was a big trading range during May 2018 to October 2018 and its upper range has now acted as a strong resistance and which has been overcome as of now. Next range of resistance based on same theory going ahead would be at around 180-185. And then final band of resistance of 220-230. If and when that is crossed, we can see strong moves. disc: invested as disclosed before and biased. .
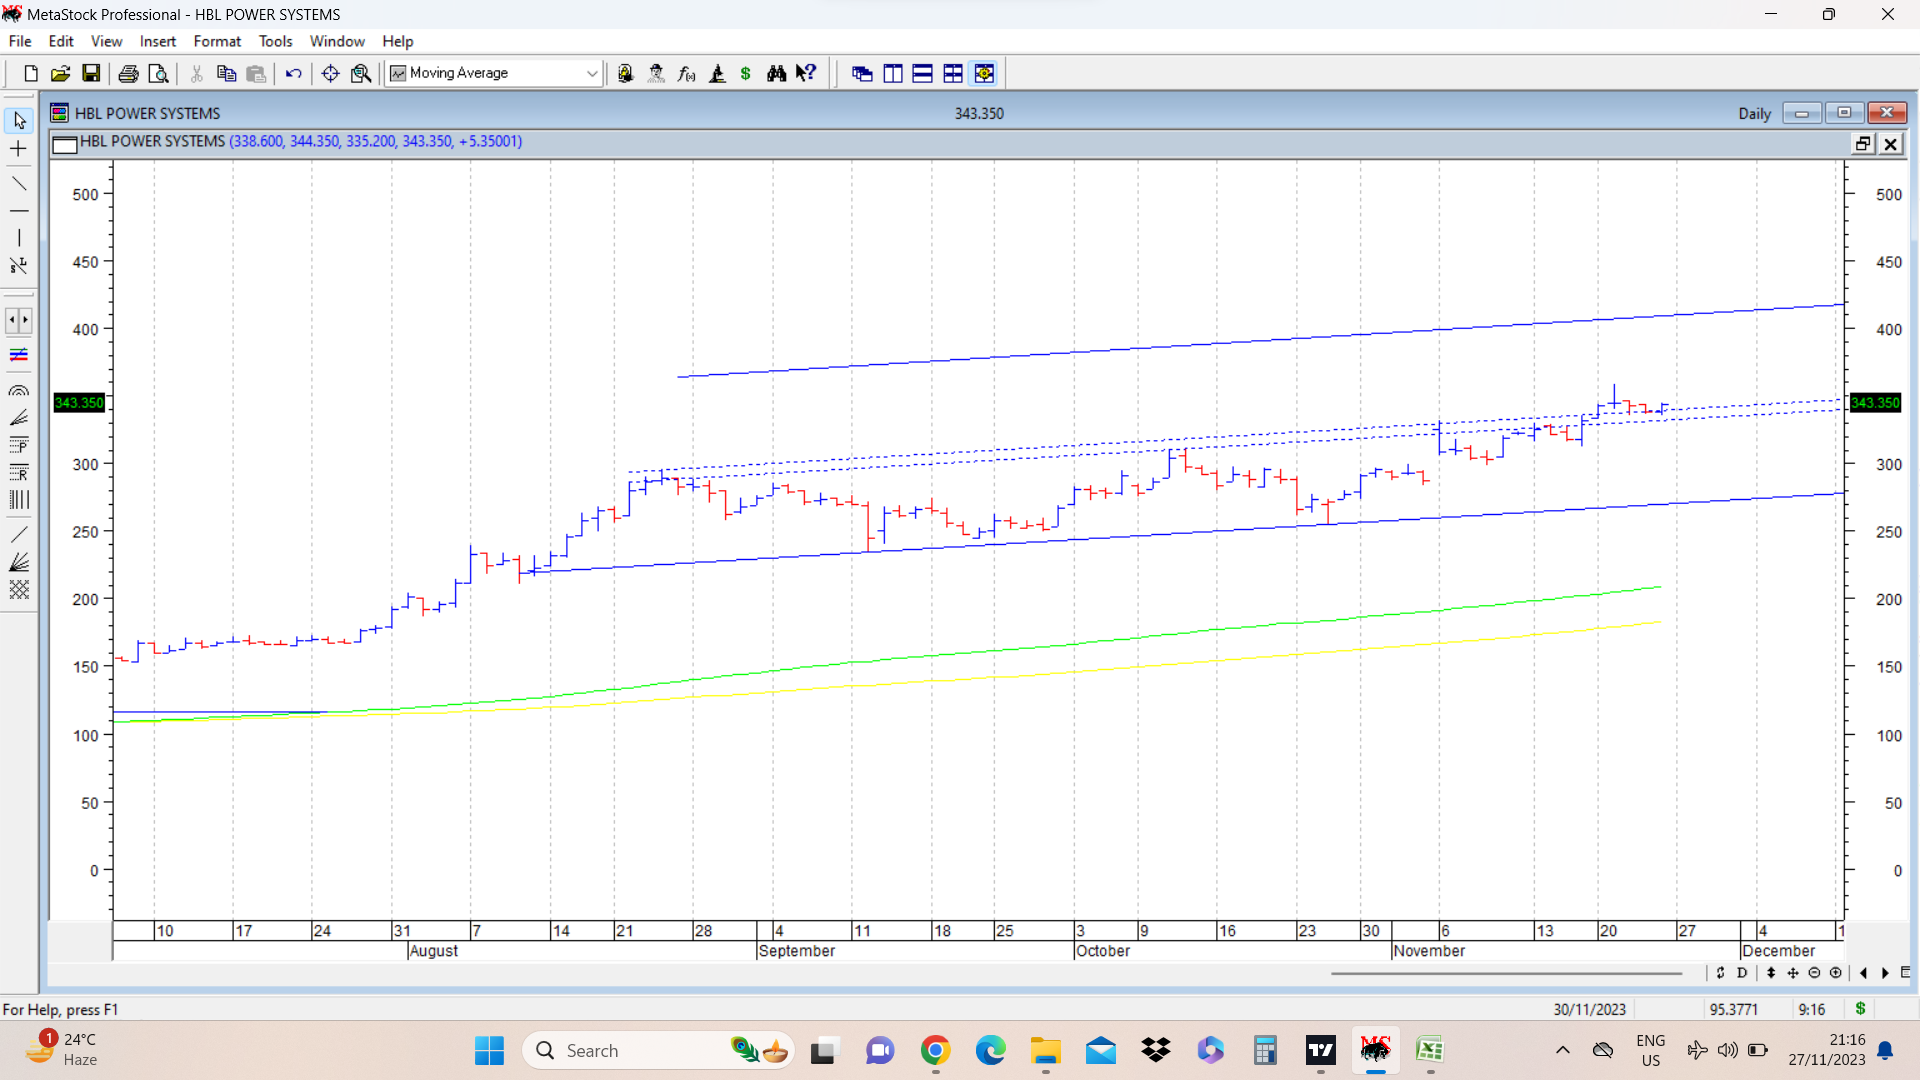
HBL power has been in an upward sloping channel since August 2023. I have marked the lower end of the channel by a solid blue line. The higher end of the channel has been marked by two dotted blue lines. And since past few trading sessions stock price has broken out above the higher end of channel and consolidating in a tight price range.
I have marked a higher parallel line in solid blue . This marks the upper end of another channel above previous channel. Height of both channels is same. This new channel marked on top of previous trading channel sometimes provides potential targets and indicates possible resistances. Will continue to monitor this chart going ahead for learning purpose.
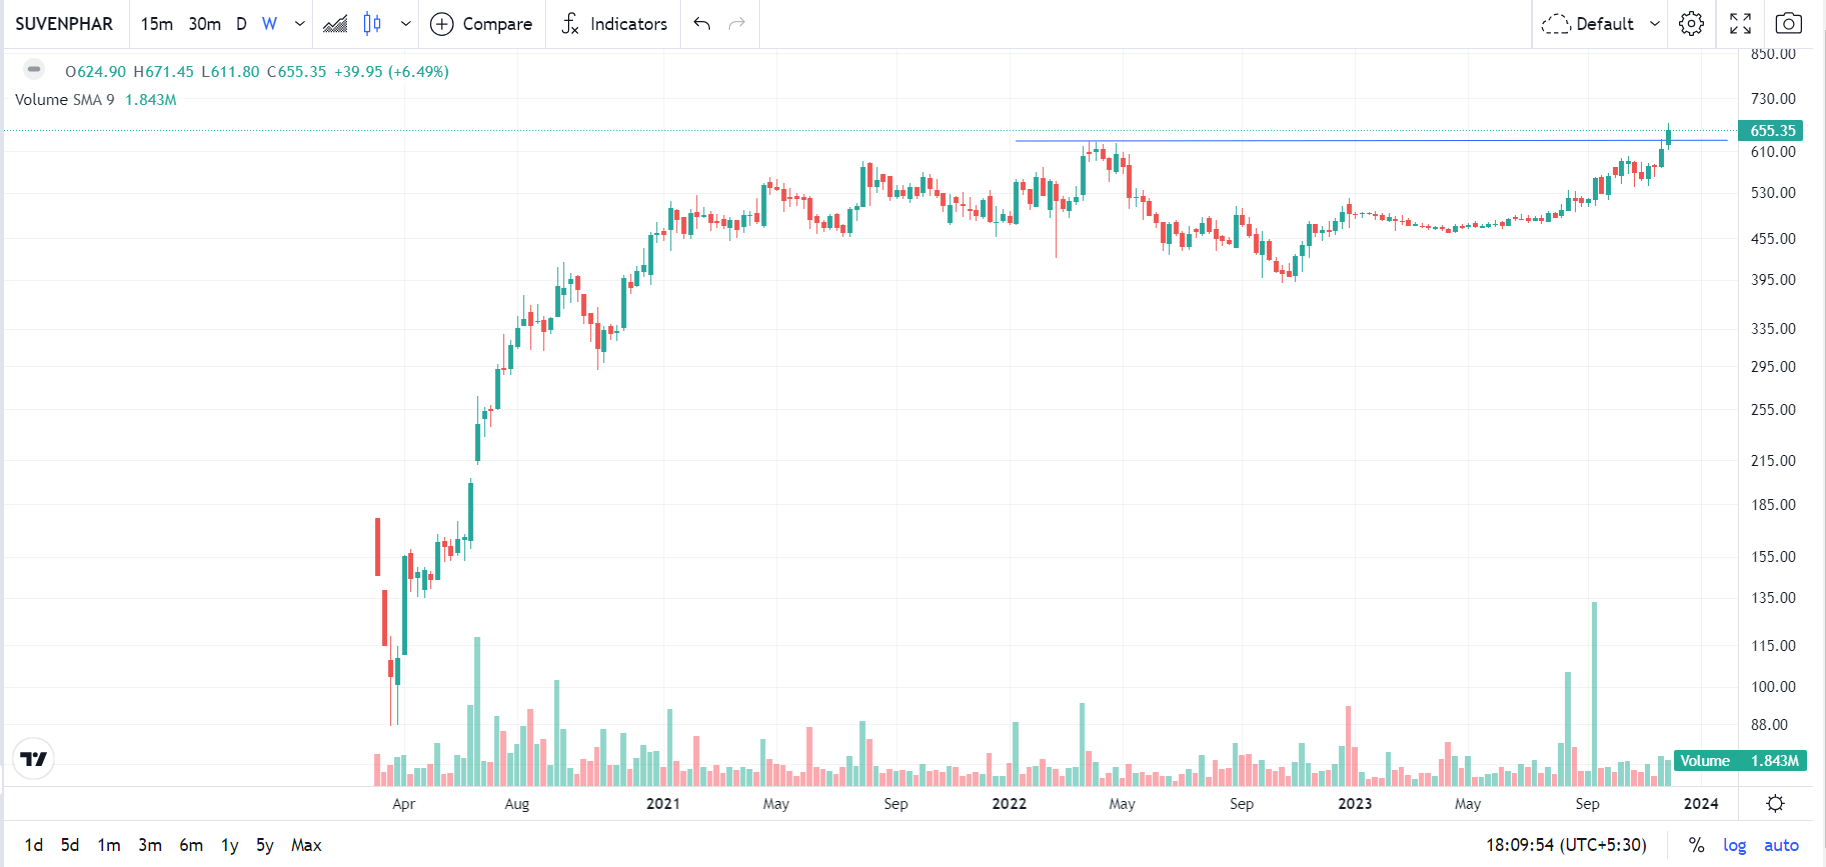
Suven Pharma has come out of 18 month consolidation, its previous high was 633 rs which was in March 2022 and it has recently closed above that price. The stock price today hit an All time high. During this consolidation, Advent acquired a 50% stake and its open offer (at 495 rs) concluded on Nov 03.
Disclosure : Invested.(not a recommendation, anyone contemplating investing needs to do their own diligence).