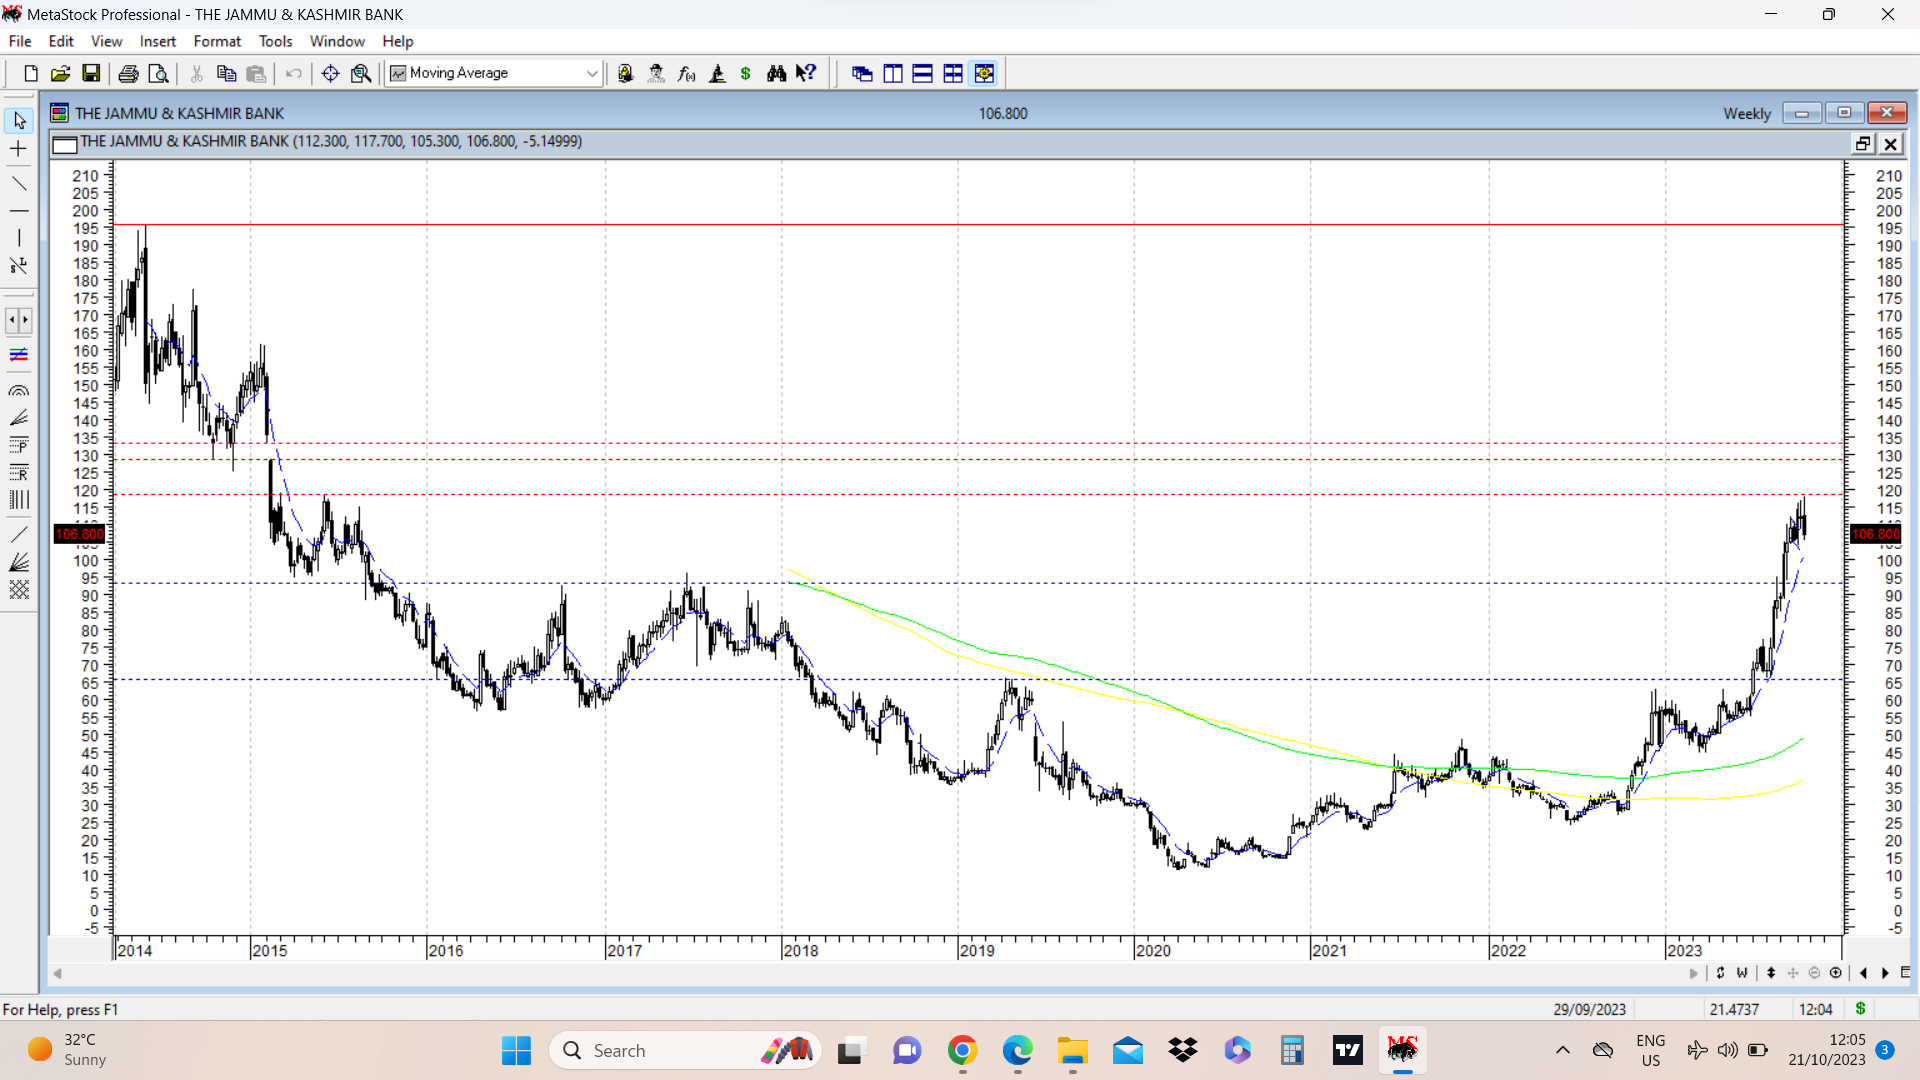
J&K Bank (cmp 107) chart posted below shows key resistances crossed at 66 and 93, marked in dotted blue horizontal lines. Structure on weekly chart is a rounding structure. On way up, key resistances are marked in dotted red horizontal lines at 118.50 and a weekly gap down area of 128-133. And finally previous all time high of 195.
Company posted good quarterly results yesterday, press note of which is attached. disc: invested. (not a recommendation, anyone contemplating investing needs to do their own diligence)
JK Bank q2 fy 24 press release.pdf (281.7 KB)