

RACL on a daily TF.
After going registering an all time high last month, it was moving in channel (a downward flag like formation) and has shown good up-move in last 3 sessions followed with high volumes.
1 Like
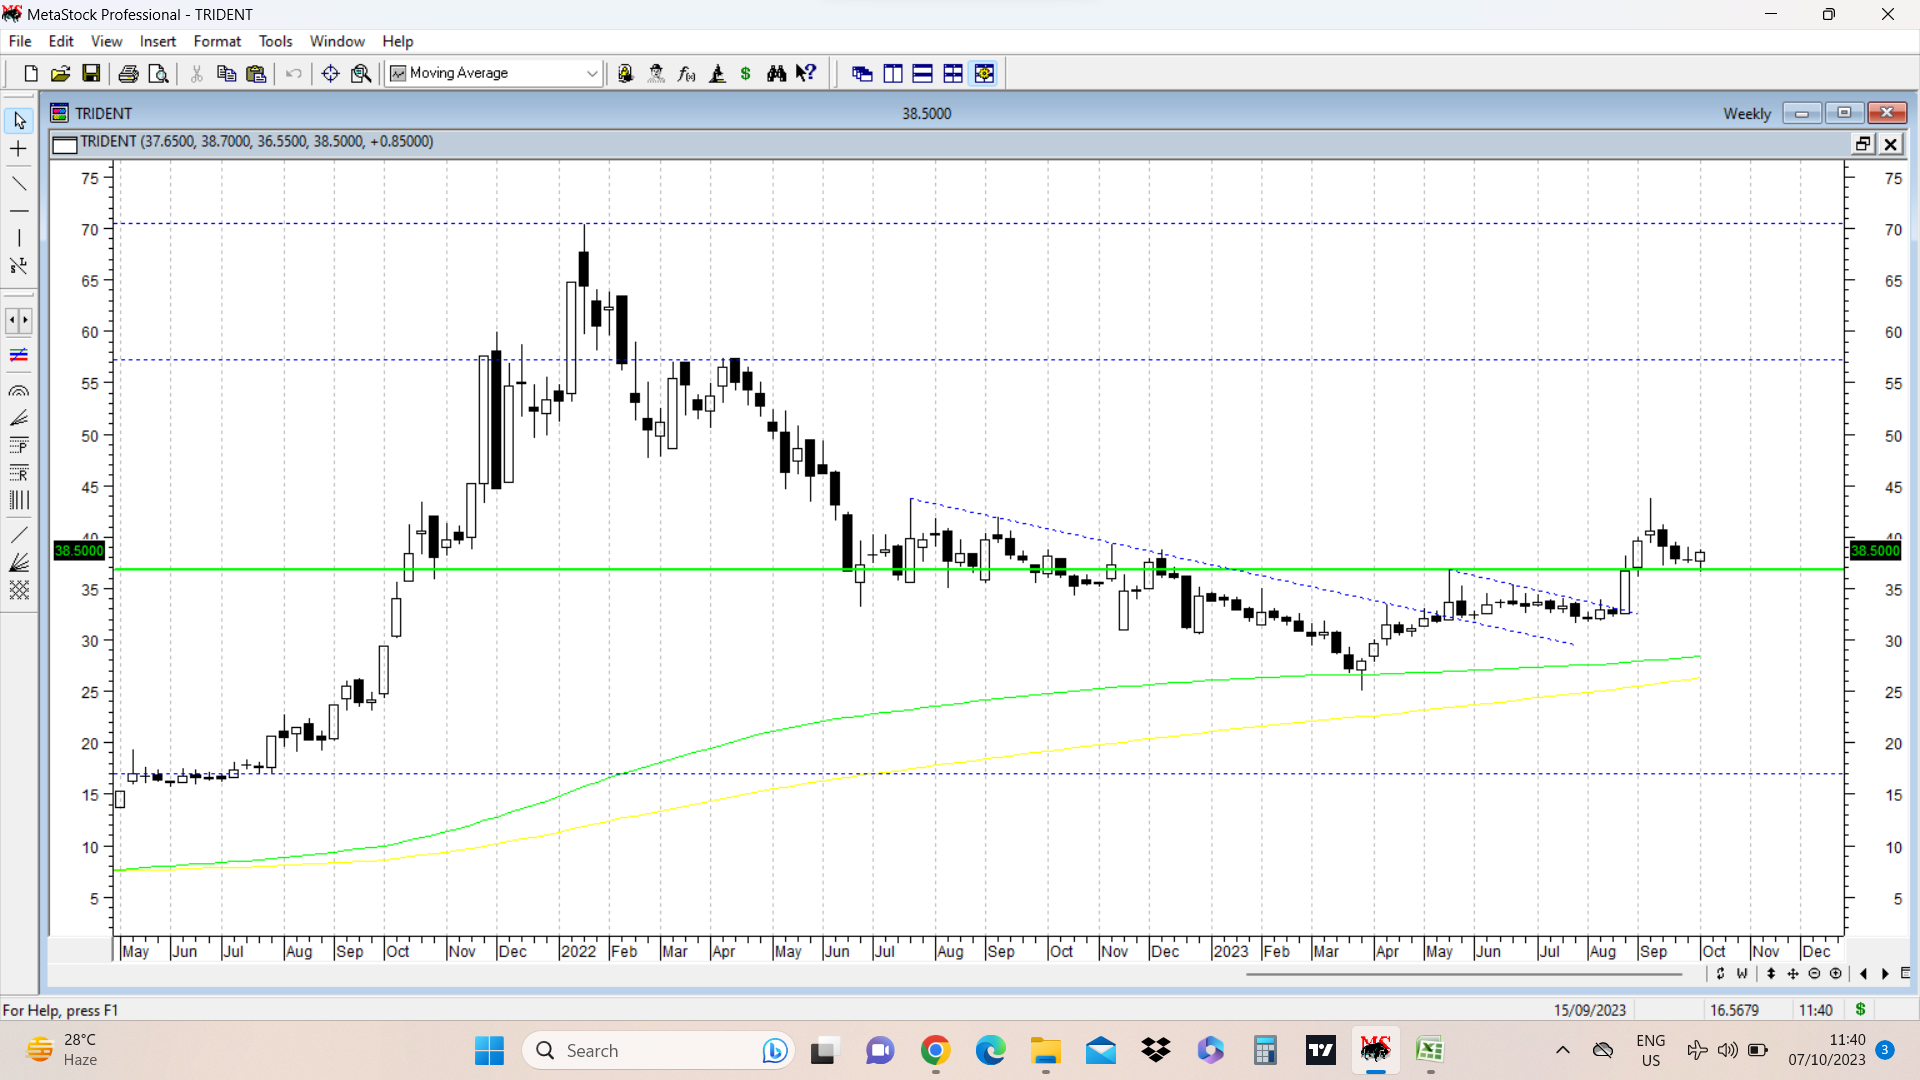
Trident had an amazing run in 2021 when stock price went up from the levels of around 17 (marked in dotted blue horizontal line) in July 2021 when the above chart was discussed to a high of 70 in Jan 2022 ( 4 times in around 6 months) . Since then it went down along with other textile companies and posted a bottom at 25. This down move took nearly 14 months from Jan 2022 to March 2023. Since then it is attempting another upmove.
The beauty of the chart put below is its simplicity. Just two dotted blue sloping lines drawn to show breakout from falling trendline. In the latest upmove, stock price went up after breaking out above 37 to post a swing high of 43.75 and started correcting. Now after retest of breakout level of 37 (marked in solid green horizontal line) it is showing strength.
On candle sticks last week was a doji candle with a higher upper wick. This week it was a bull candle with a weekly low at 36.55 and closed at 38.50. The low for the week is very close to a previous major breakout level and at 61.8% retracement to entire previous rally.
Going ahead, levels of 36-37 are key support zones to be watched and key resistance at 42-43 levels. If and when resistances are taken out, we can see a good rally.
disc: I have taken a trading position at around current prices based on above technical picture with clear cut stop losses in mind. ( not a recommendation, please do your own diligence if you consider buying. )
16 Likes
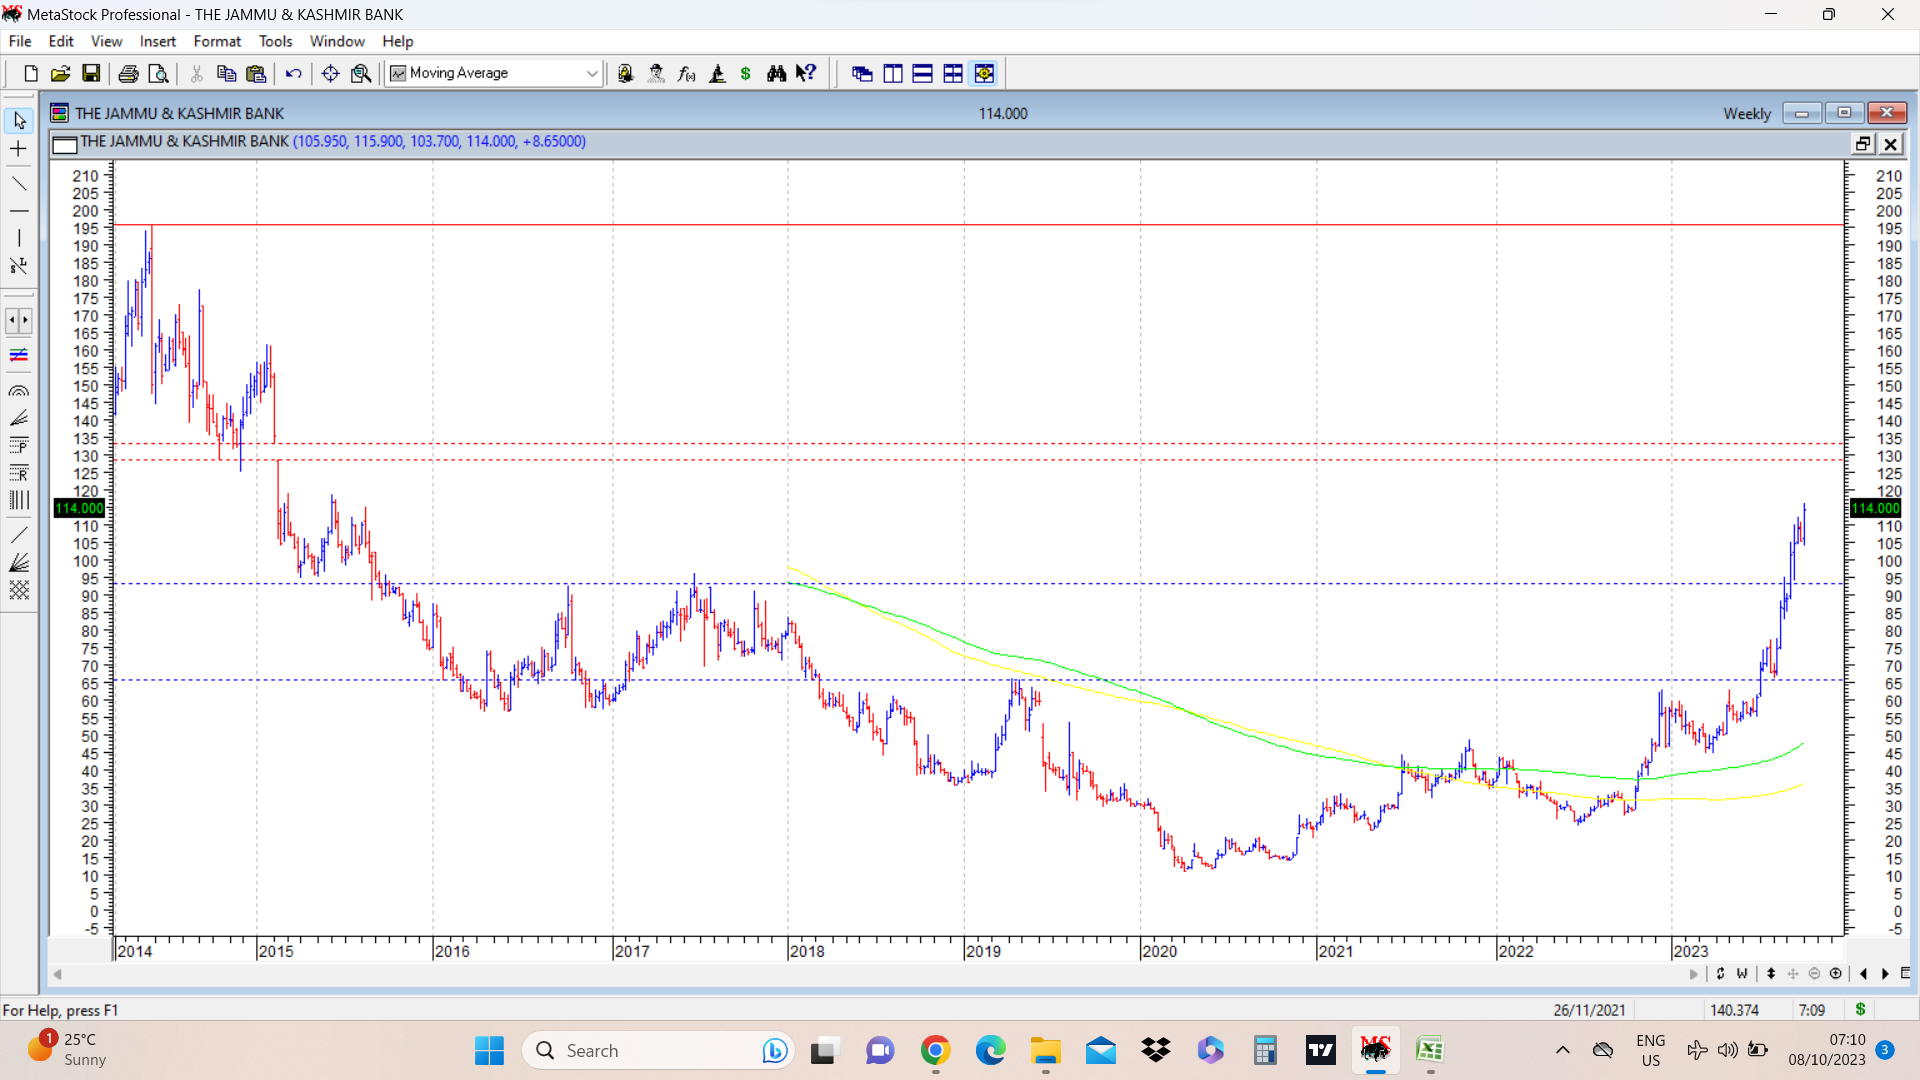
JK Bank chart was posted above in August 2023 when stock price had crossed key 5 year high of 66, and stock price was quoting around 70. A higher resistance at 93 was marked on above chart.
Since then stock price has managed to cross resistance of 93, which happened to be an 8 year high. On daily charts, stock price was consolidating between 103-110 for 3 weeks and last Friday gave a breakout above this range and closed at 114.
Overall we can see rounding structure on weekly charts. On the way up there can be a resistance at falling gap levels (marked in dotted red lines) at 128-133. And above that all time high levels of 195 remains the key monitorable level.
disc: invested as disclosed before. ( not a recommendation, please do your own diligence while considering investing in this company. )
17 Likes
Hello Hiteshbhai, It is indeed a great chart combined with fundamentals, I looked at union bank as well forming similar pattern. NIMs in line of 3% + inline with other better performing banks. Here I looked at FII and DII increasing holding significantly. Does increase in holding by FII / DII play in your process as well? Would be good to know. Again with these banks, majority is owned by government. It is a double edged sword , i.e. if govt goes for OFS than it can derail the story , however with very less float if these banks keep doing well , these stocks can potentially do very well.
While analysing any company, and taking position, my two main focus areas are fundamentals and technical charts. All other factors like DII/FII, other marquee investors holding, or any other such factor usually is only of secondary concern.
With govt companies, if the holding is more than 75% , then there is a risk of FPO/other forms of stake sale coming through in due course of time. In case of Union bank I think there was some kind of equity dilution few weeks back at around 87 and at that time there was temporary weakness. This was followed by a strong upmove in line with other PSU banks. In the near term the moves in these PSU banks seem a bit overdone, so I think there might be a bit of consolidation.
5 Likes
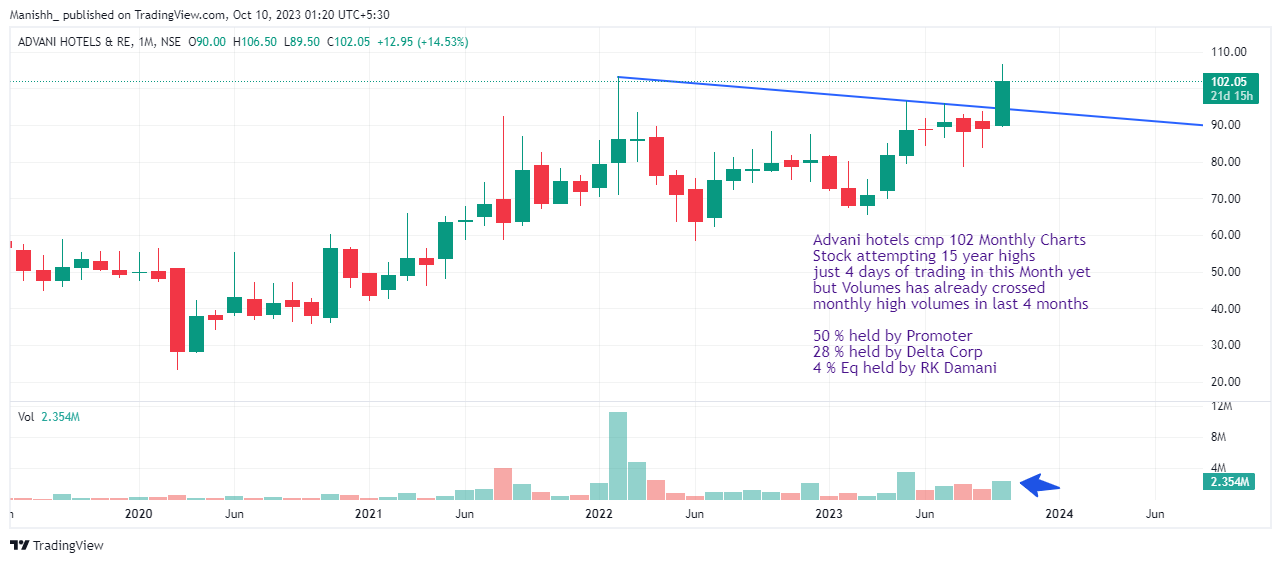
Advani hotels cmp 102 , Monthly Charts
todays high was 106.5 … Stock attempting 15 year LIFE HIGHS
Stock from a sector which is holding out well
higher Daily volumes yesterday , with Delivery markings of 1 % of Total Equity
just 4 days of trading in this Month yet ,but Volumes has already crossed
monthly high volumes in last 4 months
50 % held by Promoter , 28 % held by Delta Corp
4 % Eq held by Mr. RK Damani
Views Welcomed !
4 Likes
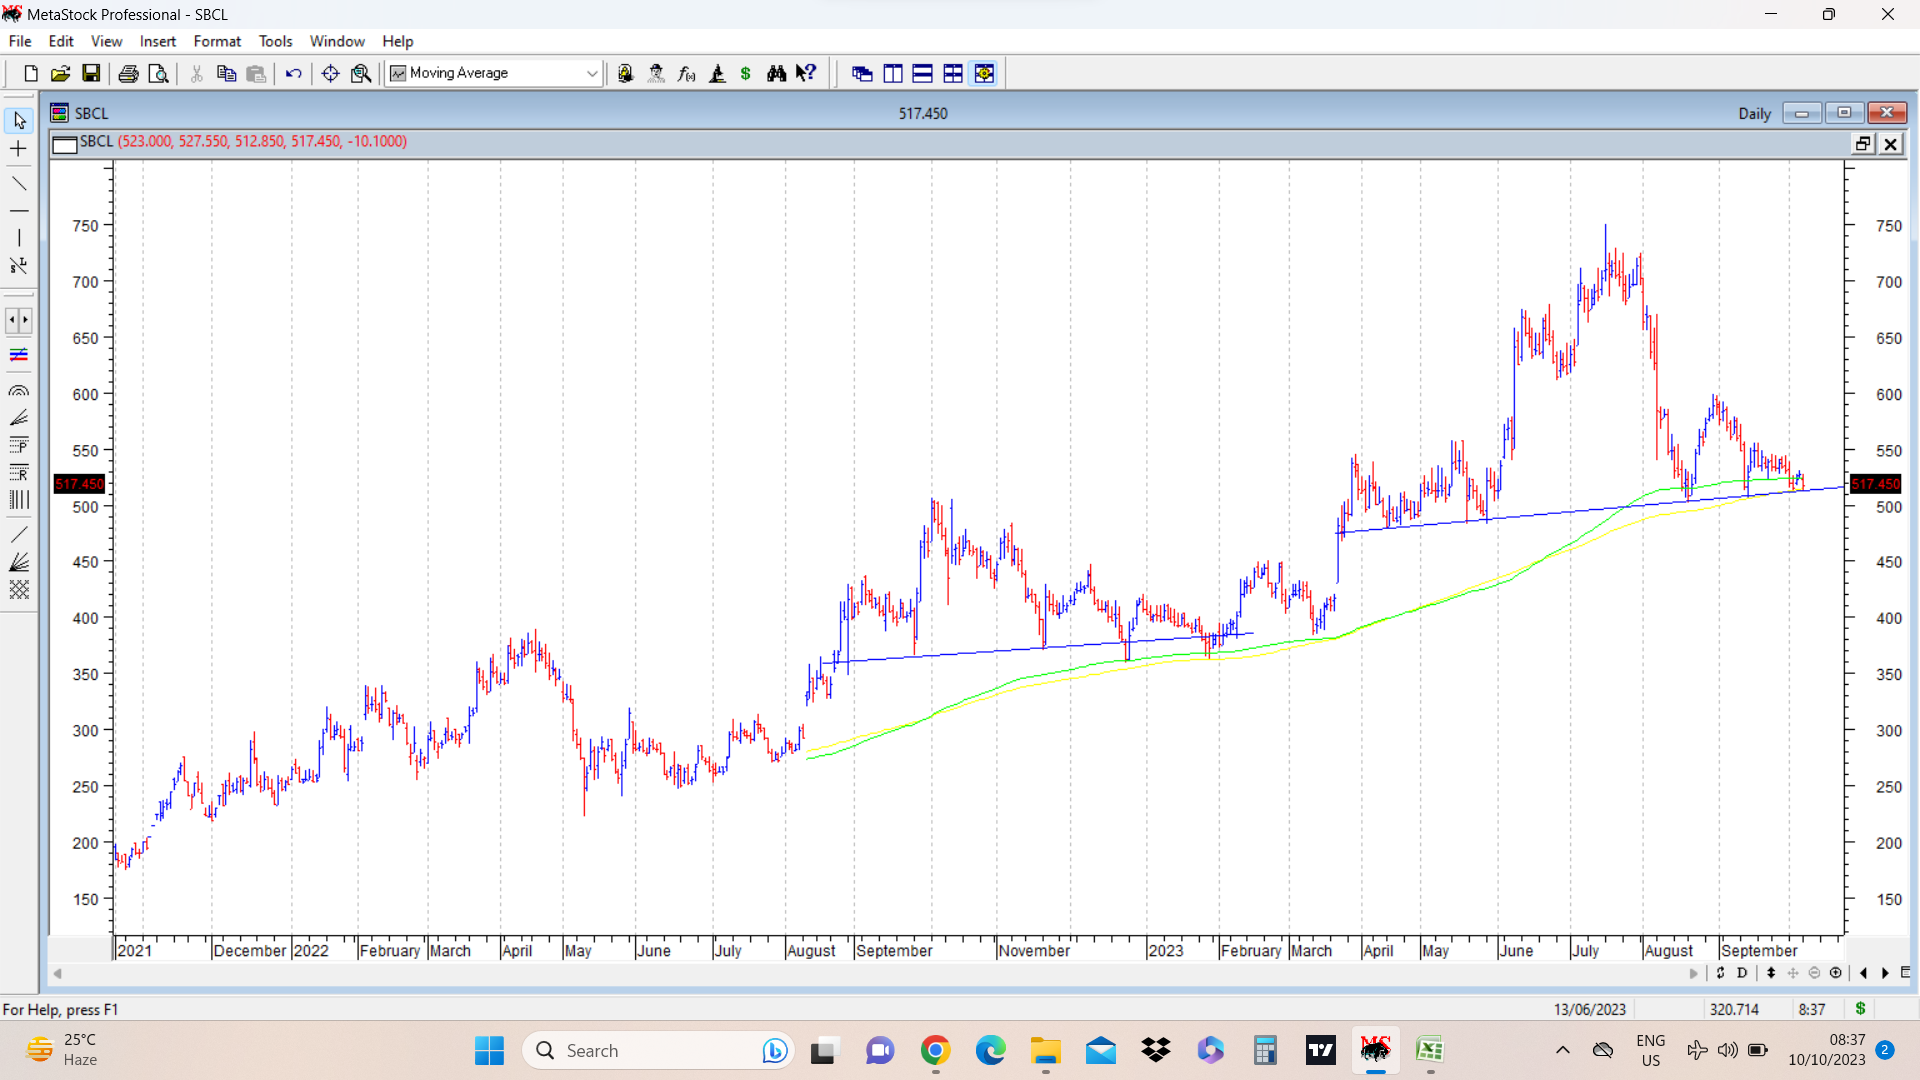
Shivalik Bimetal cmp 517. Stock price is poised at a neckline of a potentially bearish head and shoulders pattern in the daily charts. It is also taking support at 200 dema. It is also close to previous peak level of 507. And within consolidation range of 480-520 which also happens to be the right shoulder.
Now comes twist in the tale. ![]() Previously also similar situation happened in Jan 2023 when stock price broke down below neckline of a bearish head and shoulders pattern which was formed back than… Stock price took support at around 360-370 which then was the 200 dema. And then it reversed to quickly race to around 750 within quick time.
Previously also similar situation happened in Jan 2023 when stock price broke down below neckline of a bearish head and shoulders pattern which was formed back than… Stock price took support at around 360-370 which then was the 200 dema. And then it reversed to quickly race to around 750 within quick time.
Will history repeat itself ? FAILED BEARISH PATTERN LEADING TO A STRONG RALLY? Lets see. Or will the pattern play out and can we see a fall? Very interesting situation.
I don’t have position on the stock, and just watching for academic purposes.
54 Likes
Andhra Paper crossed its All Time High after a period of 5 years with great volumes and is retesting the support level which was earlier its resistance.
The stock even consolidated near its resistance level for a decent amount of time before giving a big breakout which usually is a healthy sign for a good up-move.
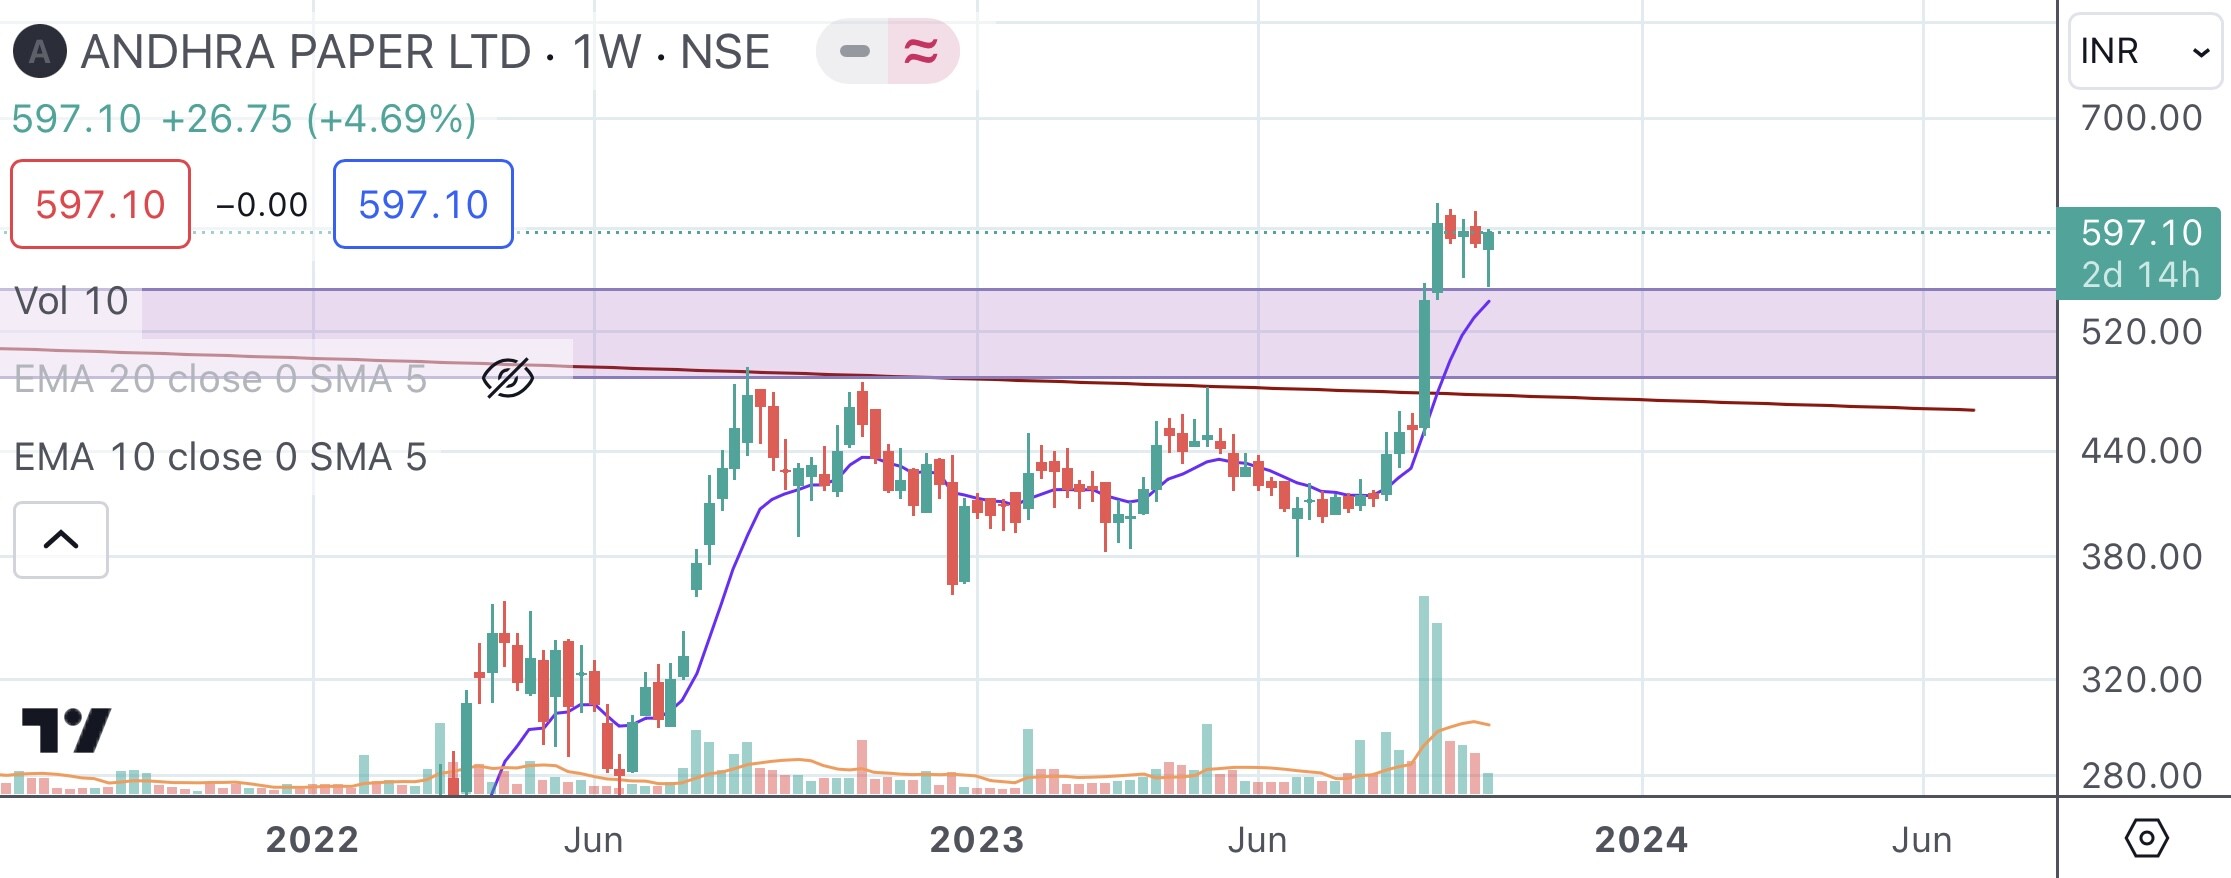
Disclaimer:- Invested at current levels, please do your due diligence before taking any position.
2 Likes
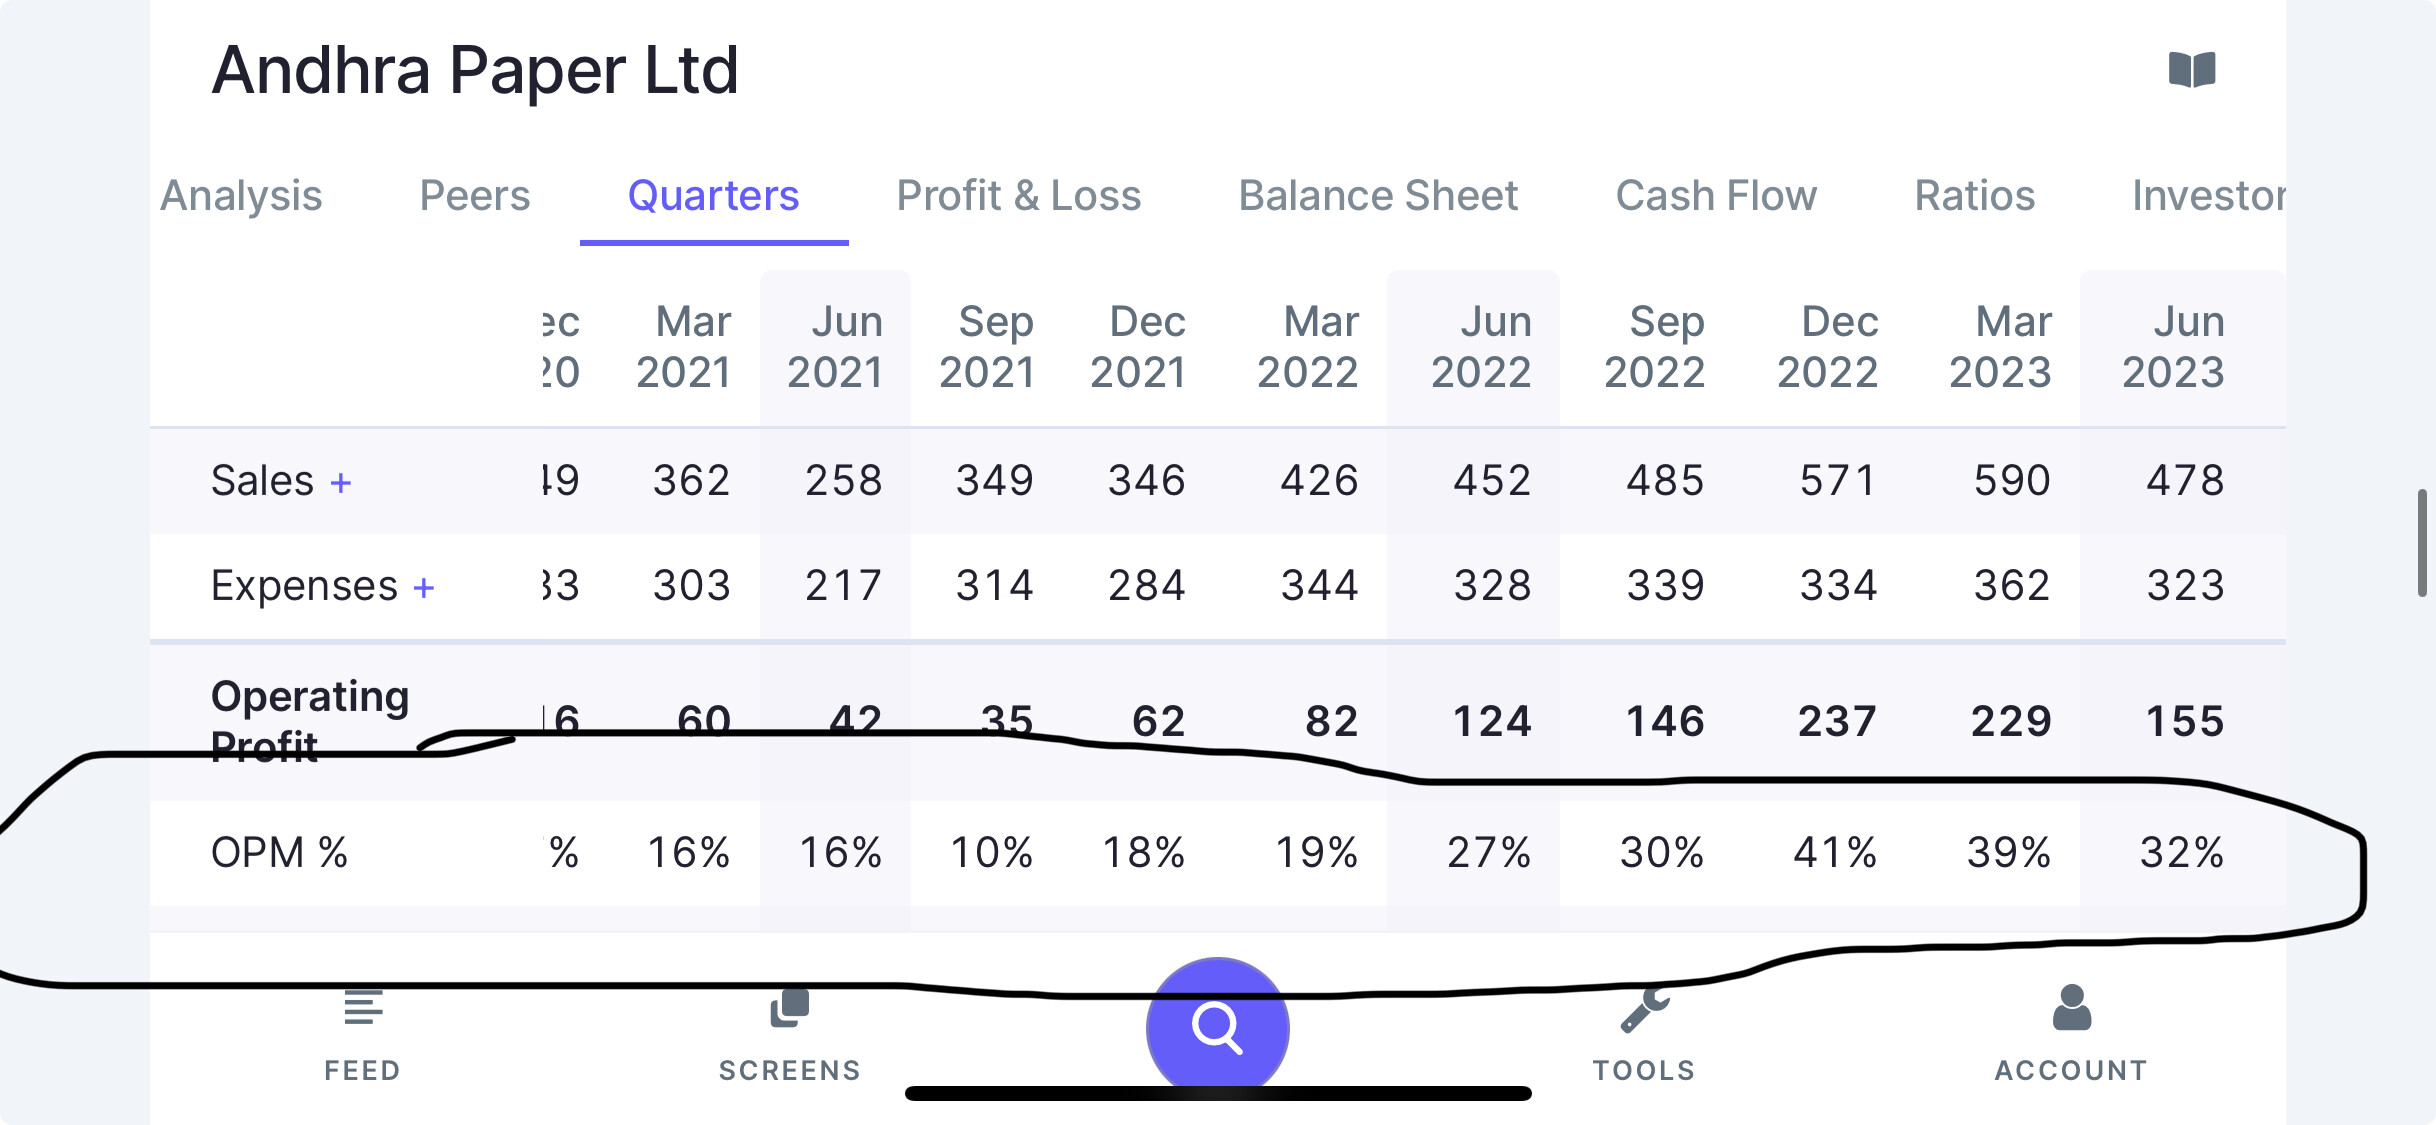
Just be careful. I can understand the ATH in nearly all paper stocks. But please do remember that their OPM are at the peak at present. So if reversion to mean happens, they may fall
4 Likes
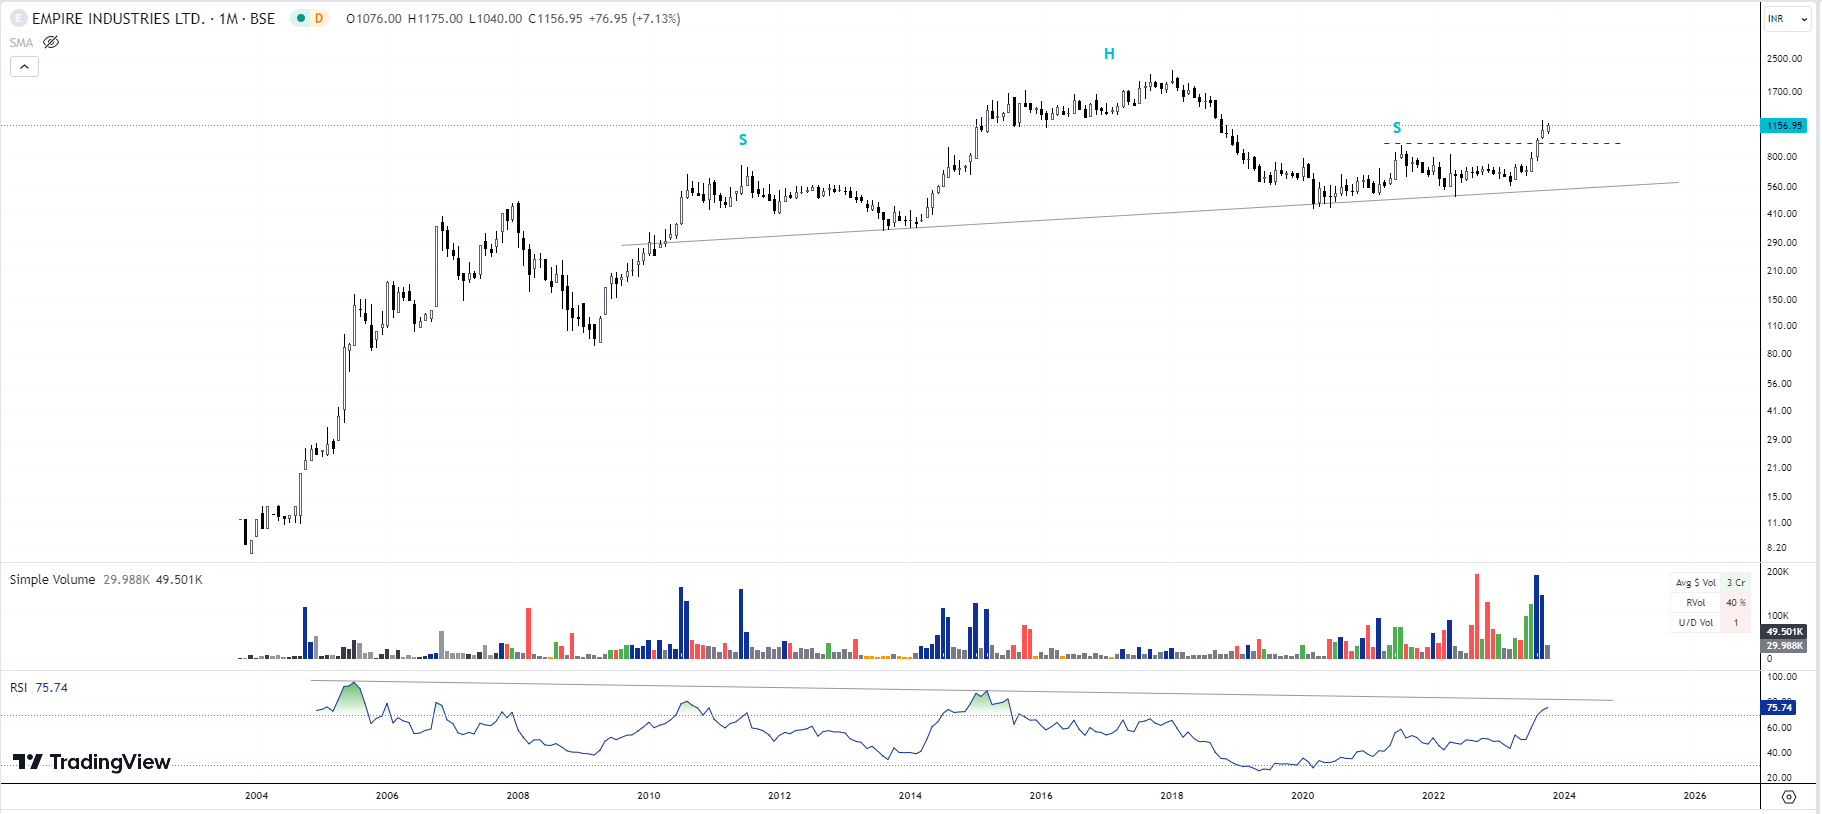
HnS reversal patterns lead to strong bullish upmoves:
eg: EMPIRE INDS:
- Buy activated above 915 (above Right shoulder)
- Hidden bullish divergence in monthly chart should initially give the target of previous highs.
Safe to assume bullish bias ahead.
1 Like
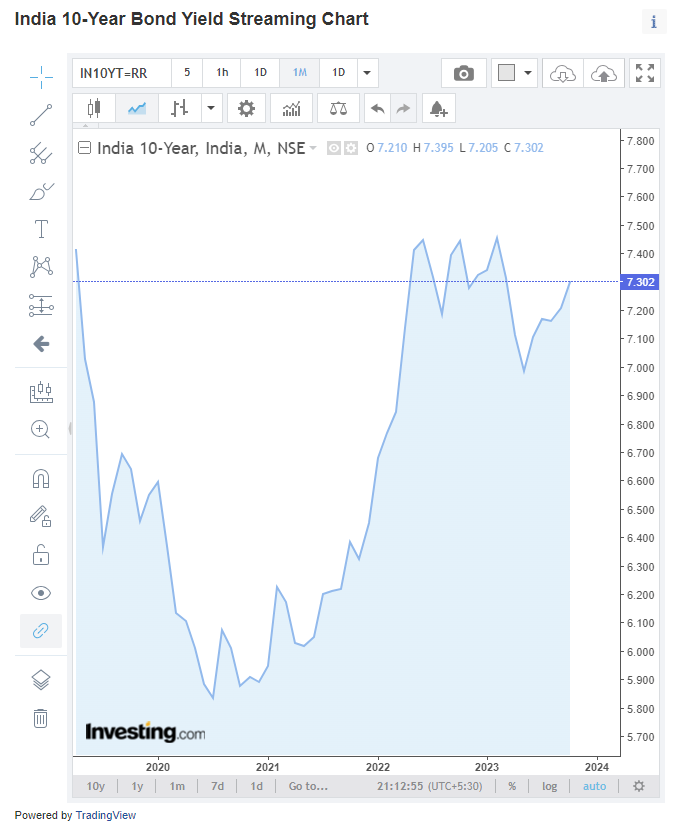
Yield of GOI 10 yr bond showing a cup and handle formation? If yes, what should be the target for the upmove, around 8.5-9%? and if it happens by June 2024, perfect timing for the JP Morgan Bond investors; at that yield it ought to be bought, right ![]()
@vikasbargale surely, that’s why I always have a trailing stop loss to exit from the position if any reversal does happen.
1 Like
As per our understanding , we’re near the end of the move in GOI 10yrs yield.
Current spike is because of RBI announcement of selling more bonds. This is related liquidity with the banks.
We foresee it to fall below 6% in coming 1-2 years ( reason is India inclusion in global bond-baskets). In short term , 7.48 is a watchout level. If it crosees above this level ,then it can spike up further for short-term. But long term trajectory should be on dowanward trend.
2 Likes
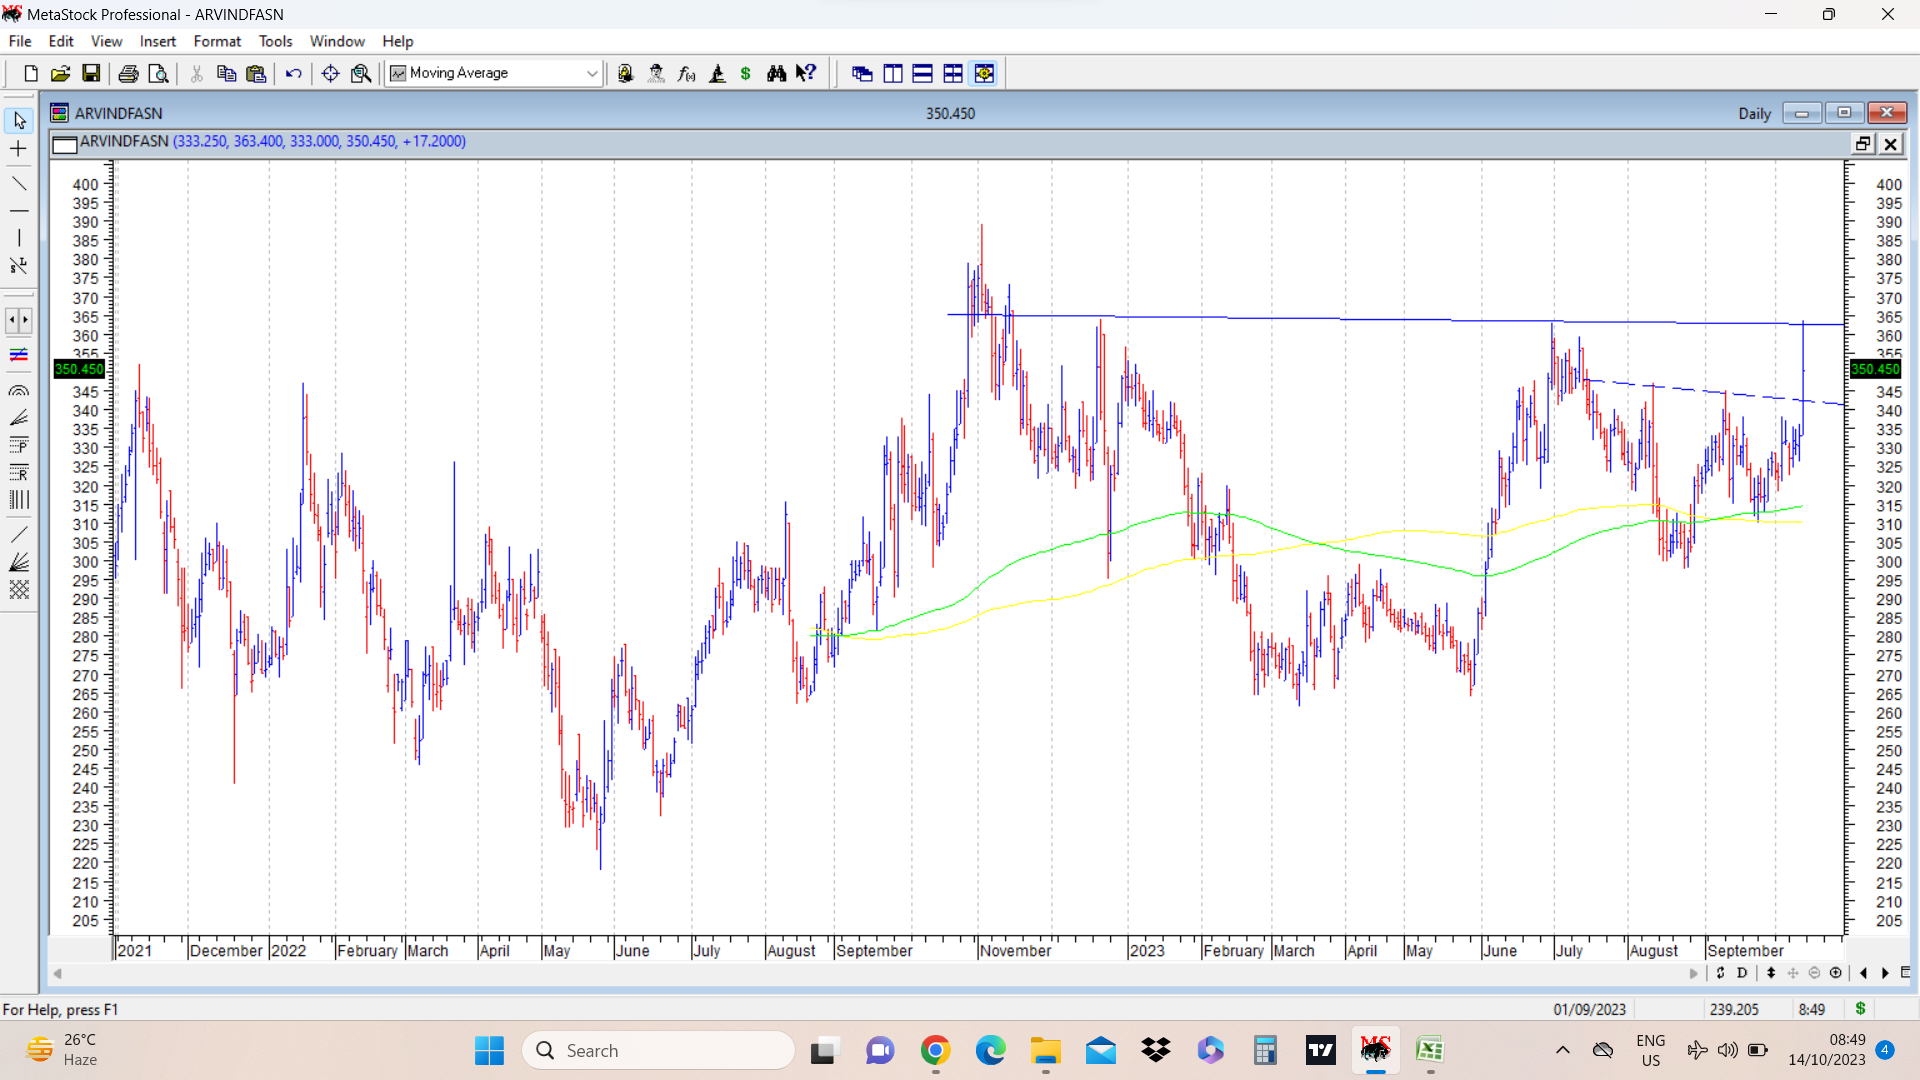
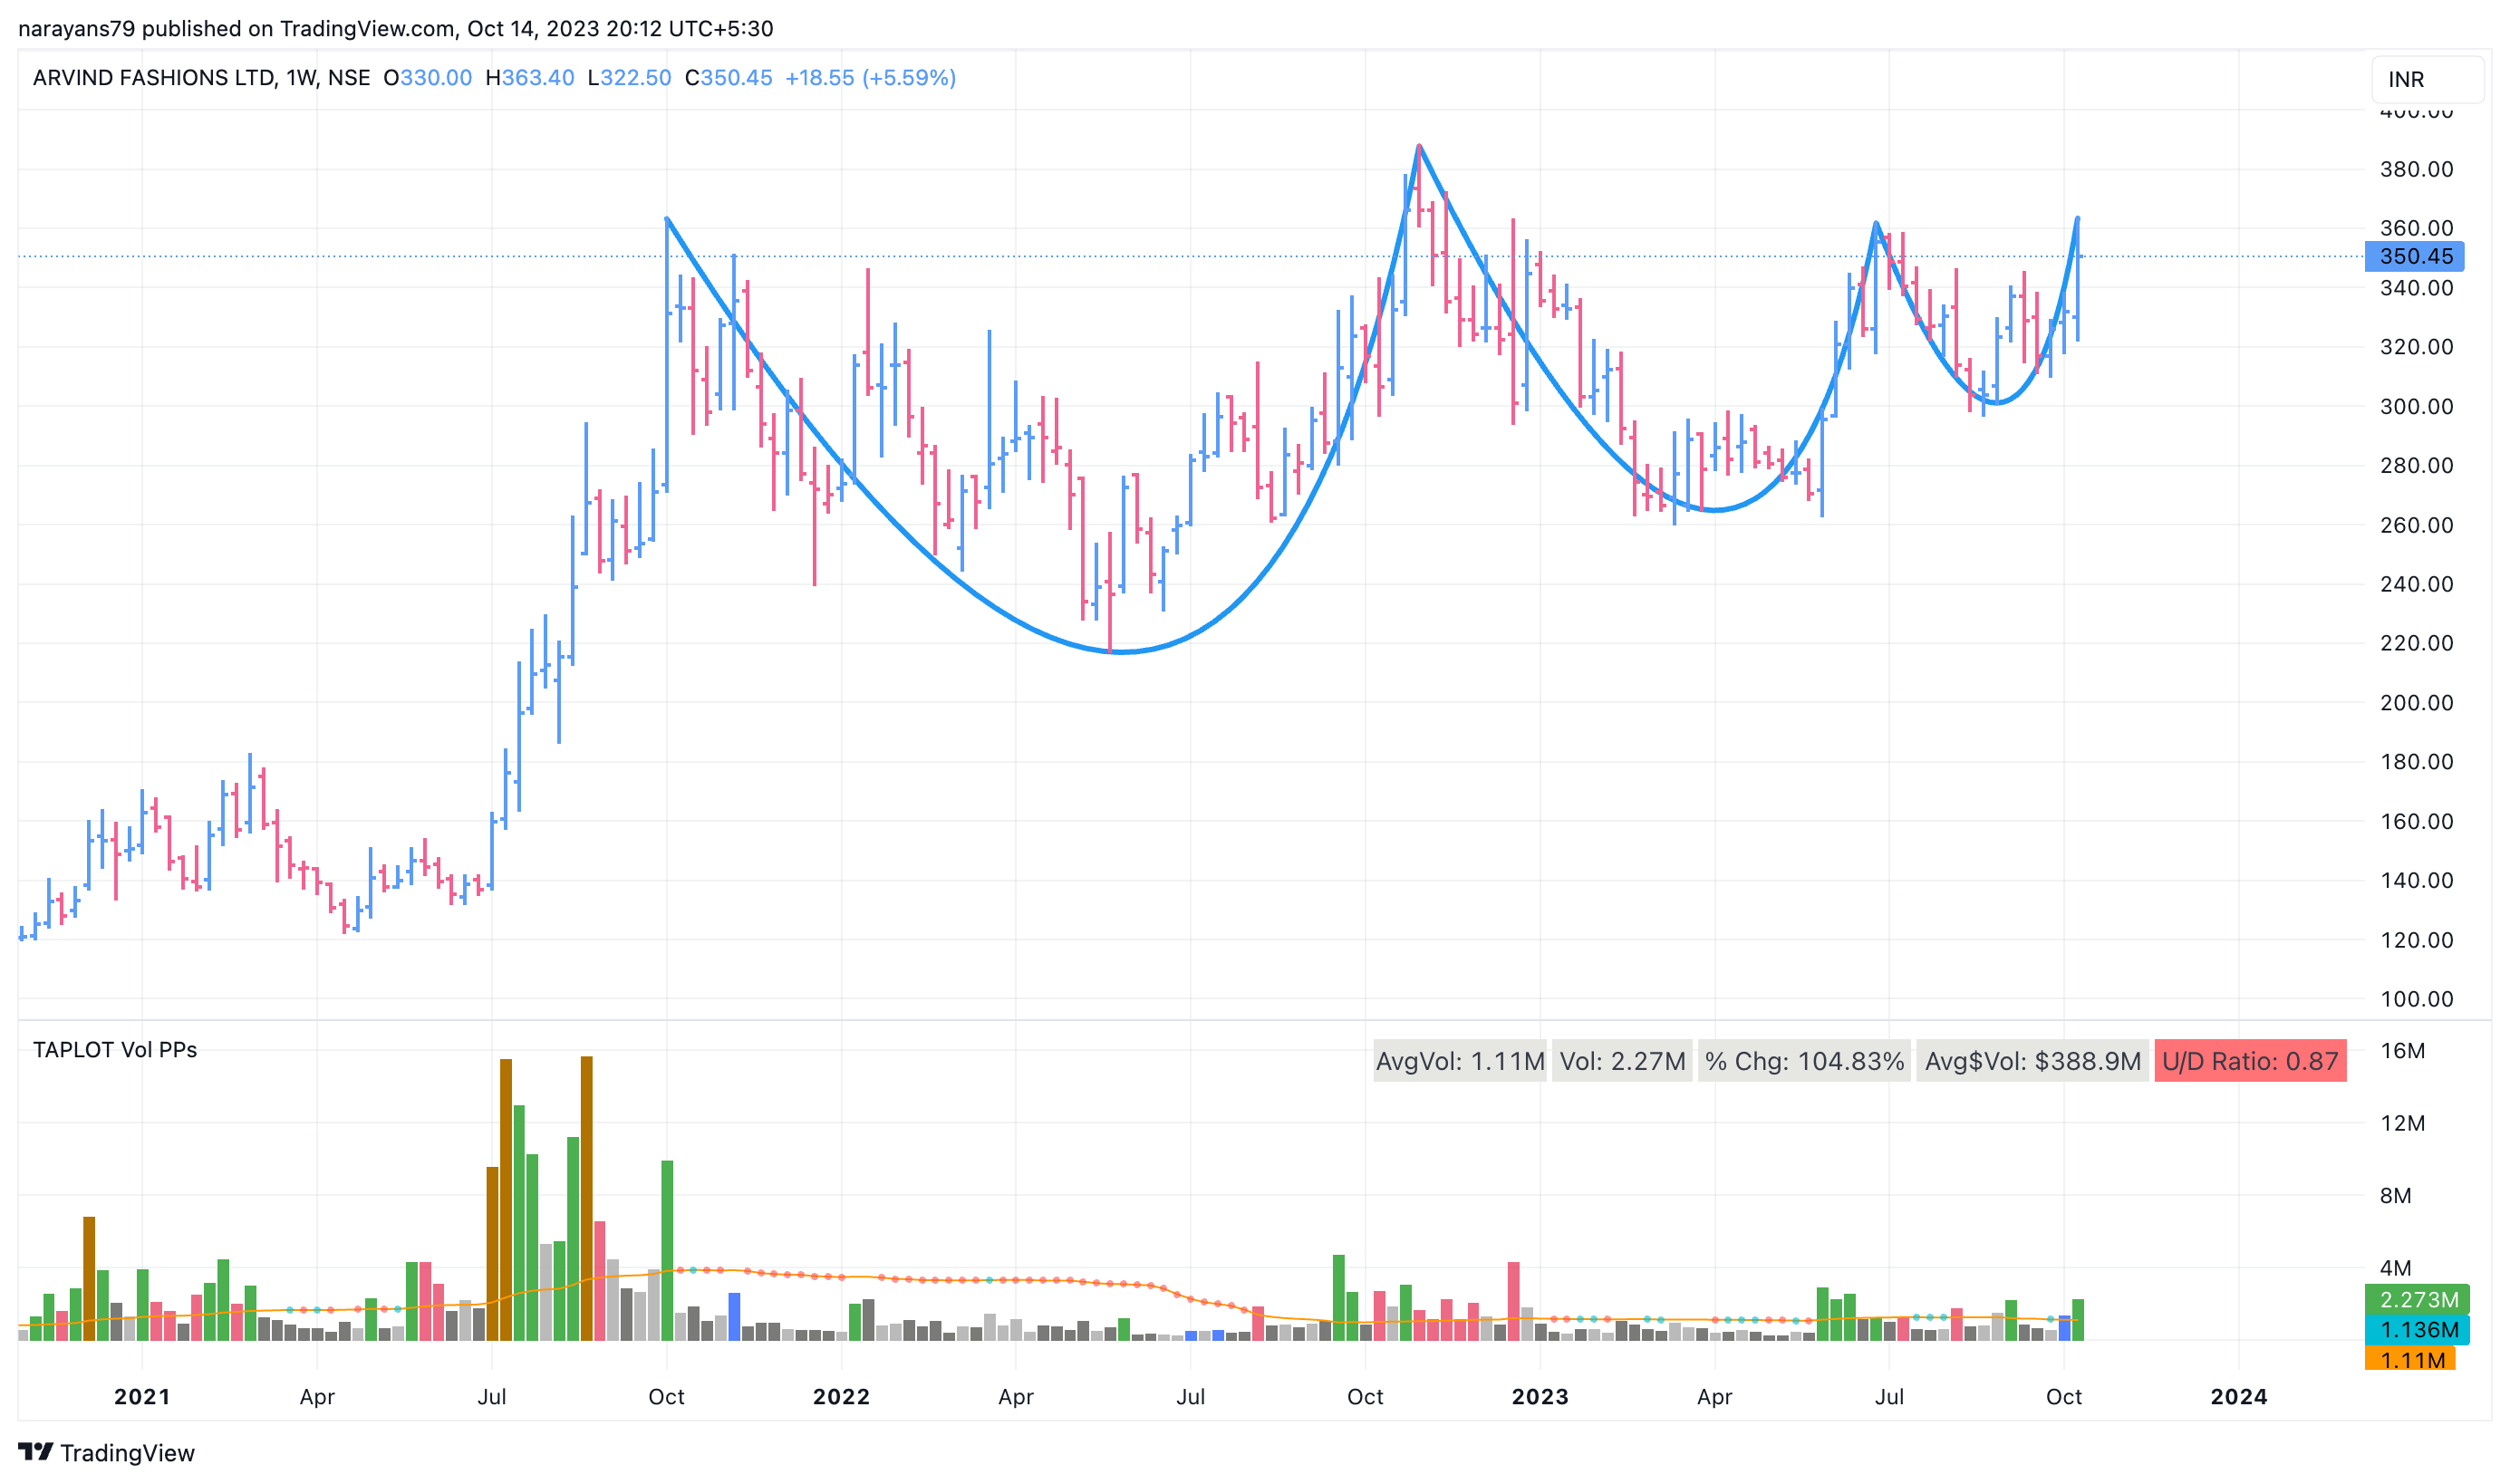
Arvind fashion Ltd. cmp 350. Breakout from a small inverted head and shoulders pattern ( this is a right shoulder of a bigger inv H&S pattern) , with potential target of 380. Breakout from bigger H&S pattern will be above 365, with potential target of 450. Example of a same smaller pattern within a bigger pattern.
Overall the stock has been an underperformer as compared to a lot of other stocks. Let’s see if anything changes here.
disc: invested.
13 Likes
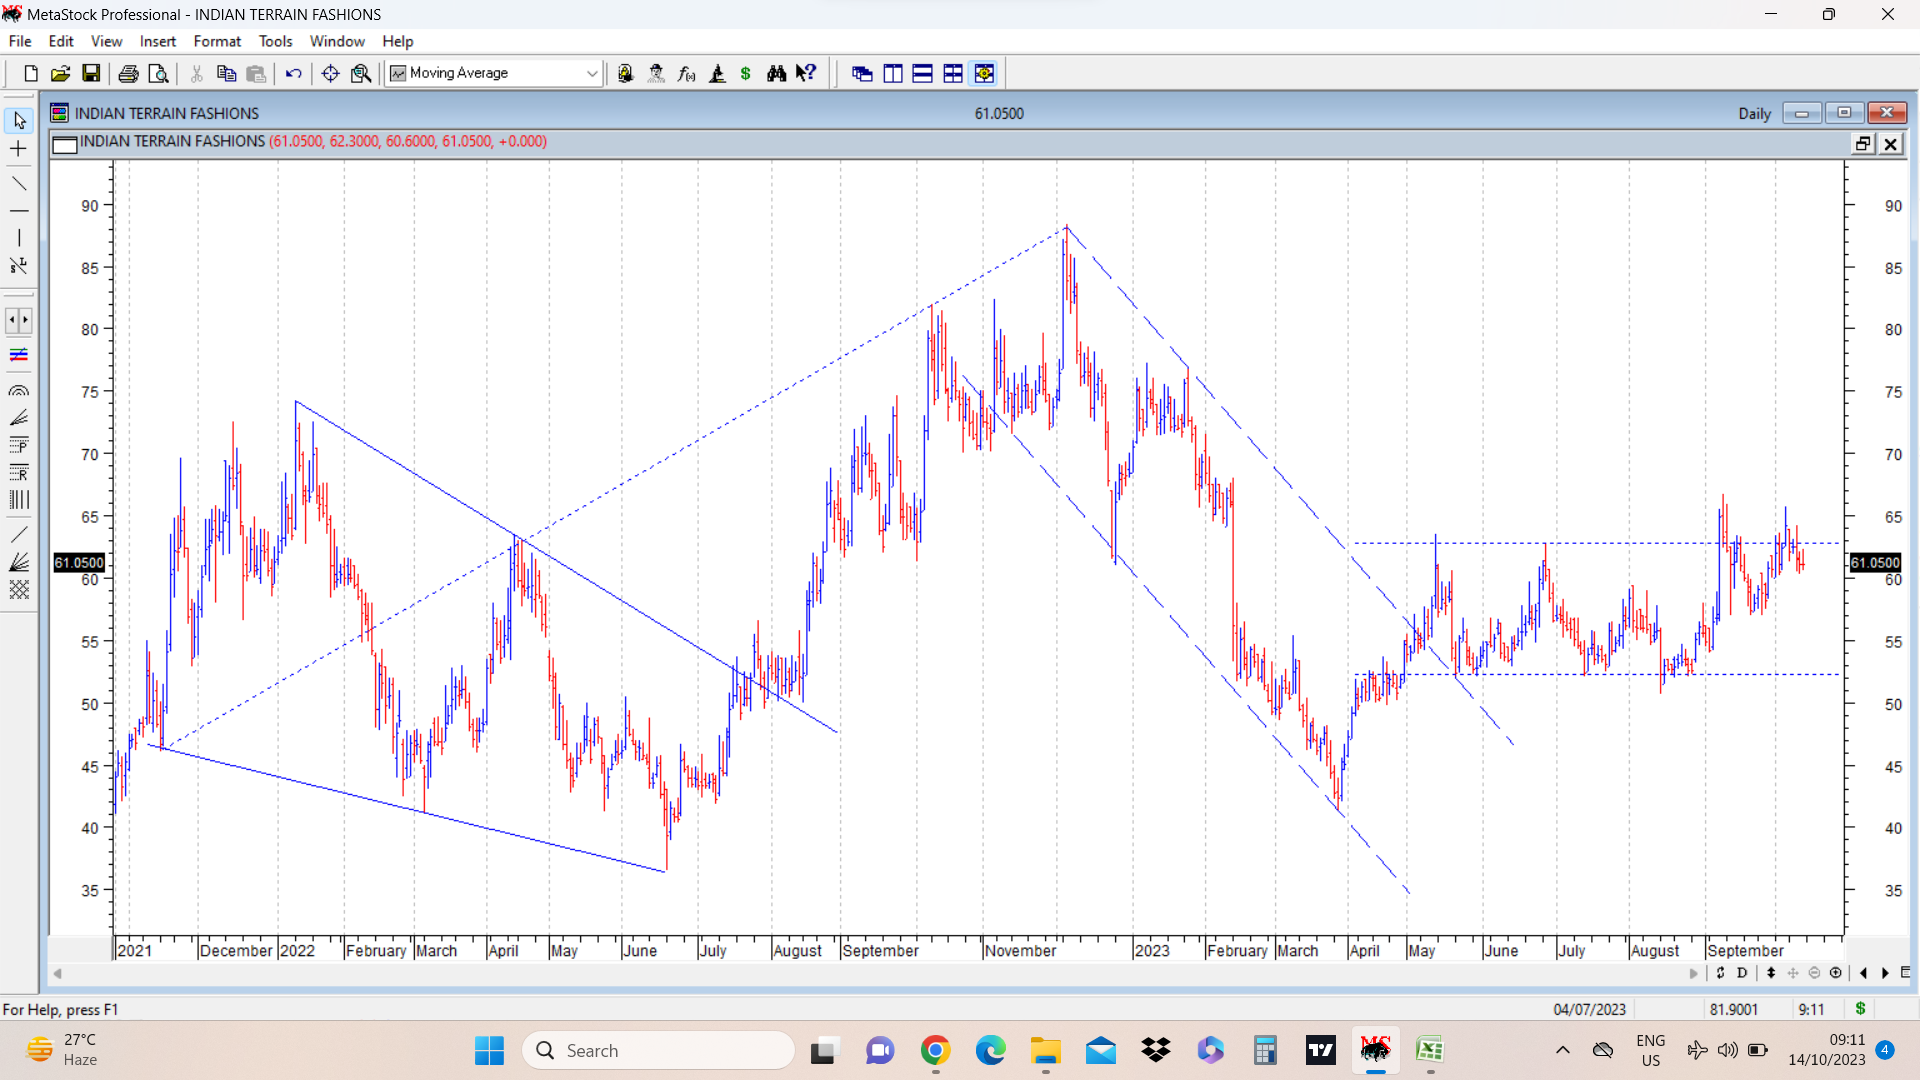
Indian terrain cmp 61. Note triangular consolidation on left side of chart. The slope of this fall is gradual and hence it needed a few days consolidation after breakout from triangle to reach target line shown in Wolfe Wave. In contrast the more recent fall from 88 to 41 has been very sharp and after breaking out from falling channel, it took a long time of sideways consolidation , before it attempted a breakout from range bound moves. Now it needs to show some strength above 61-62 to have a possibility of another upmove.
disc: not invested, In watchlist.
11 Likes
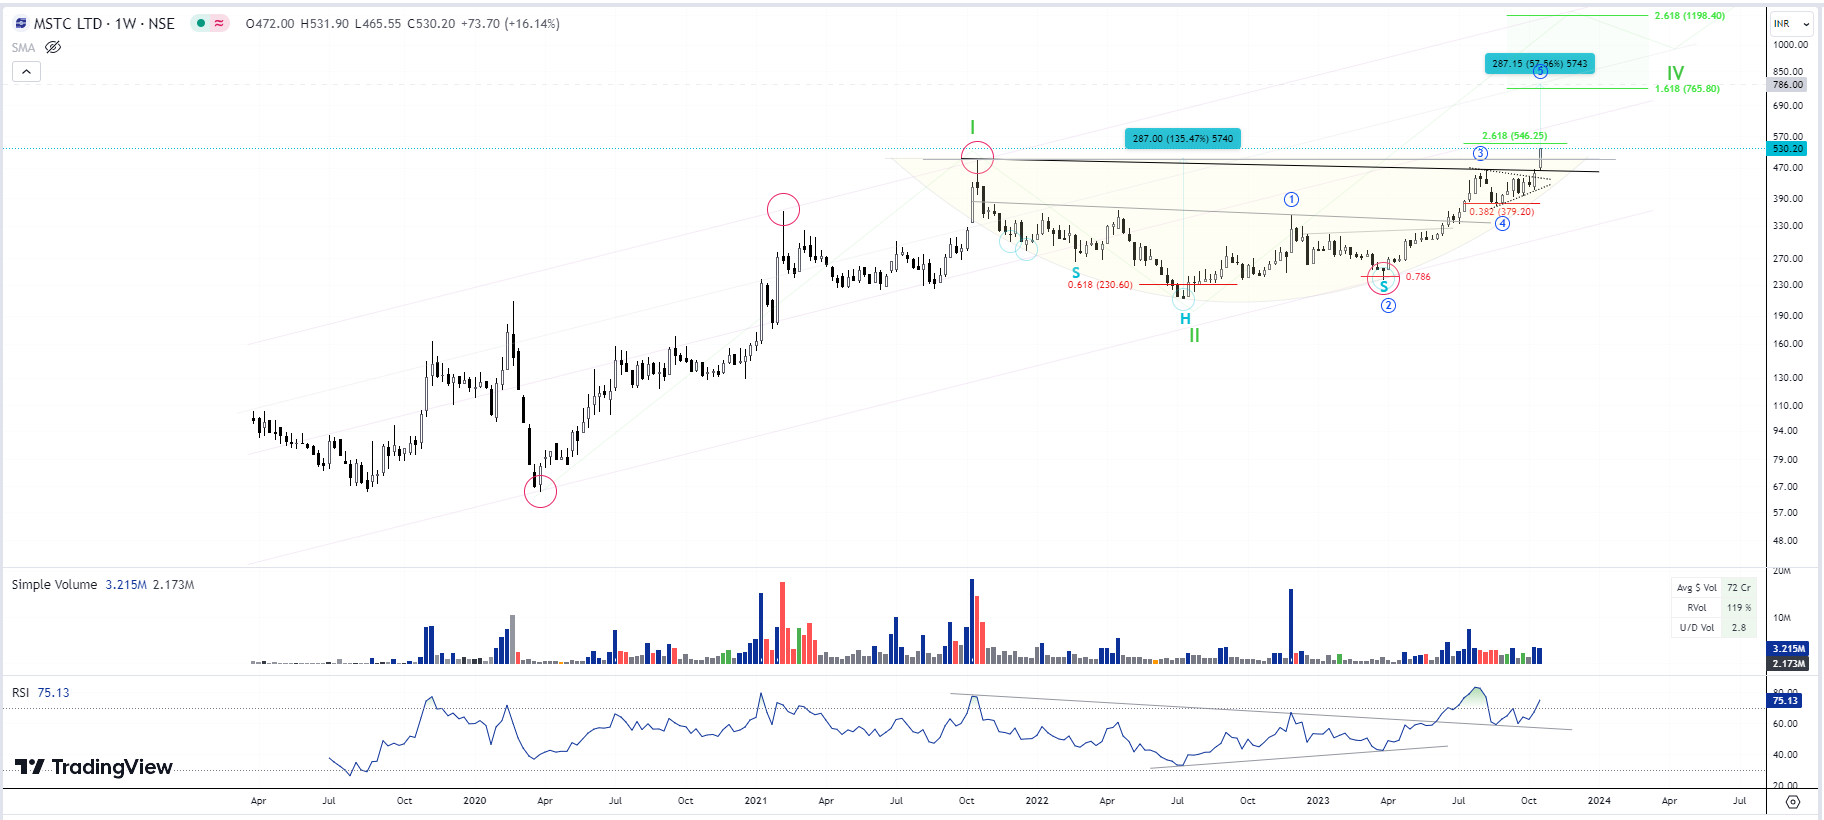
UPDATE: MSTC 316-530, a new ATH…
- An excellent base breakout seen in MSTC. Base formed since October 2021.
- A small pennant type pattern seen just before breakout as well.
Safe to assume a bullish bias ahead…
10 Likes
Hi @hitesh2710 bhai, There is a rounding bottom formation in Zensar technology. Can you confirm the same? It might become cup & handle too.
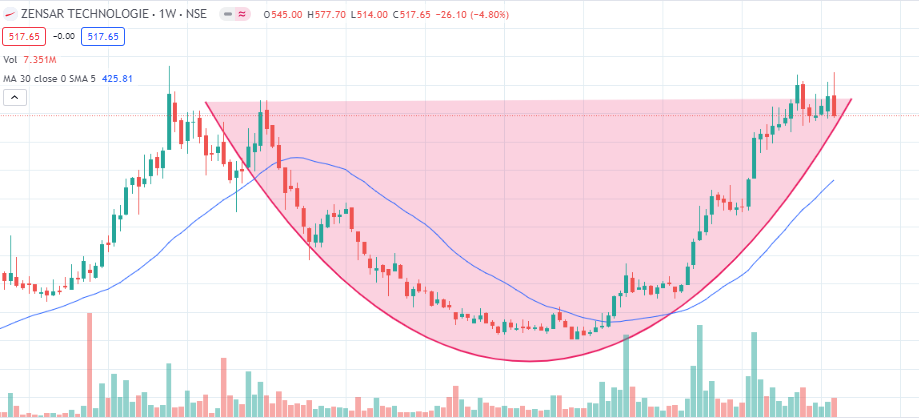
1 Like
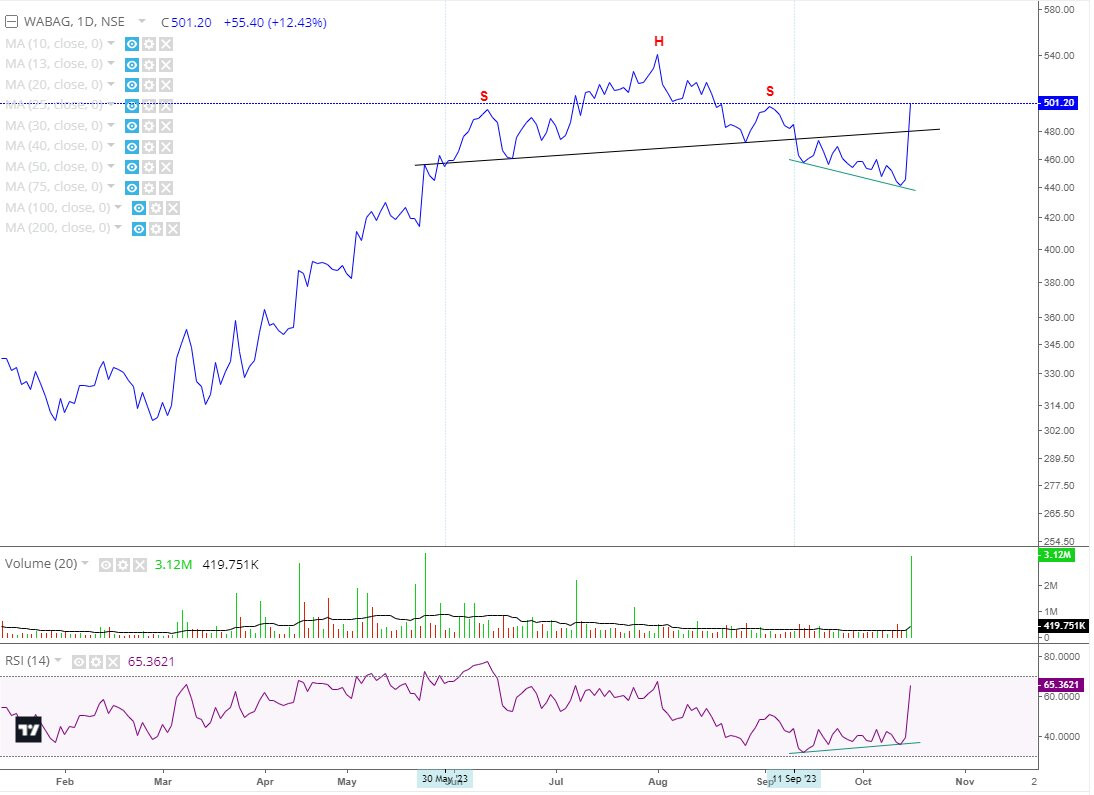
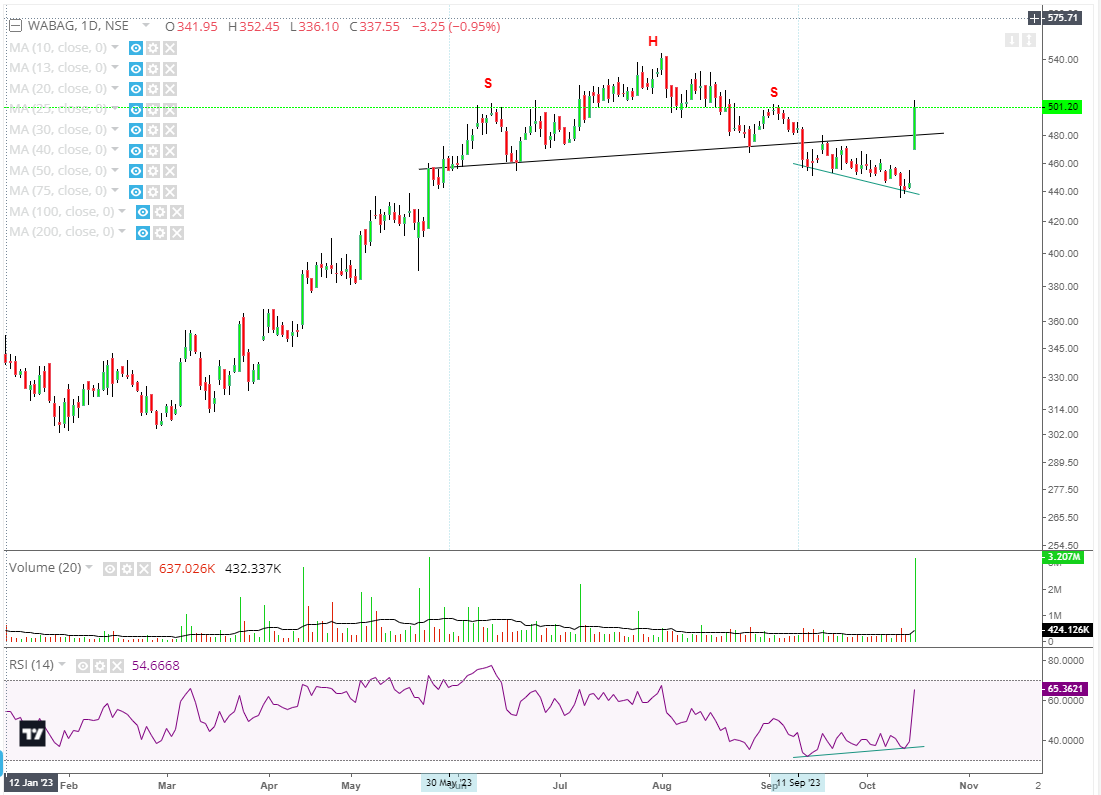
WABAG UPDATE:
-Daily chart Pattern Learning: From 30th May23 to 11th Sep23, a Bearish H&S pattern formed, which gets broken on lowering vols.
- Following which price falls while forming a +ve RSI divergence.
-Price tightening and Vol contraction lead to a big Reversal Candle with High vols.
3 Likes
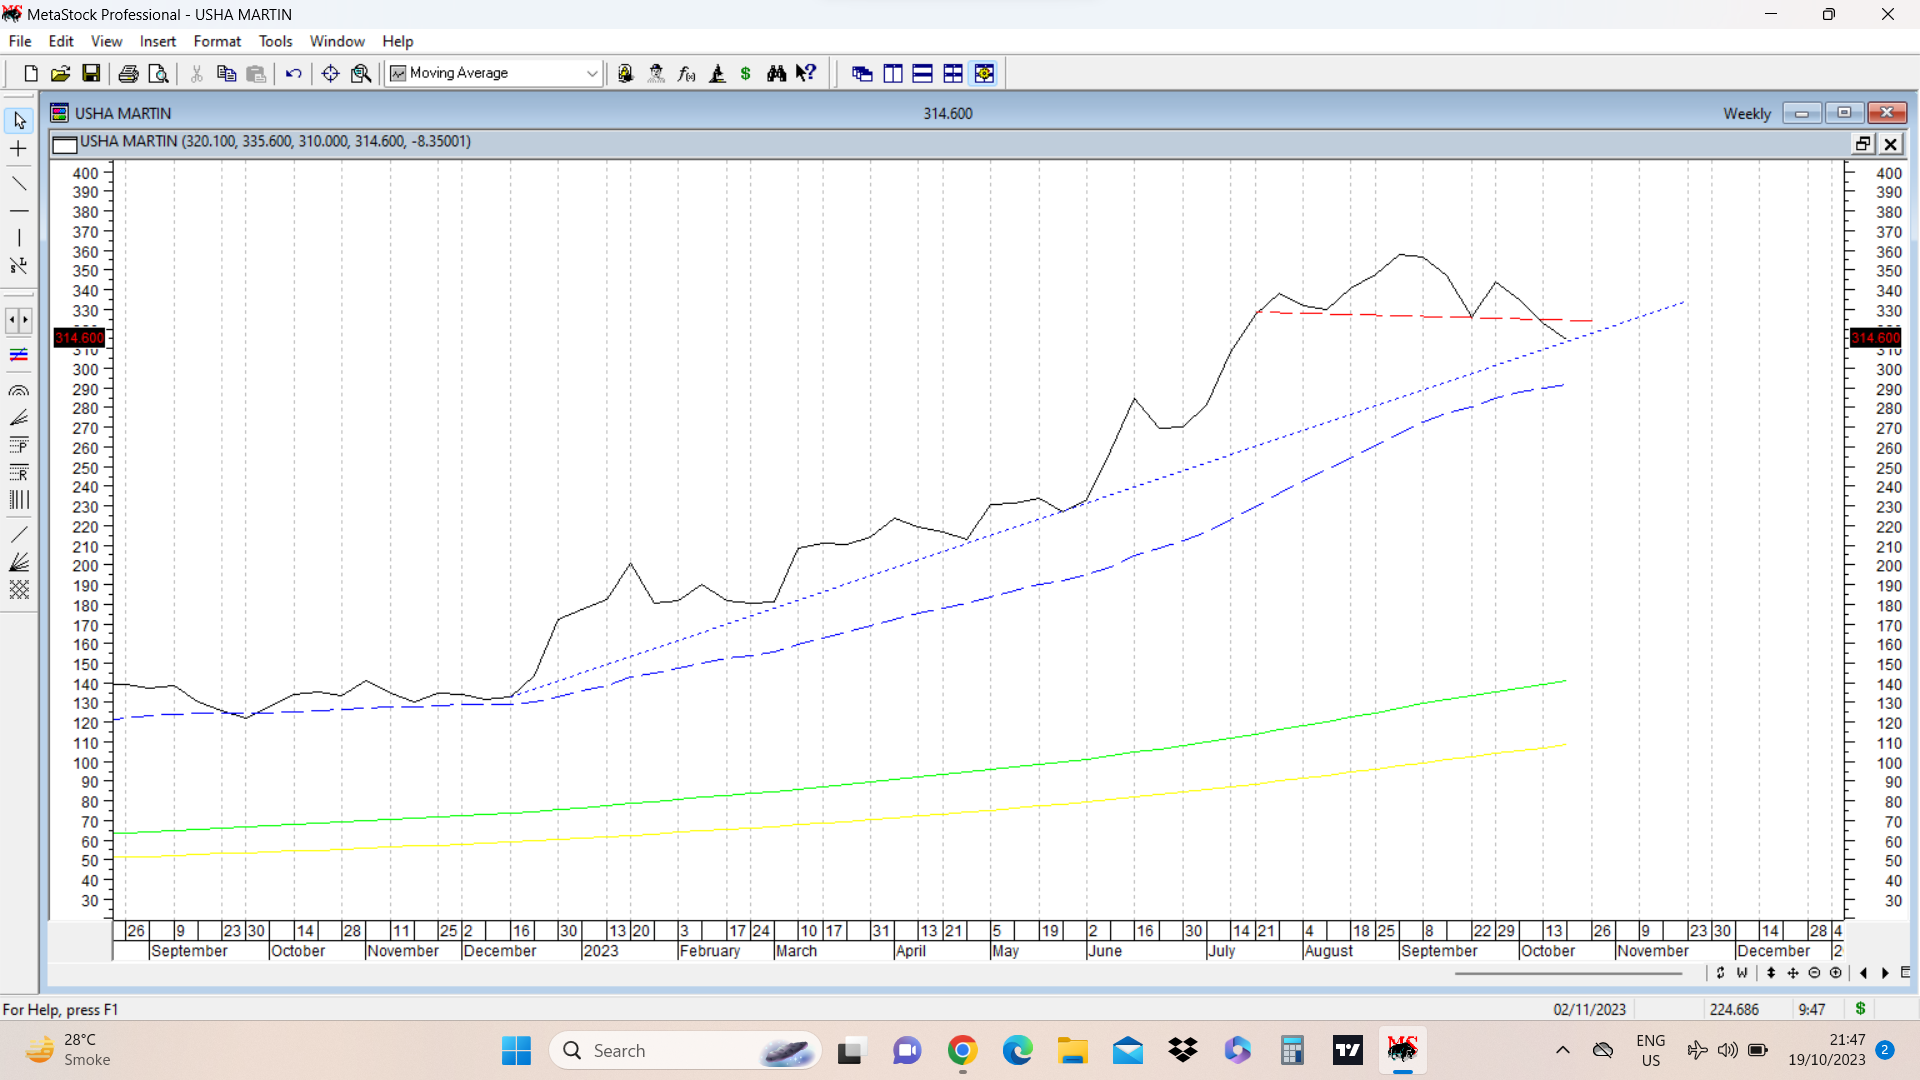
Usha Martin cmp 314. Small head and shoulders bearish breakdown.
Some observations:
- Close to weekly medium term trendline support
- 30 WEMA is at around 290.
- Target of weekly line chart H&S breakdown at 295.
Question is will be see pattern play out, or a pattern failure and a rally? All options open as of now.
disc: invested. ( not a recommendation, discussed for academic purpose for technical analysis)
19 Likes