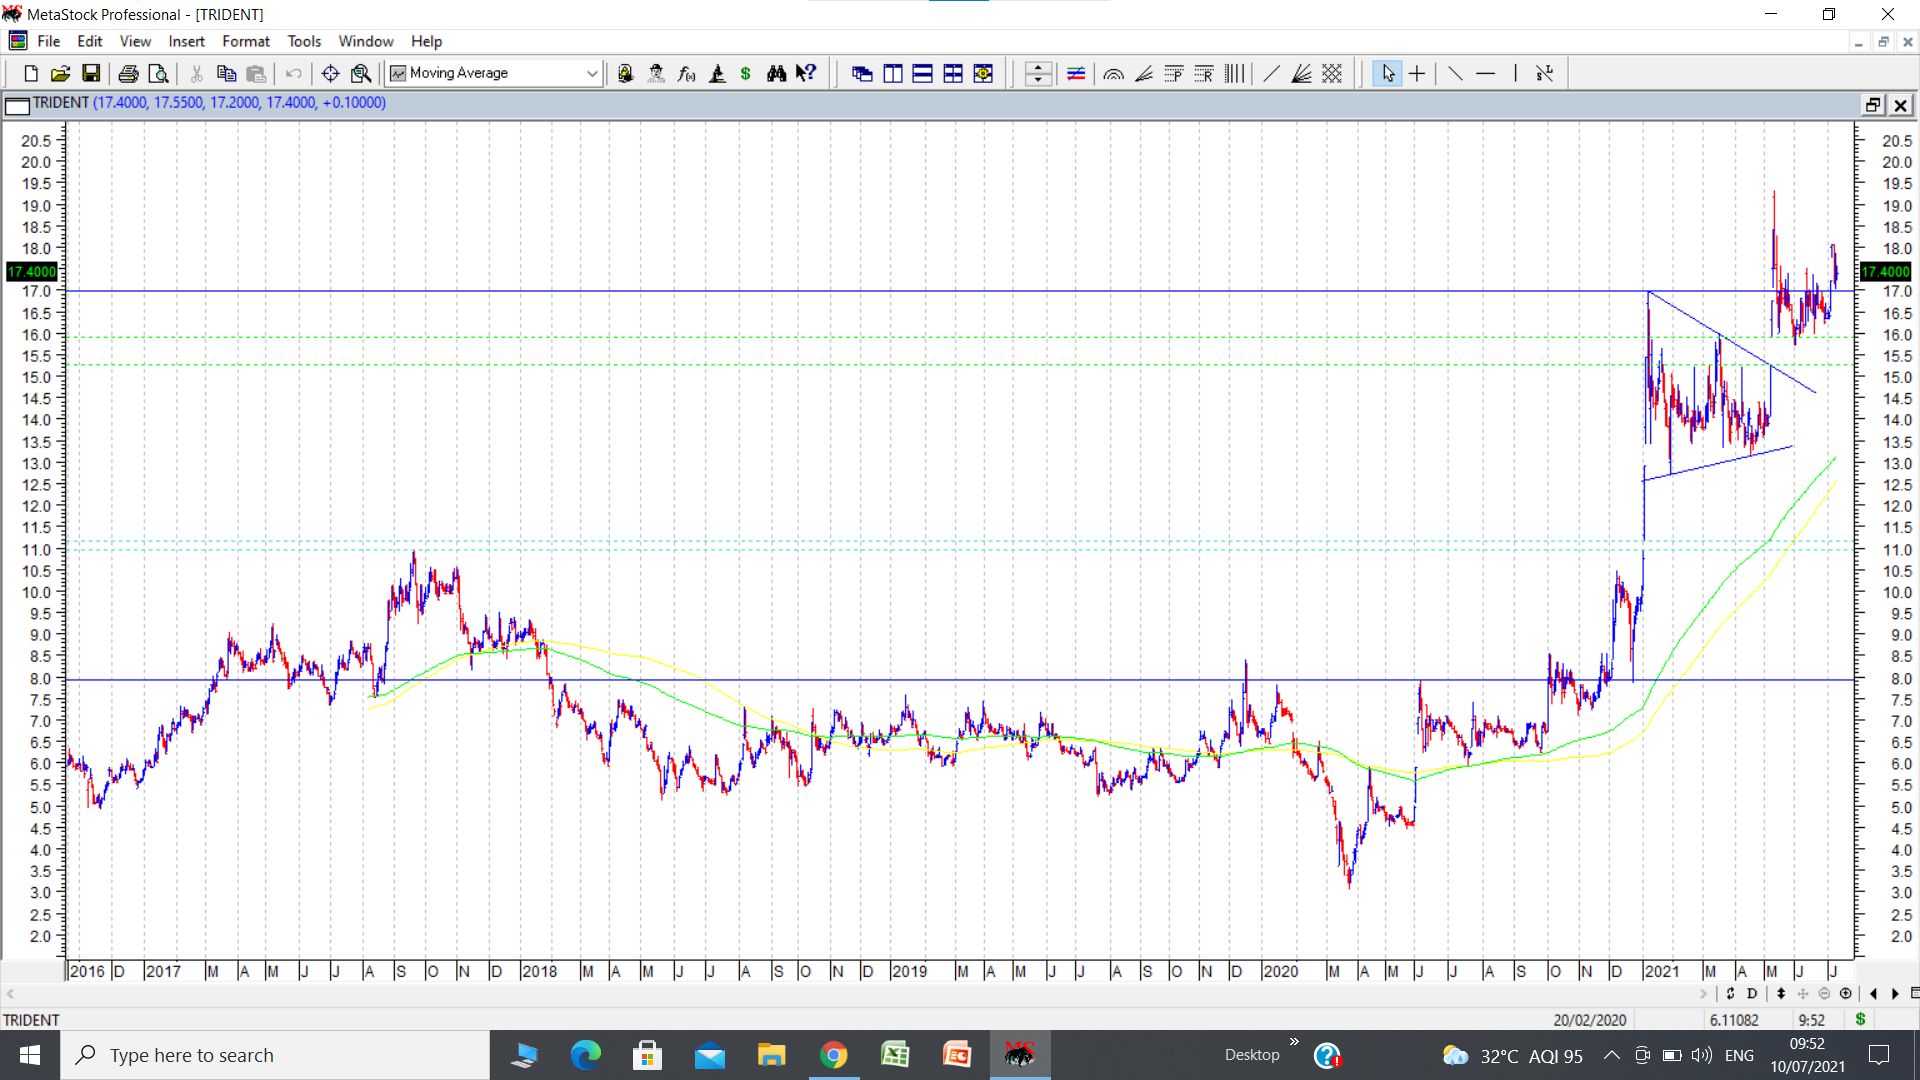
TRIDENT. another home textiles exporter. Here we can clearly see examples of gaps discussed in my portfolio thread.
First gap marked in light blue dotted lines ranges from 10.95 to 11.15. This was an important breakout gap where the stock price gapped up above the previous all time high of 10.95 posted in July 2017. (crossing 4 year highs which was previously all time high) Since this was a breakout gap, there was no attempt at even filling this gap as the stock price raced ahead sharply.
Second gap is a run away gap between 15.25 to 15.9 marked in dotted green lines. This gap occured during breakout from a triangular consolidation which took the shape of a pennant (flag) post the run up from 8 to 17. Again this gap acted as a strong support during declines post breakout from the trianglular consolidation. This gap remains unfilled till date.
Now coming to targets of the flag (or one can call it pennant ) pattern. Height of pattern is from 8 to 17 which is a distance of 9 Rs. Breakout point was 15.25. Target could be 15.25 + 9 = 24.25, if pattern plays out.
disc: invested as a techno funda bet. (two stock basket approach comprising of ICIL and Trident to play home textiles segment ) This chart has been put up for educational purpose specifically to understand the importance of gap at very important breakouts.