
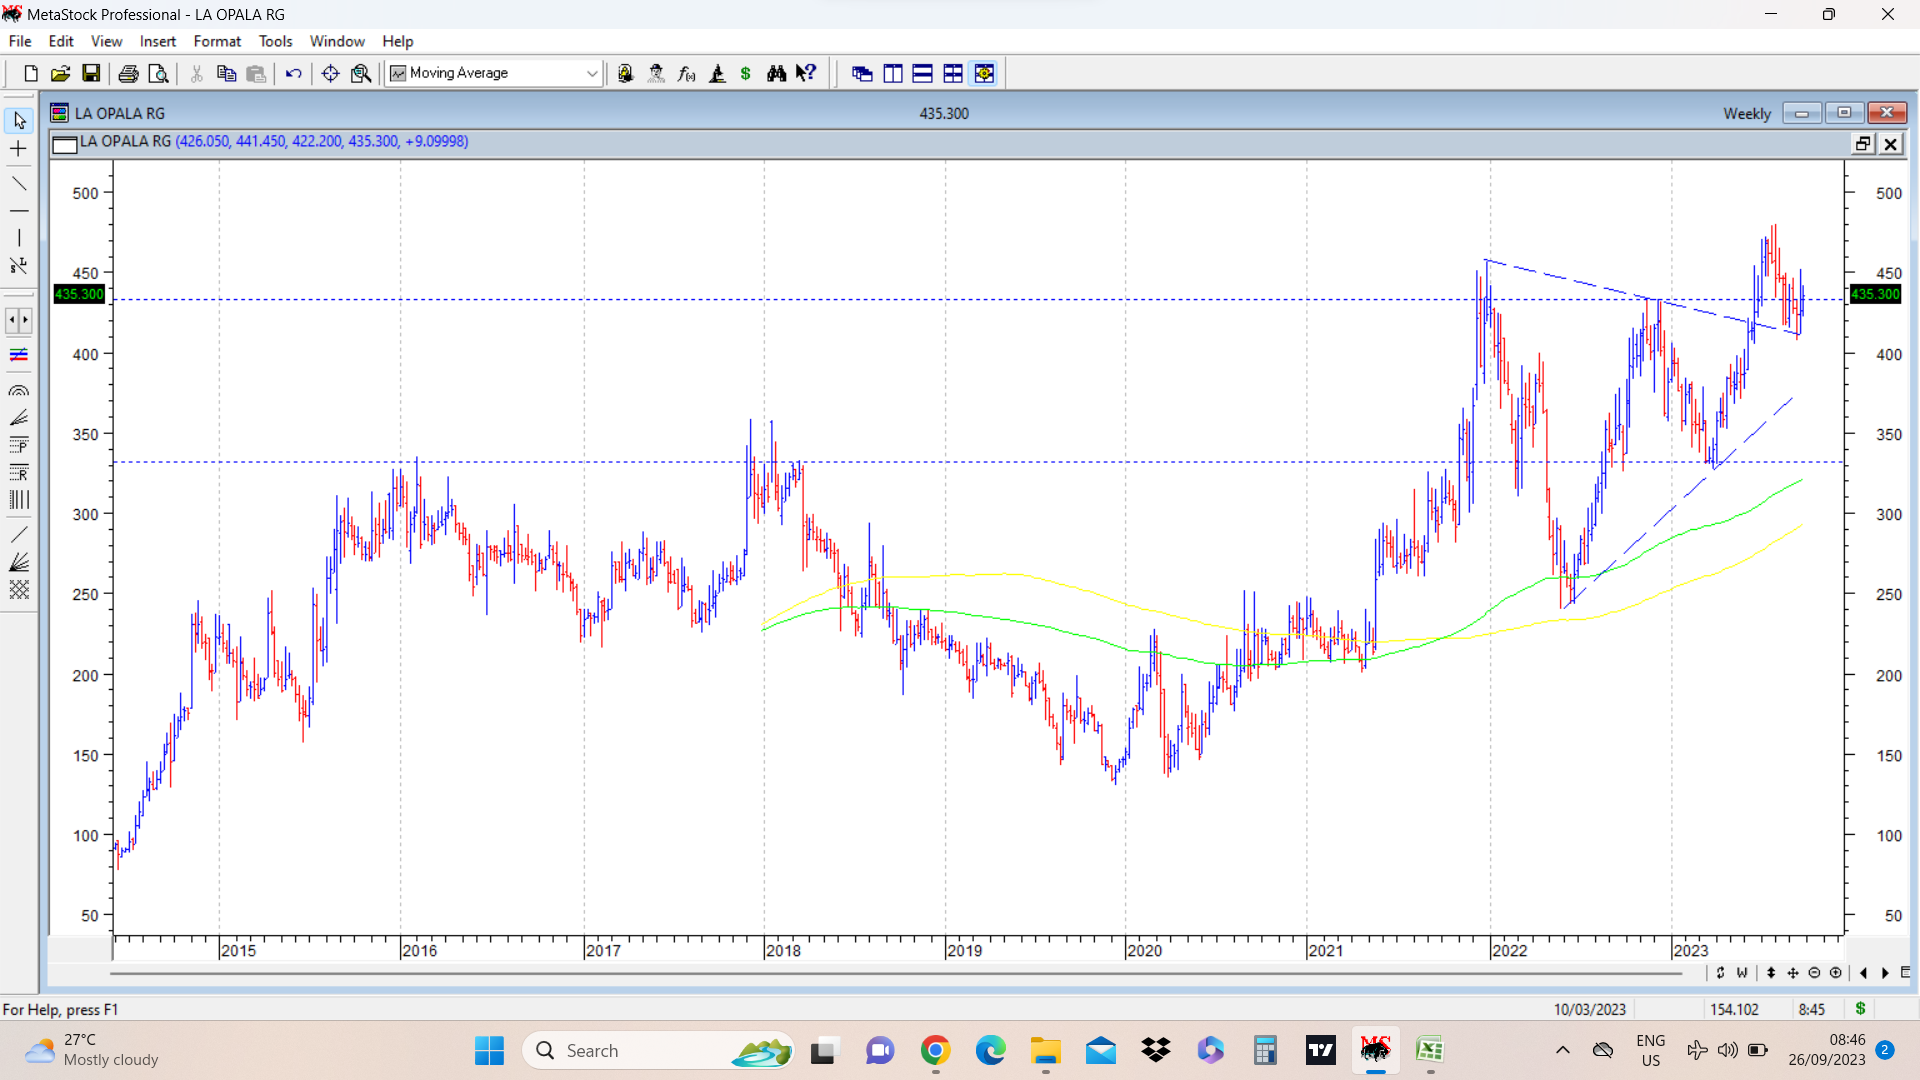
La Opala has an interesting chart pattern as shown on the weekly chart attached. It crossed its previous all time high of 330 in Nov 2021, posted a fresh high of 456, and then went into consolidation and formed a symmetrical triangle. Recently in June 2023, it broke out of this contracting triangle, posted a new all time high of 479 and again came down to retest the breakout zone of contracting triangle. Now it seems to be trying to make a move up after retest. disc: no positions, not a recommendation. It remains in my watchlist.
12 Likes
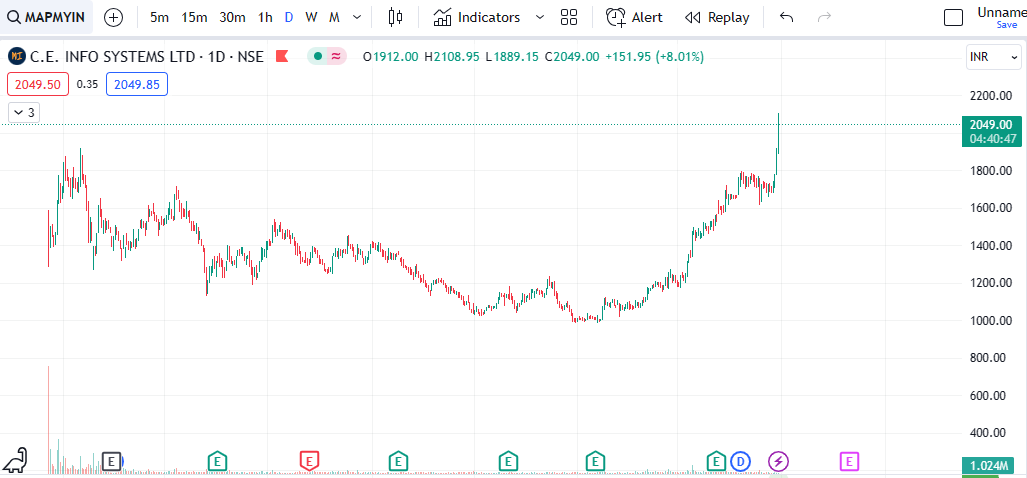
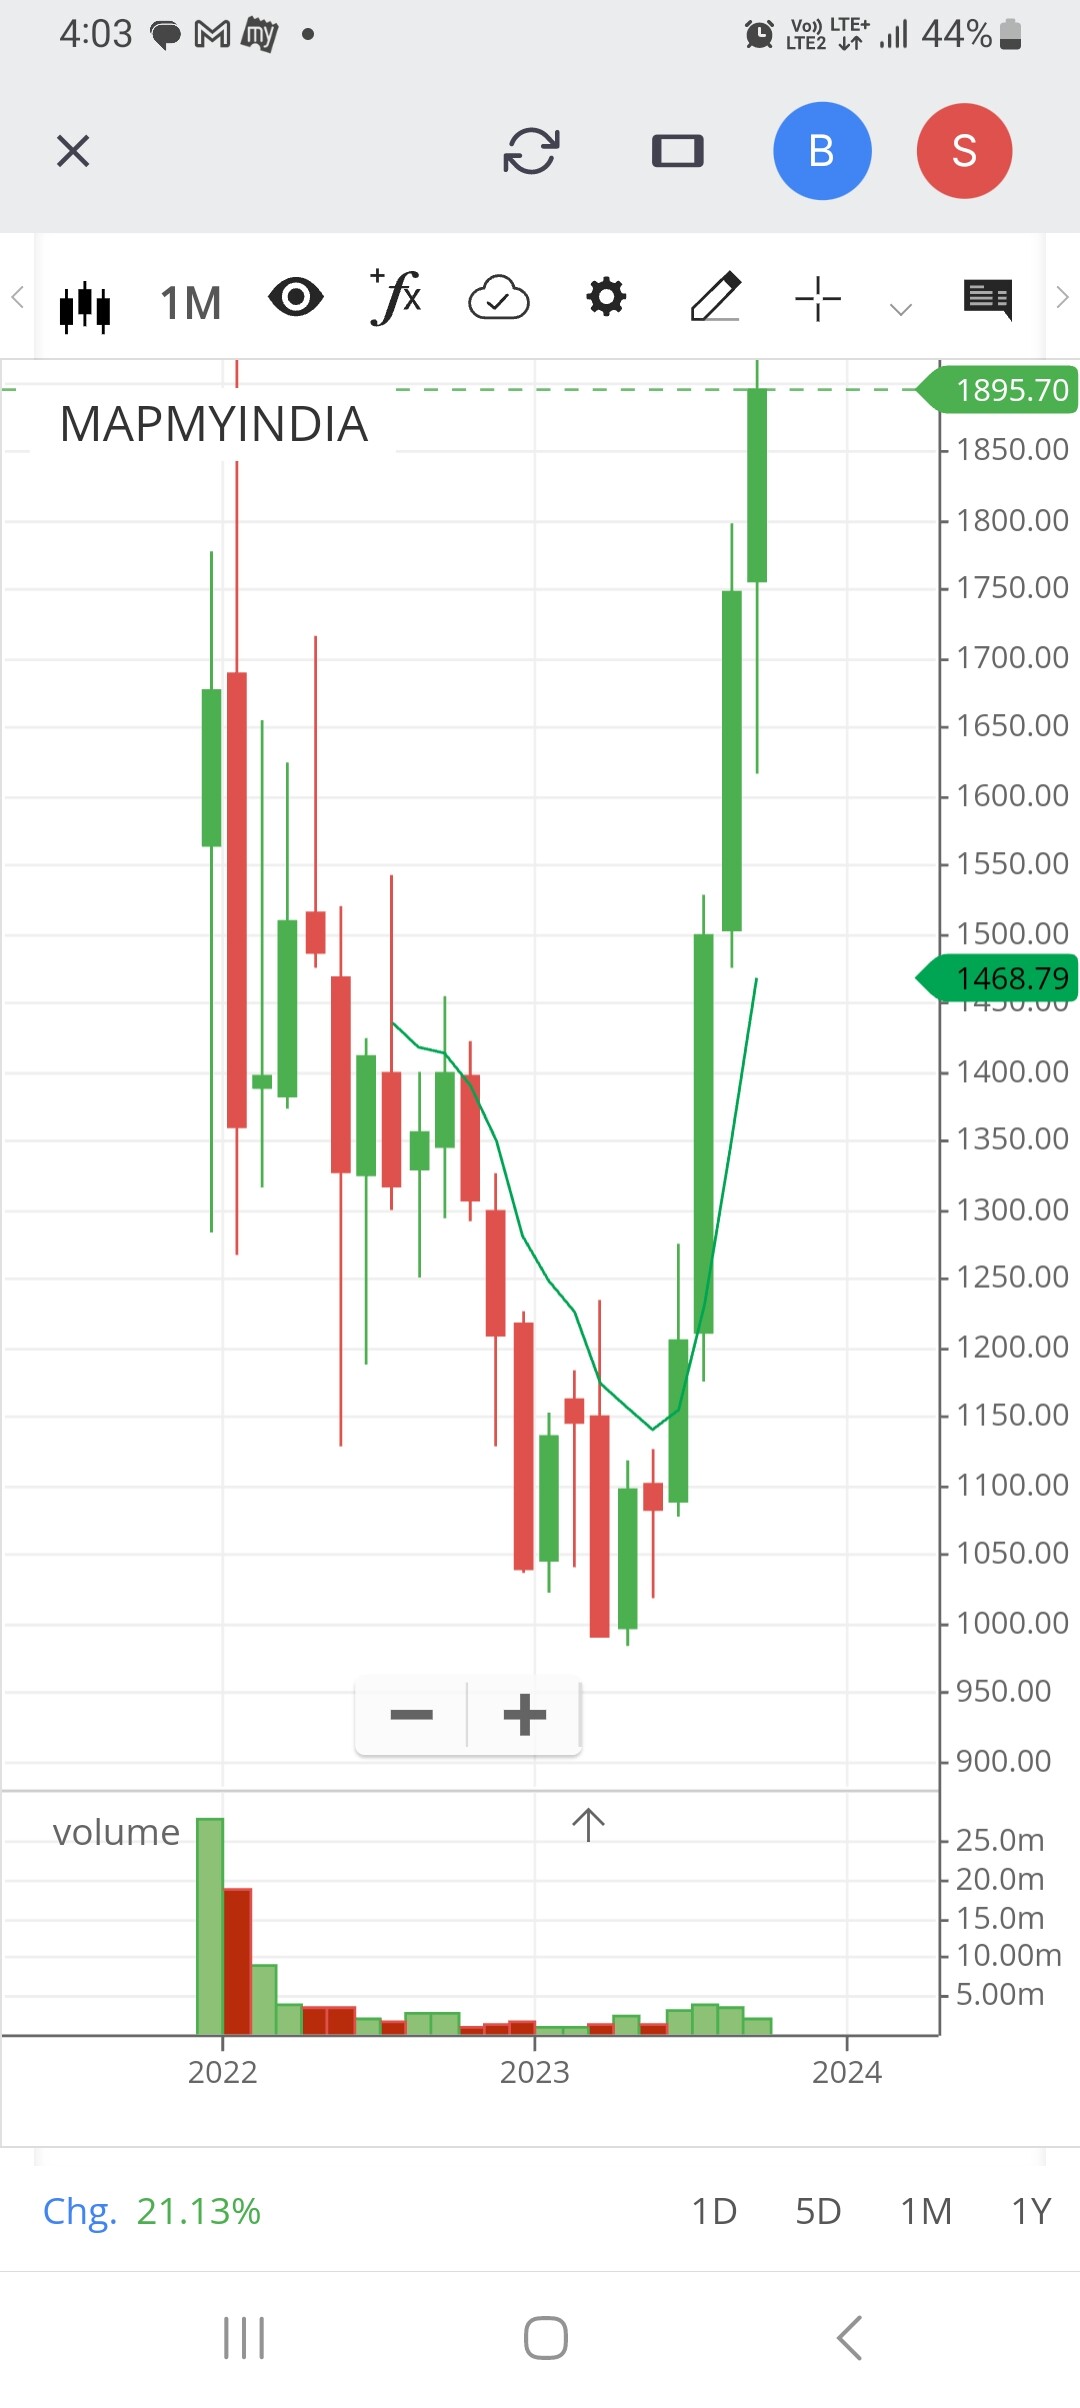
Mapmyindia
Mapmyindia for the last 20 months has been hovering in a wider range of 1917.40 on the upper band and 992 on the Lowe band.
Today after 3:15 it broke it’s life time high of 1917.40 and made a new high of 1918.8 a strong daily close above 1920 can lift prices further to 2300 and then to 2600+ in the very short term
HBL Power (cmp 267)daily chart shows a flag like consolidation for nearly a month. For a day there was a shakeout kind of move below the flag and then the stock price moved within the consolidation range. On Friday it has made a breakout above the falling trendline and closed above it. We need to see some follow up move to this breaout, to conclude that it is genuine. ( These days there are a lot of false breakouts and retests etc before a major upmove from consolidation in a stock starts.)
Coming to the prior rally in HBL, it was a very fast rally from 167 to 294 , nearly a 75 % upmove within less than a month and these kind of moves need cooling off. Here it seems to have taken the form of a flag like consolidation.
If this flag like pattern does play out, then potential target can be in vicinity of 390. (flag pole from 170-295 = 125, breakout point 265. Adding the distance of flagpole to breakout point we get 265+ 125 = 390. However the upmove can take time and may even see consolidations in between, if at all it does play out.
disc: invested as disclosed before.

40 Likes
Hi Hitesh Sir
M a religious follower of ur post since joining VP and u r like a mentor for me as i m highly influenced from u bec my style matches with u as me too pursue techno funda with mild concentrated approach.
Regarding price action and particularly in this thread of 52 Week / ATH , I have few queries which i was thinking to ask you from a long.
-
As i observed in case of price action, mostly (90%) there are breakout traders who want to play post breakout run ups in anticipation of huge returns and hardly i come across reversal traders who play reversal near 52 Week low / lifetime low in anticipation to ride the full trend from Lifetime low to previous ATH. Why so ?
-
I myself is a reversal trader who is comfortable in 52W/lifetime low reversal with a view of few months to 1 year trade time with good qty with a goal to make good returns without much headache.
-
Rationale for point no. 2 is that, breakout reliability needs a booming bull mkt in overall mkt, that stock sector and that particular stock.
Even after that breakout is not so reliable method as its has huge fluctuations on both sides and a person who is not well versed to digest such fluctuations due to low risk profile/mental strength / financial liberty etc etc finds him not so comfortable in this situation.
Also, when the breakout will convert in top is almost uncertain.
If breakout turns in top and we are not lucky, it may result in forced investing for a good amount of time. (1.5~2 years as per my experience) which is again a slow poision for many low risk profile trader/investor.
- Long duration Reversal/52week low play is relatively low fluctuation game as the price is already discounting the worst case scenerio.
Even if overall mkt / sector turns out bad, the variation in reversal is not so high as in case of breakout.
So the gyrations can be managed well from a risk reward point of view.
And if a new low leg has to start again, we can easily exit as we know we r playing reversal which will take much time and gradual process comapared to breakout which is more an adrenaline kind of rush scenerio.
-
My practical experience says that breakout creates more forced investors when the tide turns suddenly from the high to low side compared to reversal untill one has not commanded it with perfection after years of practice / experience.
-
Plz enlighten with ur wisdom as i have not come across many reversal traders on whatsapp/telegram/youtube and other knowledge sharing platforms.
-
Plz guide how to refine and perfect long duration reversal trading /investing . What are do’s and dont’s to make decent amount through reversal in a full time job with minimal affecting mental / physical health as a side income part time job
Thanks
Kamlesh
9 Likes
I have never practised playing the reversal from 52 week lows on a regular basis. I usually go for 52 week highs, or 2-3-4 or multi year high breakouts.
While playing these breakouts, the most important aspect to consider is the kind of consolidation that the stock has undergone before or around the breakout levels. If that is the case there are higher chances of success. E.g A stock that has formed a flag or a rectangular consolidation, triangle, rounding structure etc below or near breakout levels, has a higher success rate .
Coming to 52 week low strategy, I think these stocks qualify for the weakest stocks. The conventional wisdom is that during market correction, the weakest stocks tend to fall the most. Usually these stocks are at 52 weeks low in a strong bull market for a reason. These companies and sector often tend to suffer from strong headwinds. And we are not too sure when things are going to turn for the better.
Whereas in case of stocks breaking out from 52 W or multiyear high, there is a lot in terms of fundamentals going for them. Otherwise it is rare to see stocks going in for these kind of breakouts. And when you get into these kind of stocks you are going with the trend. And trend is your friend.
Mentally it is difficult to buy a stock after it has rallied to hit one year or multi year highs. So actually very few investors are able to buy these kind of breakout stocks. The folks playing breakouts as per my experience are a minority in the market. Playing breakouts requires discipline. It’s not prudent to chase prices too far beyond breakout point. And stop losses have to be followed strictly. And even in same stock if the trend reverses after getting stopped out, hopping on again should not be a problem, mindset wise.
In my experience the best investment case are those stocks which are at 52 week high or multiyear highs and still appear cheap/reasonably priced on conventional valuation parameters.
44 Likes
Hello Sir,
Just want to know your thought process on this kind of market.
All global factors be it US Yield, Crude Oil, Dollar Index are showing -ve for equities. And market is also showing some resistance near ATH whereas Smallcap or Midcap are showing resilience. They are falling less than Main indices.
In this type of market, how to protect our profit?
Should we partially booked our profit and keep some cash for days when we see red screen.
When Small cap or Midcap fall, we know that they fall very badly even 4-5% fall index level is normal for them, so in that case we have to sell at deep cut.
So sir, what strategy should be practiced at this juncture of market?
Thanks
Sandeep
4 Likes
Thanks a lot Hitesh jee for this insight! In your opinion, is there any consolidation pattern more important than others? And also, do you recommend any book or articles which basically teaches you to find these patterns?
Secondly, in your view, which is a better strategy provided fundamentals are still attractive - 52 weeks high or current price very close to all time high?
There will be a variety of consolidation patterns near or above key breakout levels. Regarding which one is better , its anybody’s guess. Each pattern has its own importance. Essentially what each pattern does is provide time for cooling off after a sharp rally and then provide a launch pad for future moves.
Any basic book on technical analysis will provide details about these patterns. But if you are really interested in technicals, it’s better to go ahead and read as many books on technical analysis as possible. The names of these books have been discussed off and on in various posts.
Regarding whether to prefer 52 week high versus all time high, again it depends on company in question. I would take each company seperately to analyse rather than make generalised rules.
9 Likes
A quote attributed to Peter Lynch is "If you spend 14 minutes on Economics, you have wasted 12 minutes of it " For us lay investors this is even more relevant.
Some of us Valuepickr members were fortunate to attend Howard Marks lecture at Mumbai when he was there for the launch of his book, a few years back. He talked at length about various things, and his favourite topic, Risk. But the thing that appealed to me most was an anecdote that he narrated.
It goes like this… One day his son came to him very excited, and said, Dad, you have to buy shares of this auto company. It’s latest model of car launched is selling like hot cakes and the sales numbers reported in the financial newspapers and magazines are mind blowing. So Howard Marks asks him only one question… " Who doesn’t know this fact?"
The current global factors is almost similar to above anecdote. High crude prices, Strong dollar, high US bond yields, any other indicators you name it, are making the headlines. Who doesn’t know about this? Inspite of all this if small and midcaps are rallying then there is something really going for them. Obviously there is some element of froth, and we need to be cautious about getting carried away in companies rallying hard where we do not know much about their fundamentals. But wherever prospects are bright, and wherever there is sectoral fancy, the rallies can go much beyond our expectations.
At some point of time, even small cap, and midcaps also might correct. We cannot live in constant fear of the sky falling on our heads. We have to go out of our house and do our job and work. Similar is the situation with markets. If we have a constant fear of markets crashing then it’s better to sell stuff and sit on cash . Other option is to ride the rally to the maximum with well defined mental stop loss levels. And maintain discipline.
Beauty of the current rally in small and midcaps is that even after such a big strong run up there is a lot of skepticism and disbelief. This is usually a good underlying factor for continuation of the rally. Personally I remain a cautious bull, currently fully invested and enjoying the current ride.
92 Likes
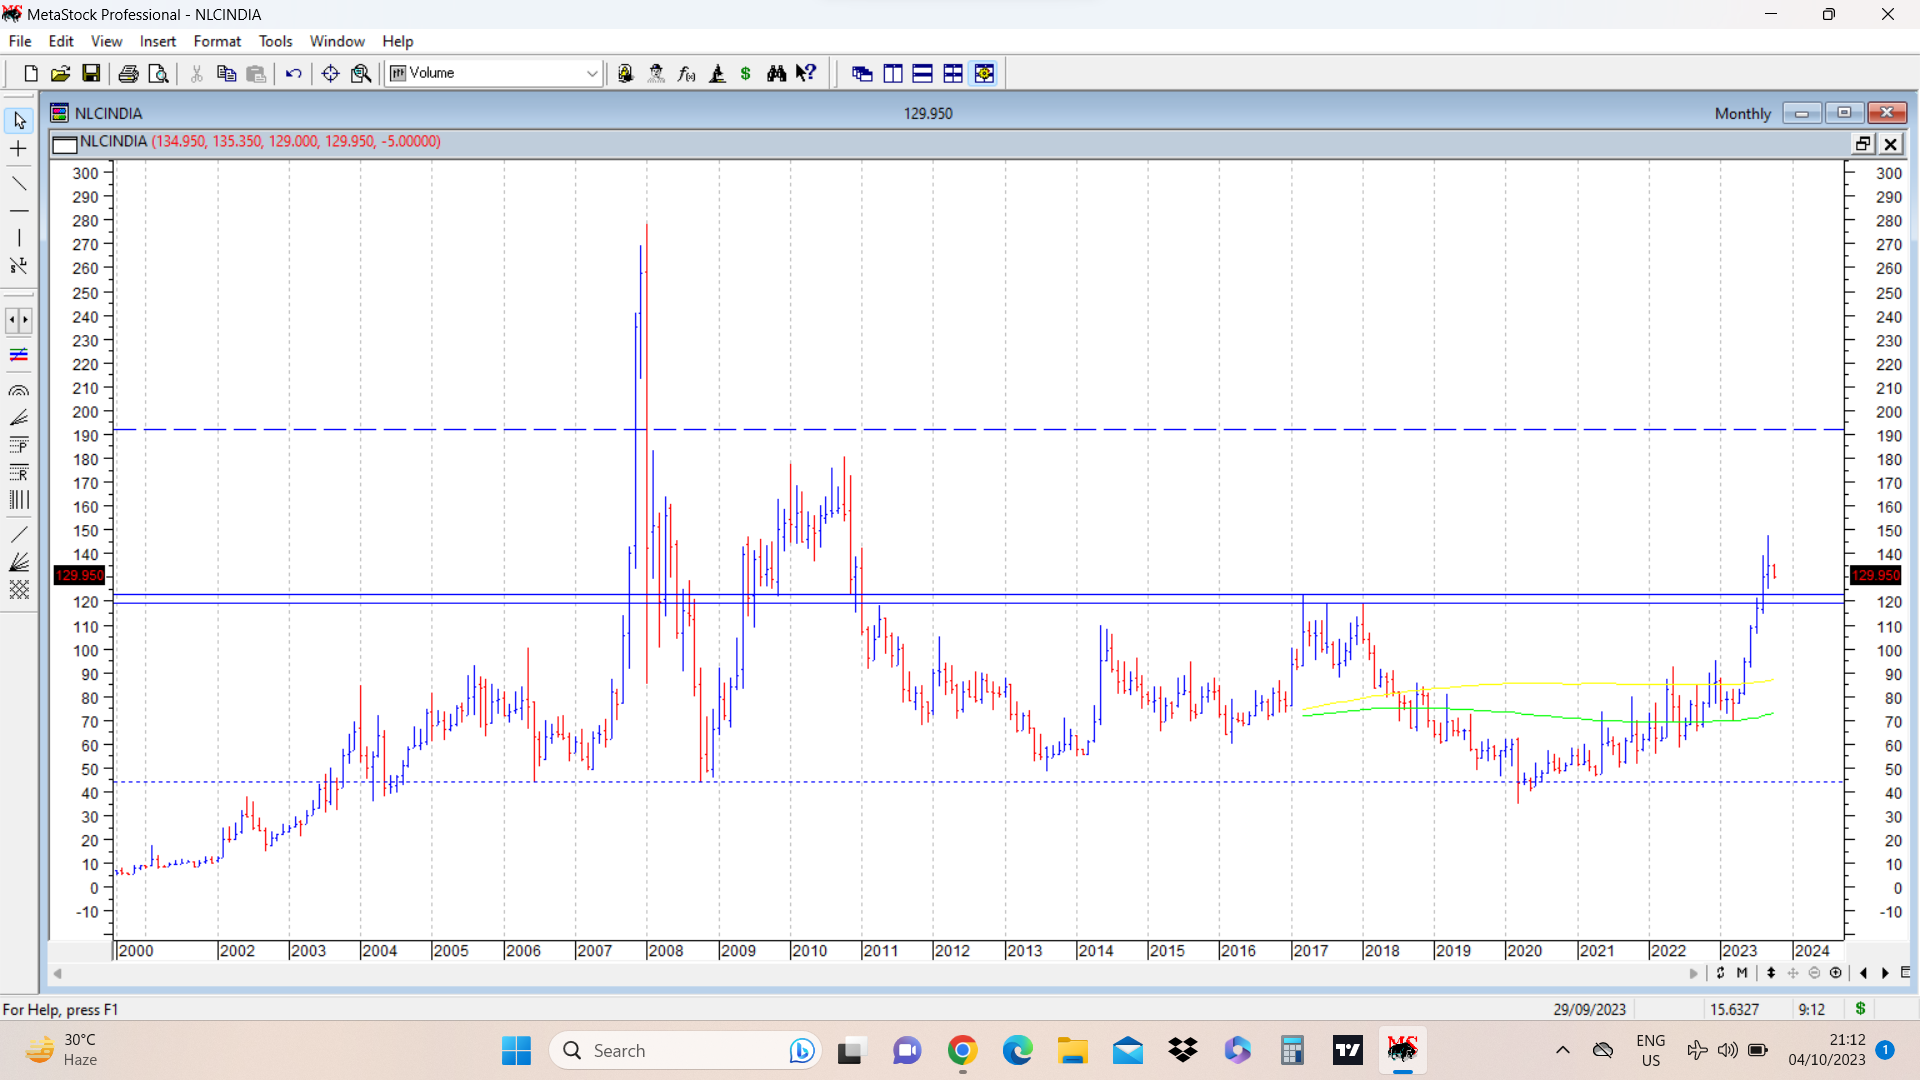
NLC India recently broke out above its 12 year high of 123 in August 2023 and posted a swing high of 147, before it started correcting. Currently it is at 129. Attached monthly chart shows a previous strong band of resistance between 119-123, which offered resistance multiple times in past 12 years. Previous major peaks are at 180 and 277, in years preceding 12 years. Earlier name was Neyveli lignite corporation and it is a PSU company.
A similar company, ( though with much more fancied prospects in rare earth metals) GMDC has been making the waves by crossing its all time high. Its major product also remains lignite. Lignite is an ancillary play to power sector, which is used to produce electricity.
I got interested in this company because it had two current fancies within it. Power ancillary and PSU. And to top it, it crossed a 12 year high. A good thing I like about the chart is the rounding structure from Jan 2018 and then a breakout above the highs of that structure.
The cons about this situation . First the PSU tag is getting bandied about too much in markets these days. How long this fancy lasts is anybody’s guess. Secondly overall markets have been a little bit rocky. And third, govt holds 79% stake and there is always a risk of govt coming out with a FPO kind of offering once there is a rally. We have seen these things in PSUs recently.
disc: I have a small starter position, which I intend to scale up if and when the trade starts going majorly in my favour. ( not a recommendation, anyone contemplating investment should do their own diligence. )
40 Likes

Supreme Petro
Technicals : at all time high.
Funda: 1.have 60 % market share in HIPS after shutdown of LG in 2020
2. almost 100% market for XPS and EPS
3. Entering ABS resin space which has 40% imports currently and balance supplied by Bhansali and old worn out bayer plant currently run by styrenix.
4. proven partnership management of taparia and raheja, wherein taparia increased stack by 4%
5. professionally run company.
6. stable demand for AC/washing machine/home appliance over next three to four years will keep resin demand going
Negative:- 1.available at 25 PE compare to historical avg of 12.
2, international over supply can spoil the show, commodity product.
Question:- can those three (one big and two small qualify as cup and handle and can this be a case to be considered as all time high candidate worth investing?
reply and comments highly appreciated
discl: invested
4 Likes
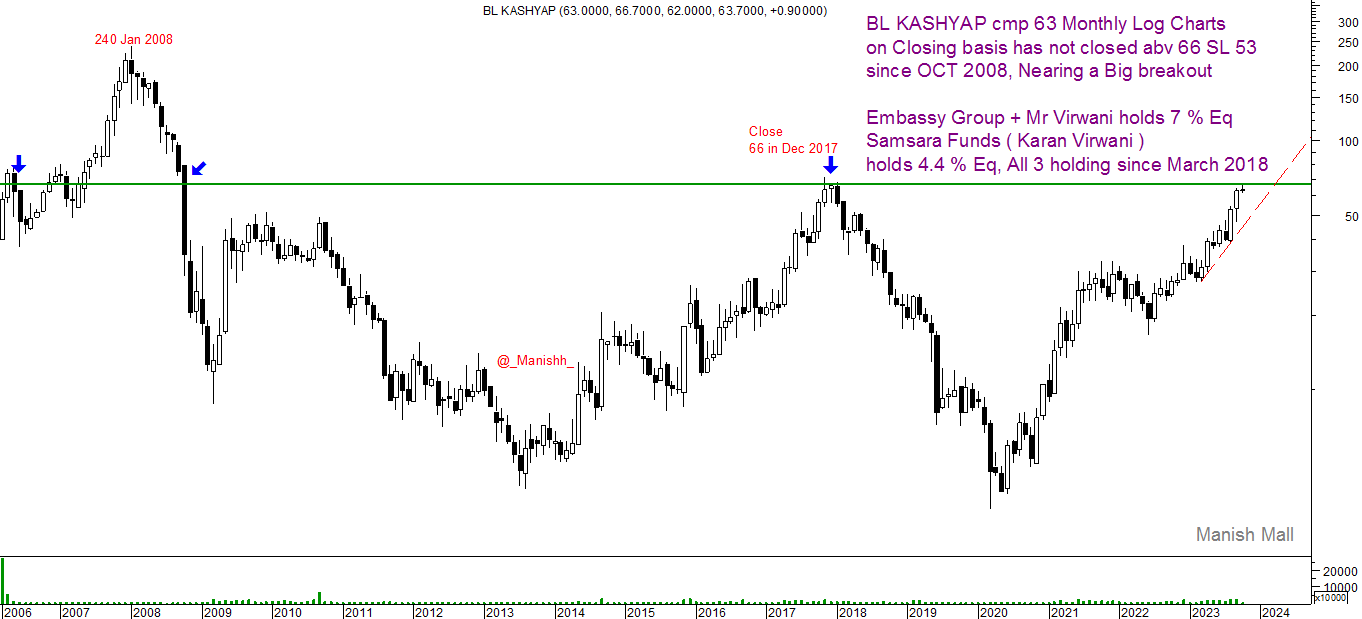
BL KASHYAP cmp 63 Monthly Log Charts
on Closing basis has not closed abv 66 SL 53
since OCT 2008, Nearing a Big 15 Year breakout
with good delivery based buying observed
Promoter 61.6 % Eq was Nibbling Small insider buying last qtr
Embassy Group + Mr Virwani holds 7 % Eq
Samsara Funds ( Karan Virwani )
holds 4.4 % Eq, All 3 holding since March 2018
Mcap 1400 Cr : order book 3000 Cr
last month Order win was from Delhi International Airport
4 Likes
Very good setup in Kalyan Jewellers
Currently at 52 Week High with good volumes, looking to give Breakout out of its ATH value

3 Likes
Similar to he HBL power chart posted by you,
the Daily chart of Powermech projects also seems interesting in thecurrent setup.
- one can observe the stellar move it gain, post rejection of the HnS pattern. (Failure of HnS patterns and move above right shoulder tend to be powerful bullish patterns).
- The current run up ended at 5000, followed by a correction of apprx 25%.
Currently this seems to be forming a Flag with a Pennant formation pattern.
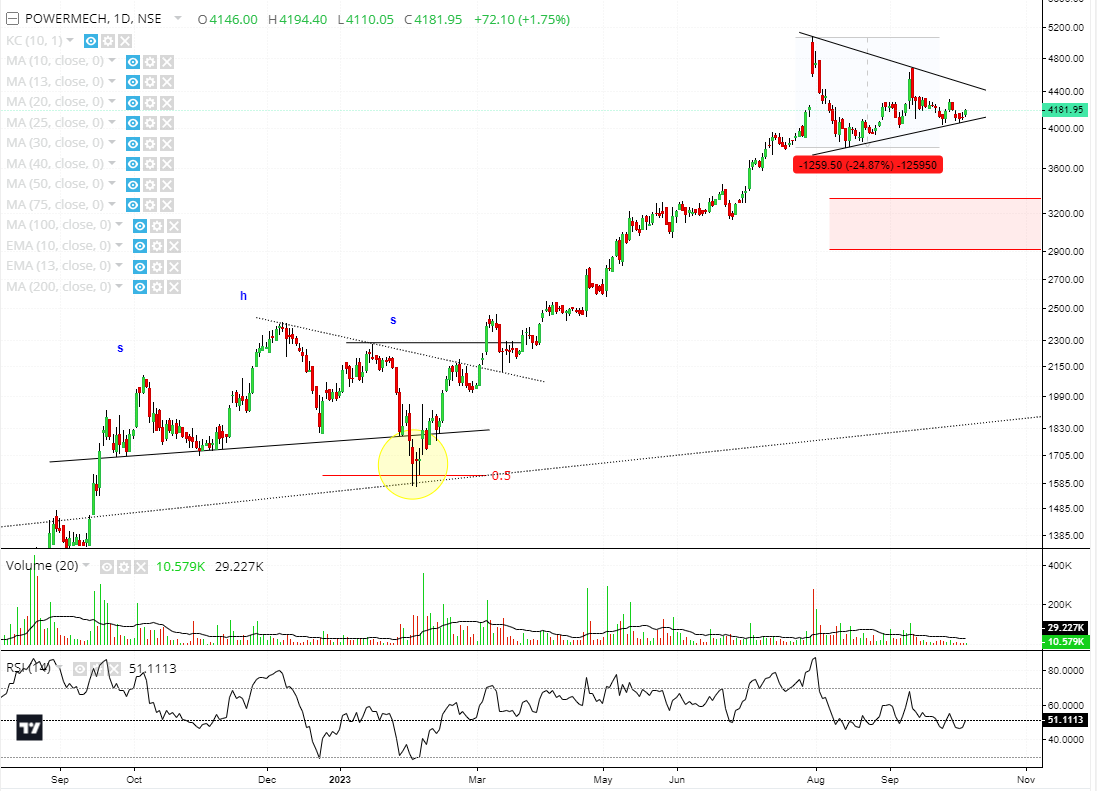
This is more a triangle pattern than a flag or pennant. A triangle is an indeterminate pattern. It can break on either side. So, basically, nothing can be concluded from this pattern.
14 Likes
Rajshree Poly Pack Ltd. made a new 52week high with huge volumes. Infact there is a volume cluster in last few days. Stock closed at 240. Previous ATH is 280-290 range.
As regards fundamentals the JV (olive pack) would be completing it’s Greenfield project by q4fy24. This plant has capacity to double the existing topline of the company
Company has completed its expansion and expects benefits from higher capacity utilisation
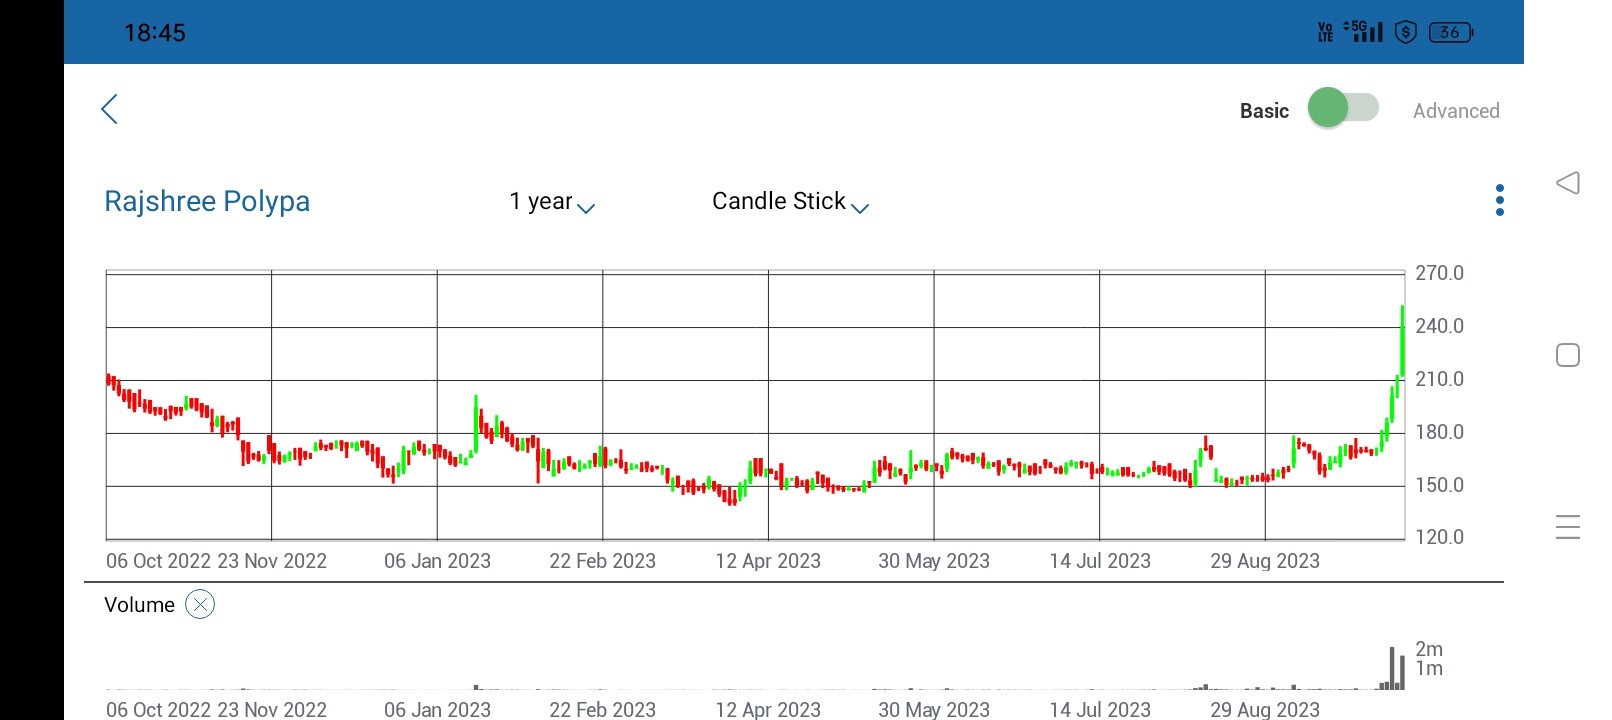
Regards
Disc. Invested from lower levels
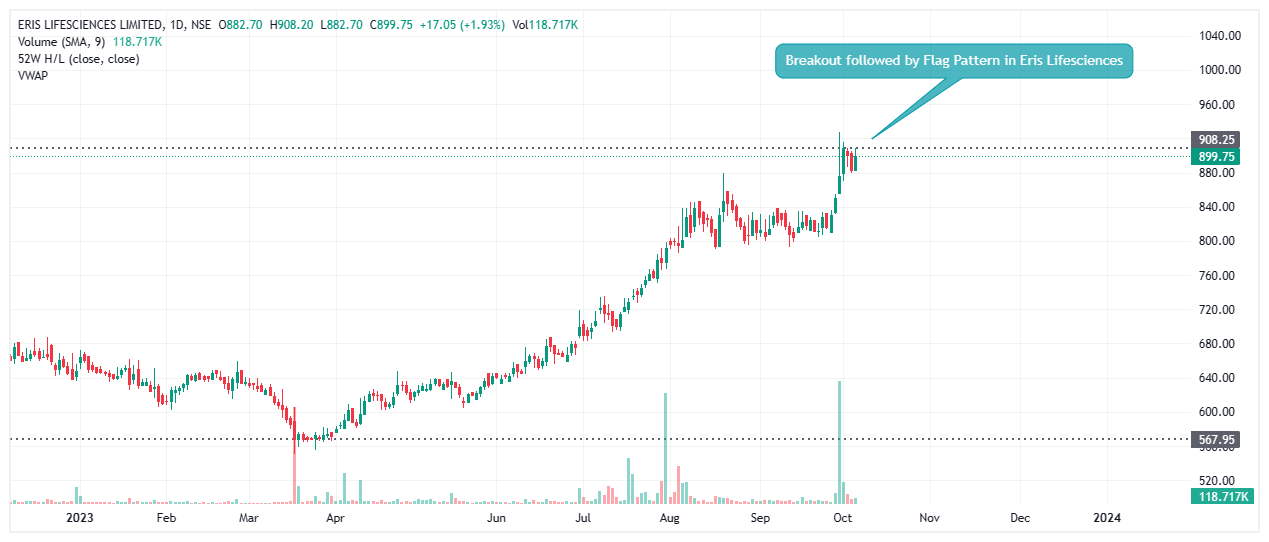
Breakout followed by Flag Pattern in Eris Lifesciences at 52 Week High
Have been watching over this stock from this ValuPickr post
Eris Lifesciences - 100% of sales from India Pharma Market - Stock Opportunities - ValuePickr Forum
1 Like
@nagesh_reddy in general an inv h&s is a reversal pattern … basically a bottom formation. So ideally you should be looking for this pattern while the stock is making a bottom.
5 Likes