
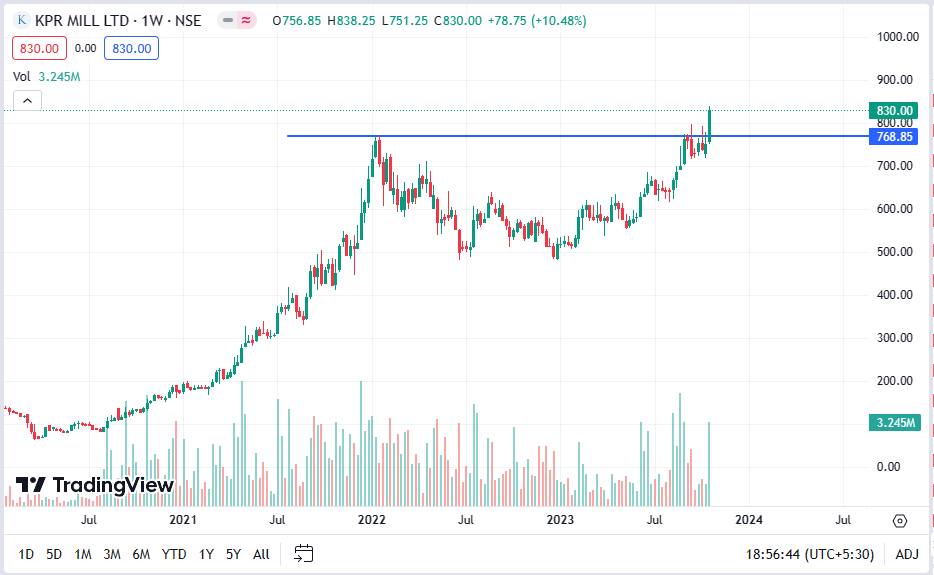
Cup and Handle BO in KPR Mill on weekly Time Frame
6 Likes
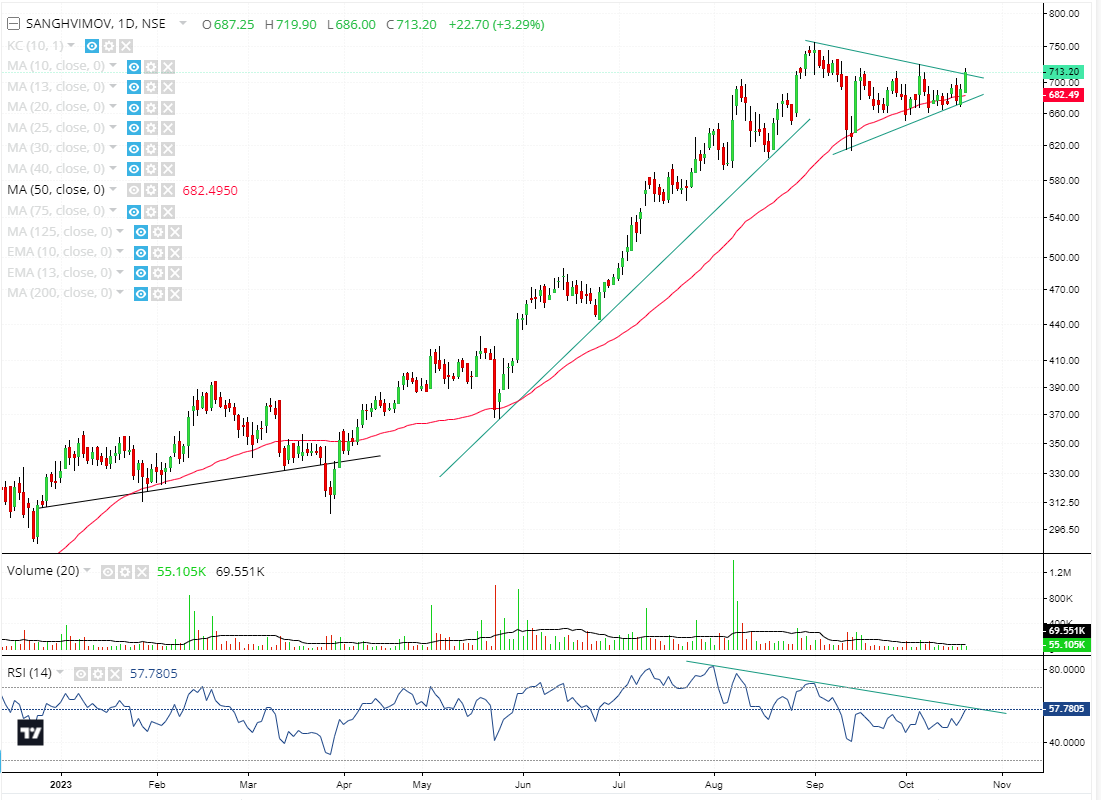
Sanghvi Movers: Daily Chart
- After a failed HnS pattern and brilliant upmove, now it seems to have formed a Flag and Symmetrical triangle/Pennant pattern and is breaking out.
Safe to assume Bullish bias ahead
4 Likes
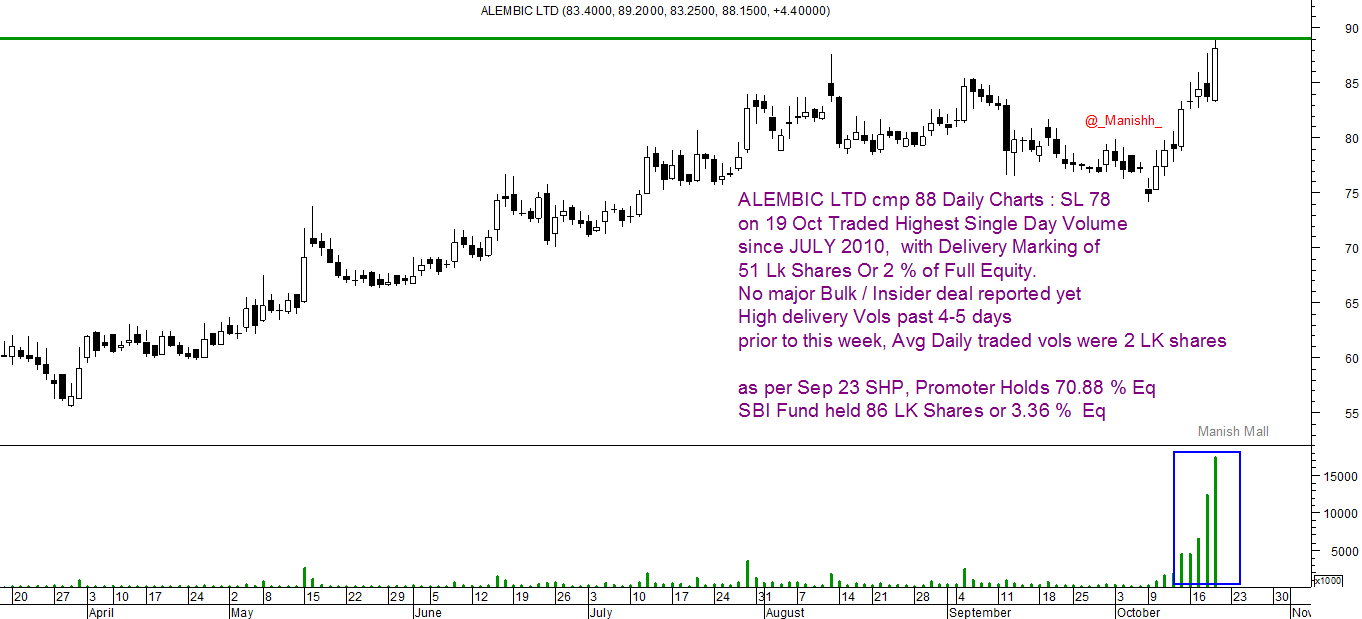
ALEMBIC LTD cmp 88 Daily Charts : SL 78
on 19 Oct Traded Highest Single Day Volume since JULY 2010,
Almost 1.80 Cr shares Traded
with Delivery Marking of 51 Lk Shares Or 2 % of Full Equity.
No major Bulk / Insider deal reported yet
High delivery Vols past 4-5 days
prior to this week, Avg Daily traded vols were 2 LK shares
as per Sep 23 SHP, Promoter Holds 70.88 % Eq
SBI Fund held 86 LK Shares or 3.36 % Eq
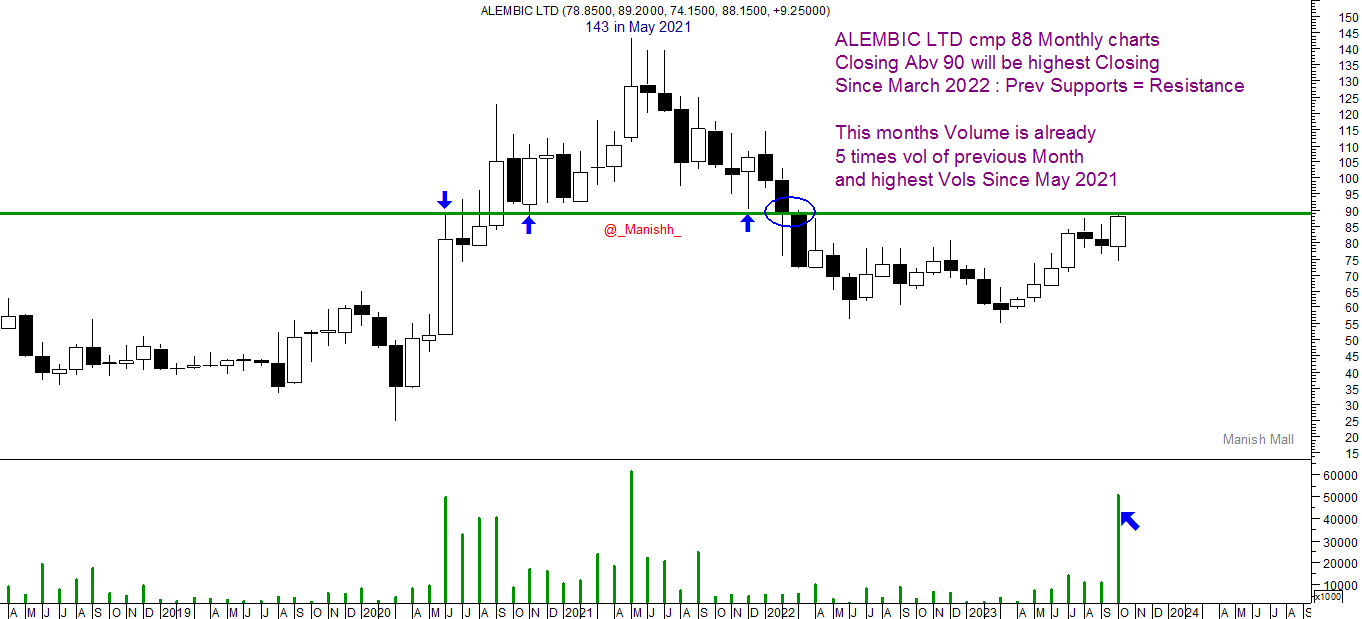
ALEMBIC LTD cmp 88 Monthly charts
Closing Abv 90 will be highest Closing
Since March 2022 : Prev Supports = Resistance
This months Volume is already
5 times vol of previous Month
and highest Vols Since May 2021
1 Like
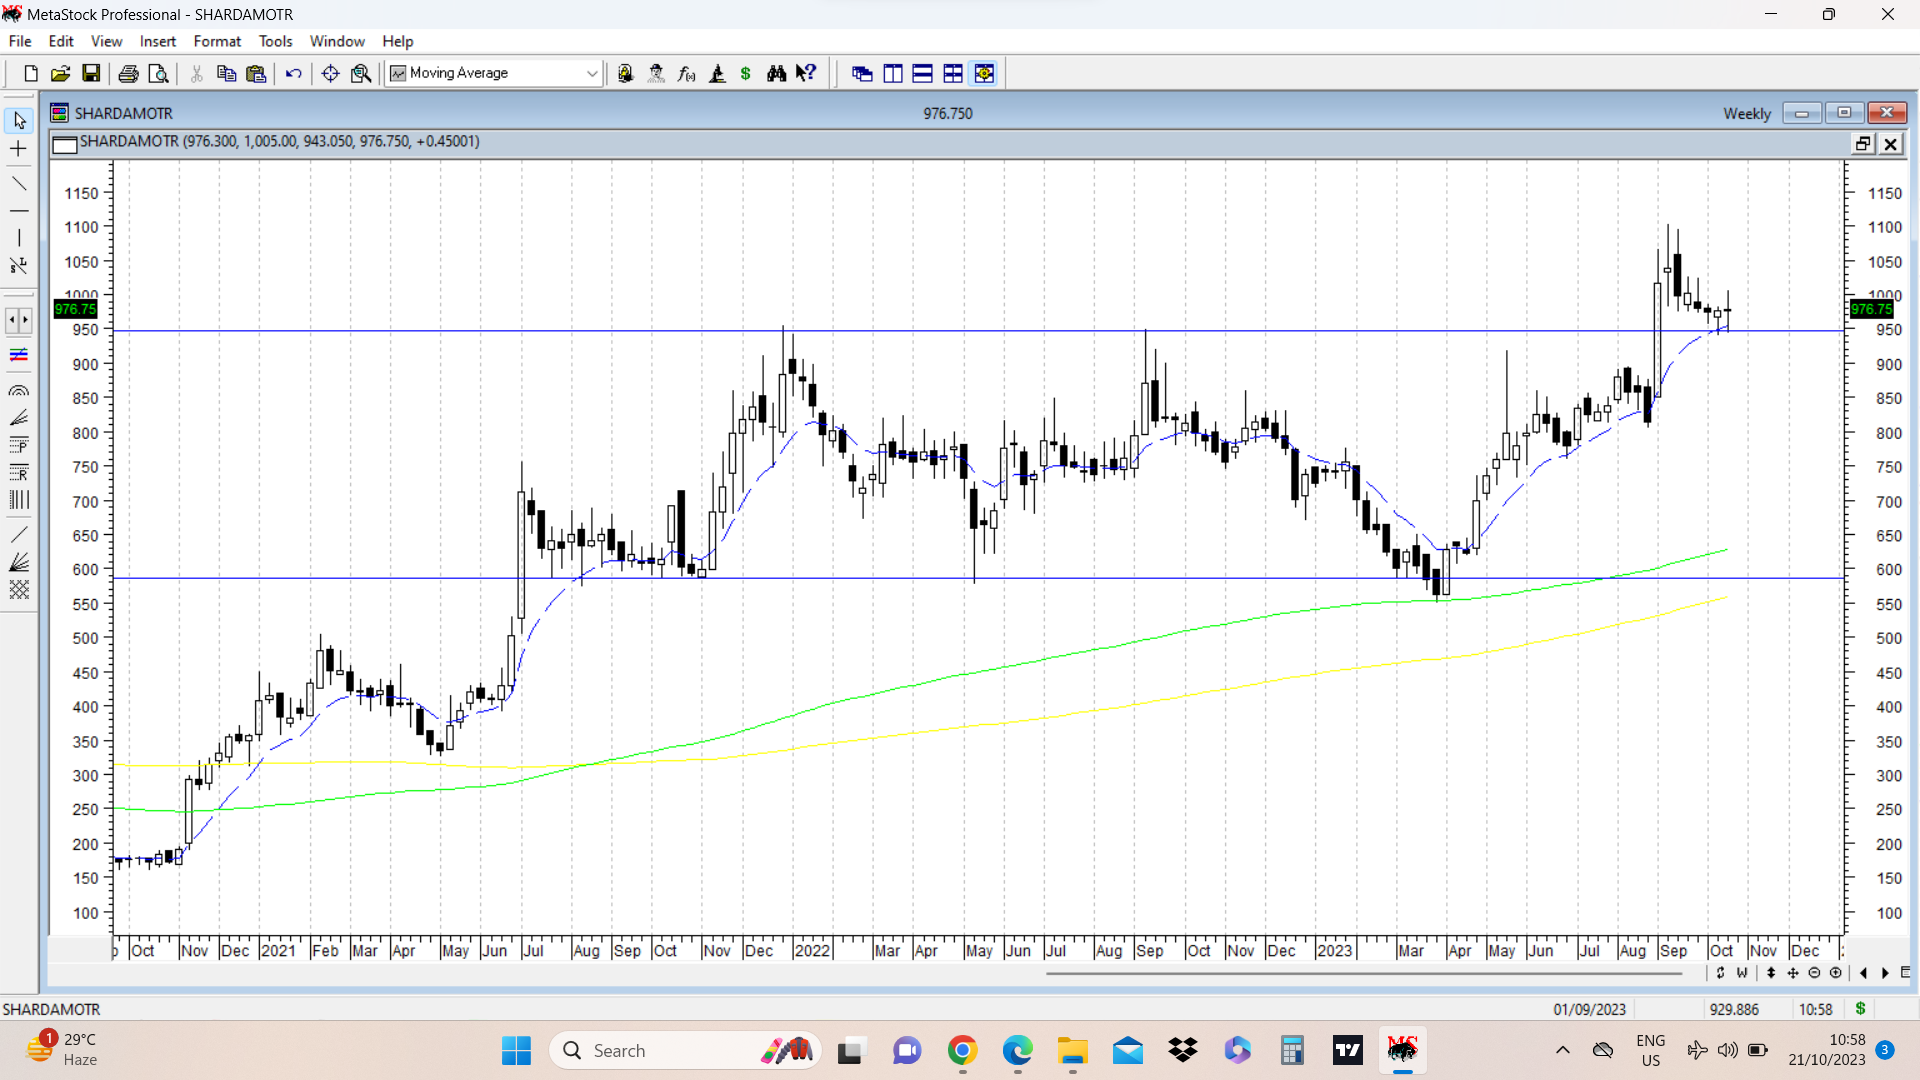
Sharda Motors gave a breakout above previous all time high of 950 ( high of 954 in Dec 2021 and high of 949.90 in Sep 2022) and few weeks back in Sep 2023 with a big bullish weekly candle and went on to post a fresh all time high of 1101 in Sep 2023. Since then it has been in a corrective mode and came down and retested the breakout zone of 950 twice, by posting swing lows around 940 and closed last week at 976.
Usually post multi year and all time high breakouts, there are retests, often multiple retests and consolidation for few weeks, months before stock price starts taking off again. Retest and consolidation is the pattern happening in Sharda motors currently. Note the 10 week EMA in dotted blue line providing support to the stock price during corrections. (disc: invested and views may be biased)
15 Likes
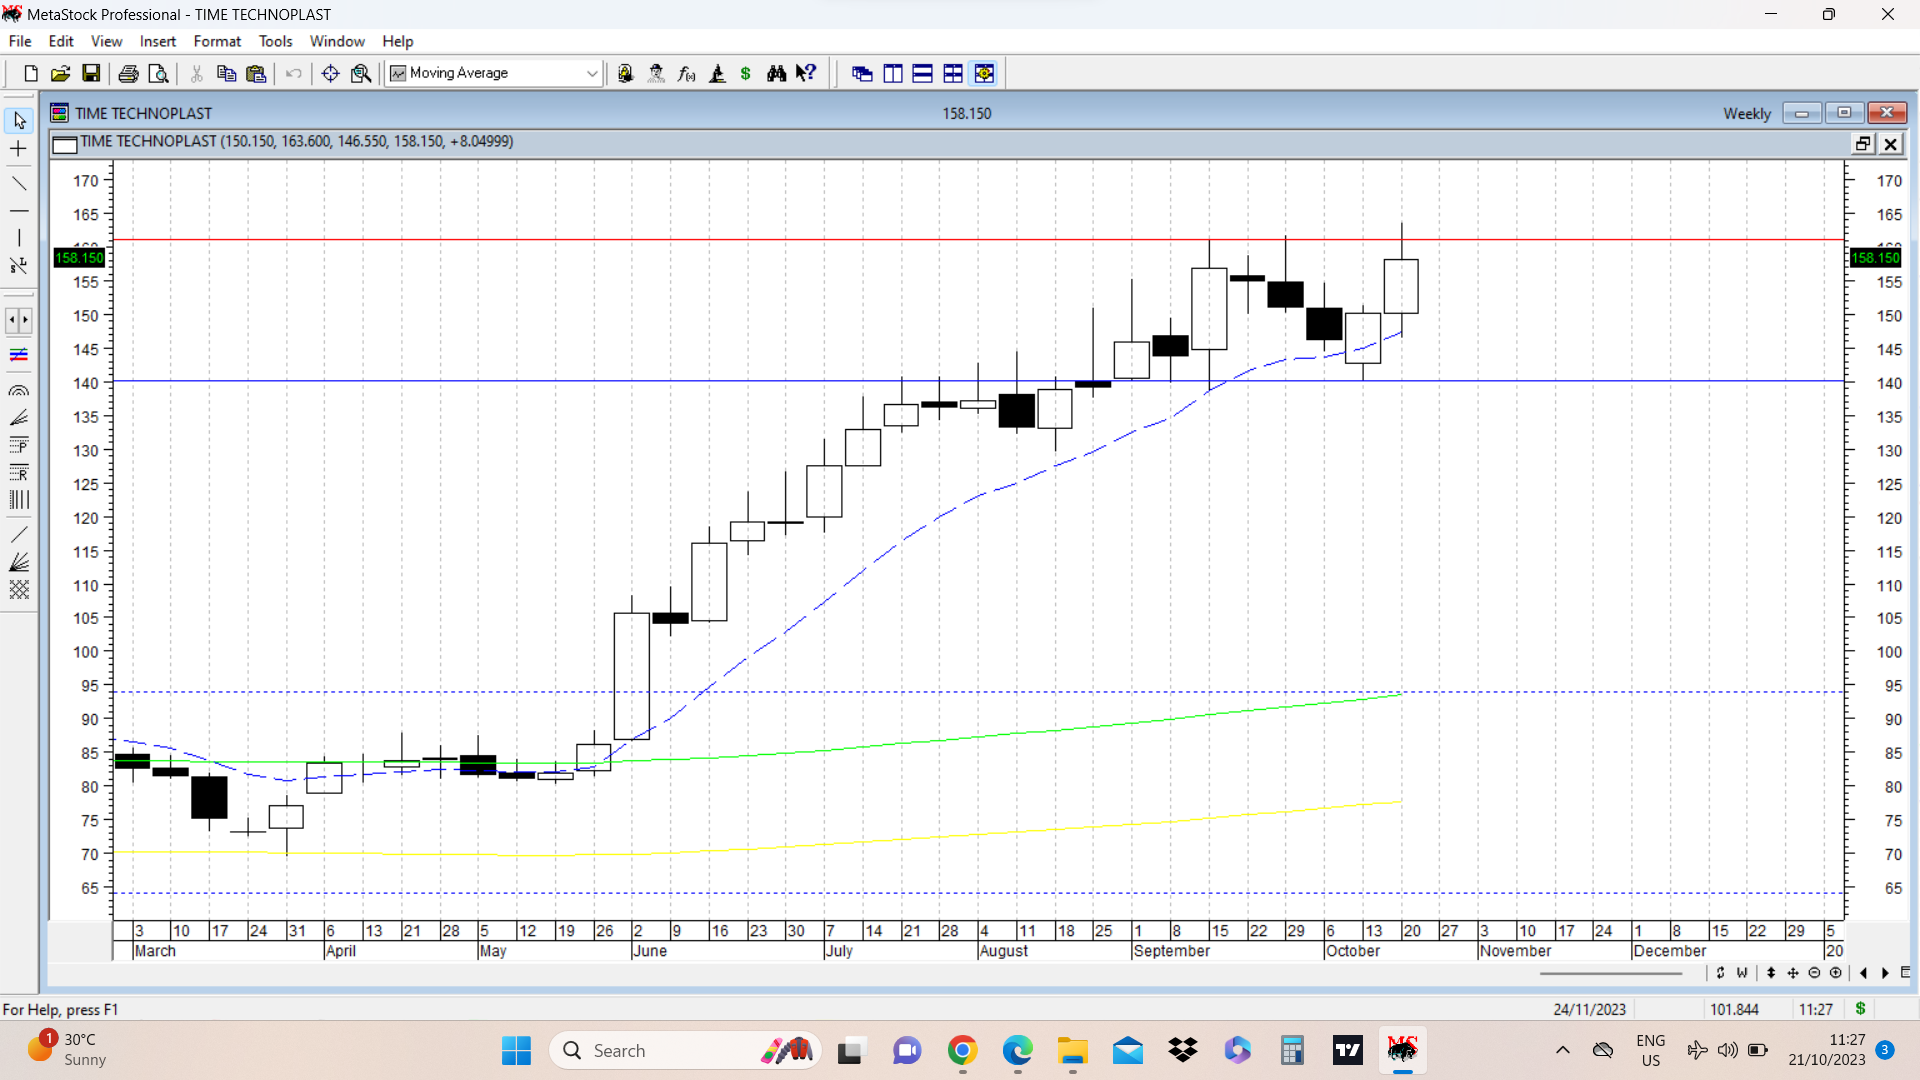
TIME TECHNO UPDATE.
Time techno closed this week at 158, with a bullish weekly candle. Previously we saw a big bullish weekly candle closing on 15 Sep 2023 (with open at 144.80, low at 138.60 high at 161, and close at 156.85.) Post this bullish candle on 15 Sep 2023, we had 3 weekly smallish bearish candles whose bodies are contained within the body of the bullish candle. And since last 2 weeks, we had bullish candles, which has led to a close this week at 158.15.
A candle stick pattern known as rising 3 method has a big bullish candle followed by 3-4 smallish bearish candles and this is followed by a big bull candle which closes above high of the first bullish candle. Description of that pattern on googling is as follows.
-
The first bar of the pattern is a bullish candlestick with a large real body within a well-defined uptrend.
-
Subsequent candlesticks, normally three consecutive bearish small-bodied candlesticks that trade above the low and below the high of the first candlestick.
-
The last bar is another bullish candlestick with a large real body that breaches the high and closes above the high and close established with the first candlestick, which suggests the bulls are back in control of the security’s direction.
Shape of the whole pattern assumes the letter N. In the classical rising three method, the final candle is a single large bullish candle which covers the bodies of all previous 4 candles. Here in case of time techno weekly candlesticks, there are two back to back bullish candles which cover bodies of previous 4 candles. But shape of N is visible. Key resistance zone remains 160-164. Closing and staying above that level will ensure resumption of the uptrend. (disc: invested as disclosed before. not a recommendation)
17 Likes
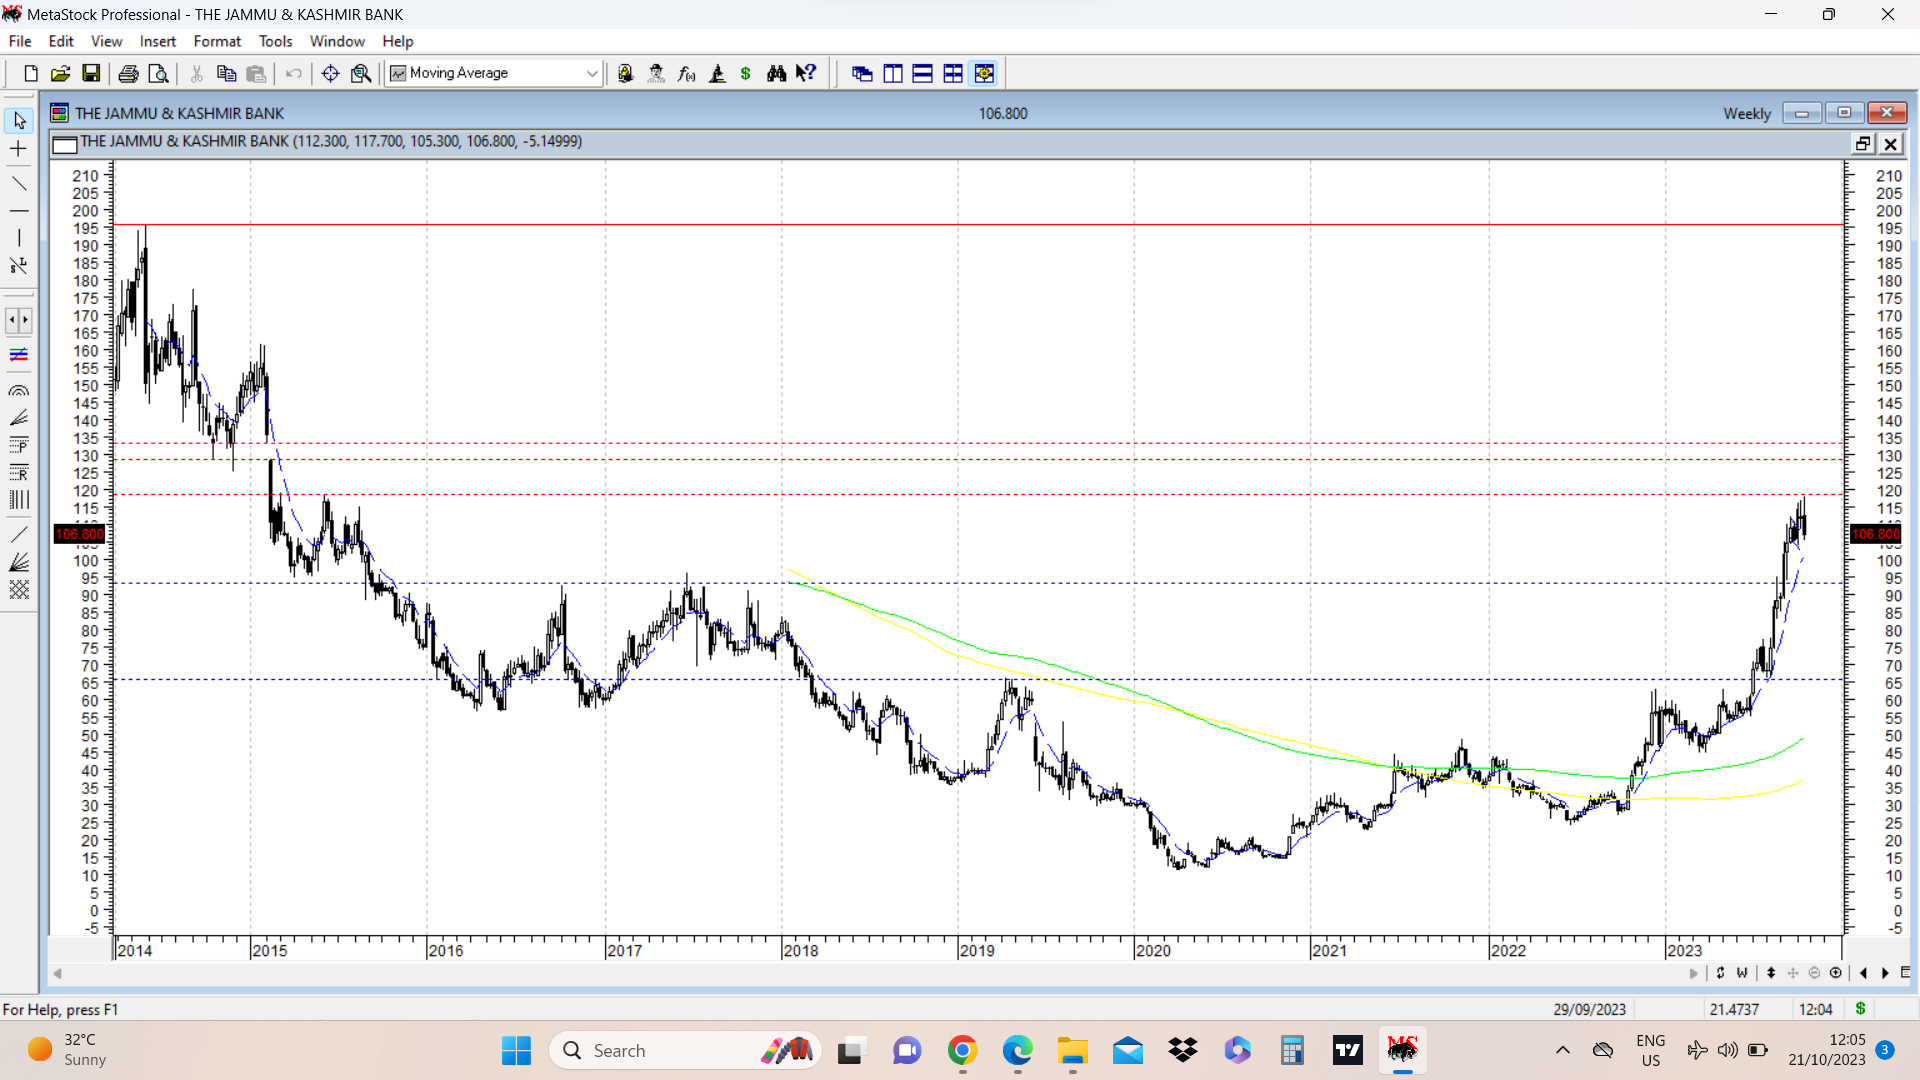
J&K Bank (cmp 107) chart posted below shows key resistances crossed at 66 and 93, marked in dotted blue horizontal lines. Structure on weekly chart is a rounding structure. On way up, key resistances are marked in dotted red horizontal lines at 118.50 and a weekly gap down area of 128-133. And finally previous all time high of 195.
Company posted good quarterly results yesterday, press note of which is attached. disc: invested. (not a recommendation, anyone contemplating investing needs to do their own diligence)
JK Bank q2 fy 24 press release.pdf (281.7 KB)
14 Likes
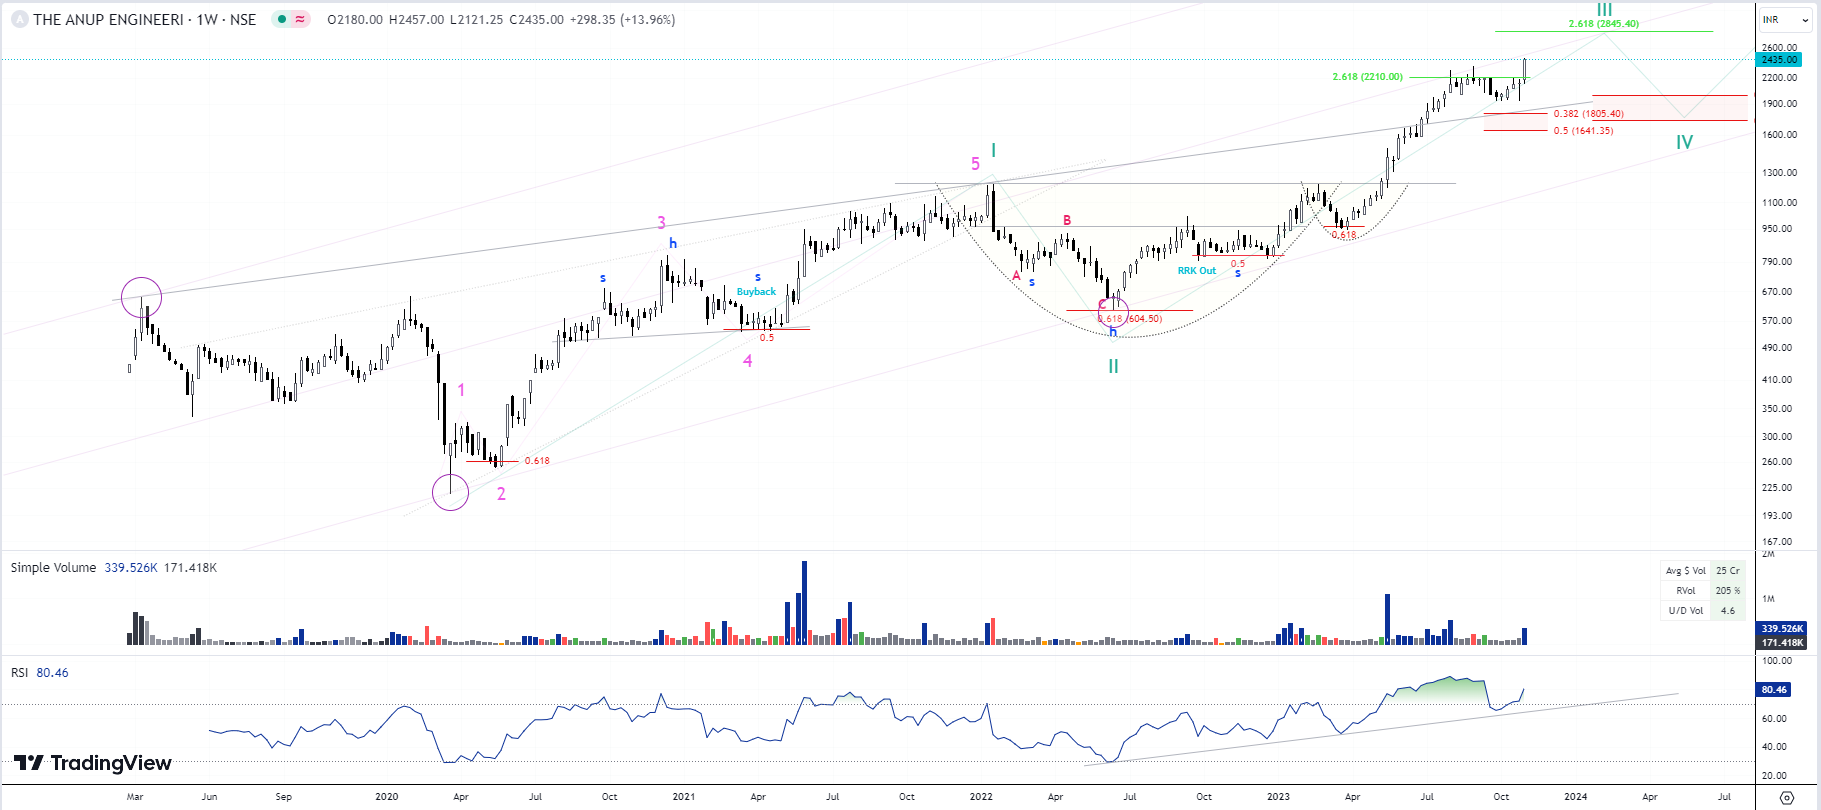
Update on ANUP Engineering: 1115-1840-2457
- Multiple patterns playing out on Weekly TF chart and follow up continues toward making new highs.
- After hitting Fibo 2.618 levels in july23, took a pause for a few months in a tight range.
- currently breaking out with big volumes post posting excellent Q results.
Safe to assume bullish bias ahead.
5 Likes
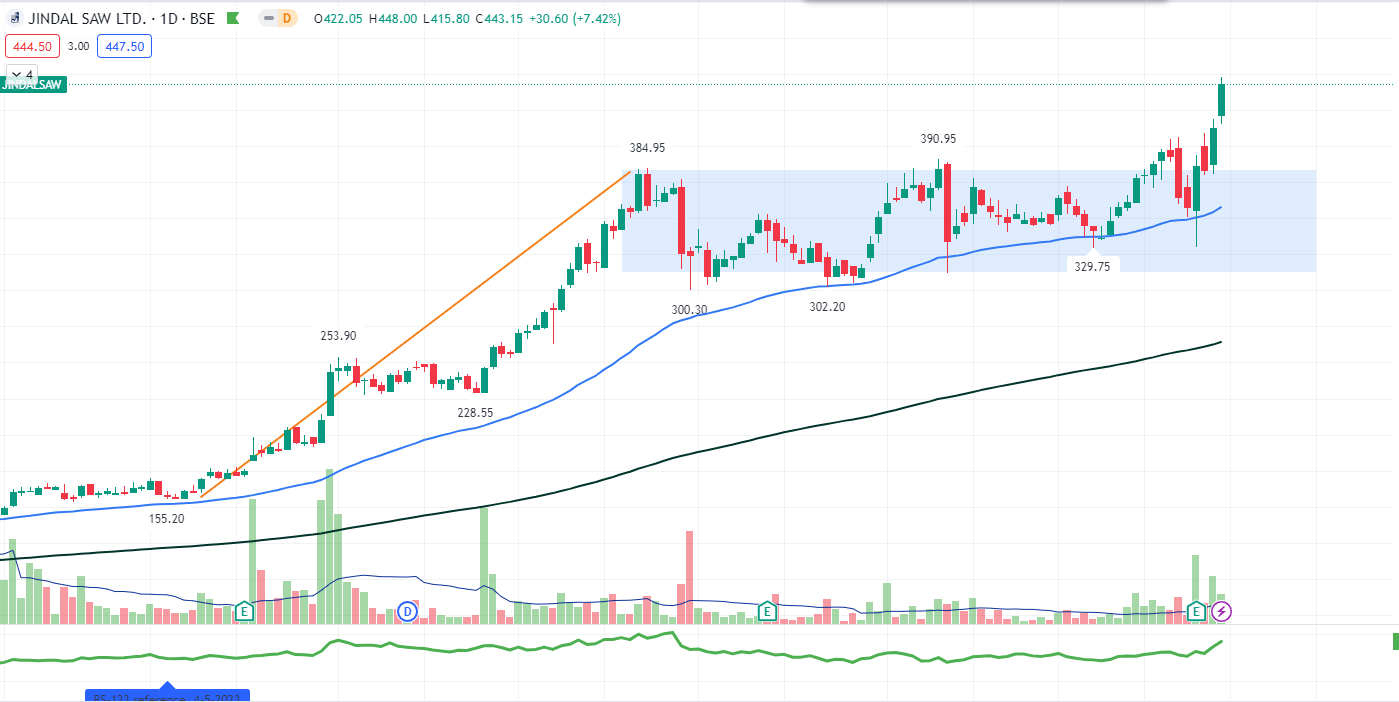
JINDAL SAW
Formed a base/ flag like structure on both daily and weekly charts and has recently moved out with high volumes. Close to 52 week high. Relative Strength also moving up.
2 Likes
One important breadth indicator is “Net new 52 week high” indicator which a lot of people talk about. Can anyone help and tell me where we can see the chart of this indicator of say BSE 500 stocks. The chances of breakouts working are better when the indicator is net positive and continue to stay positive.
1 Like
Atlas Market Breadth (chartink.com)
You can check this chartink dashboard which gives you a graph of Net New Highs made each day. Combine it with industries hitting 52 W high each day and you can figure out the sector rotation as well.
8 Likes
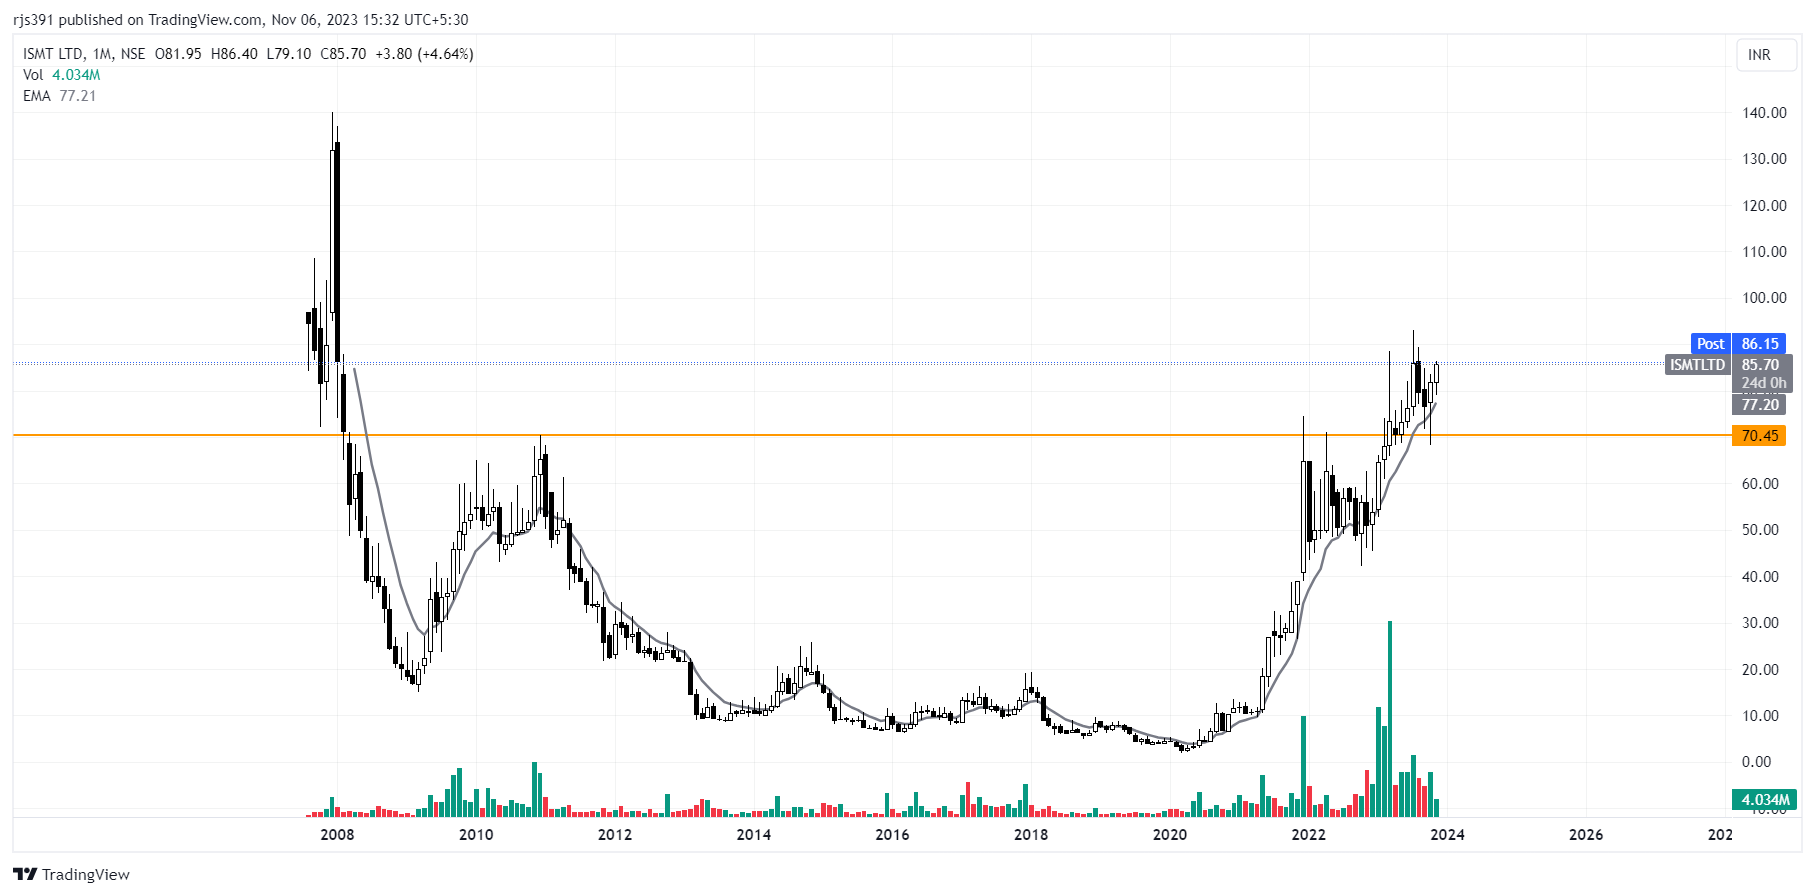
Recently promoter group of ISMT Ltd. bought shares which represent ~ 5% of the company’s market cap. Technically as well 70 looks like a resistance level post which 137-140 is the resistance zone. CMP of thr stock is around 85. @hitesh2710 Hitesh Sir- Your views would be appreciated on this as the stock is also in the booming sector right now which is steel pipes.
1 Like
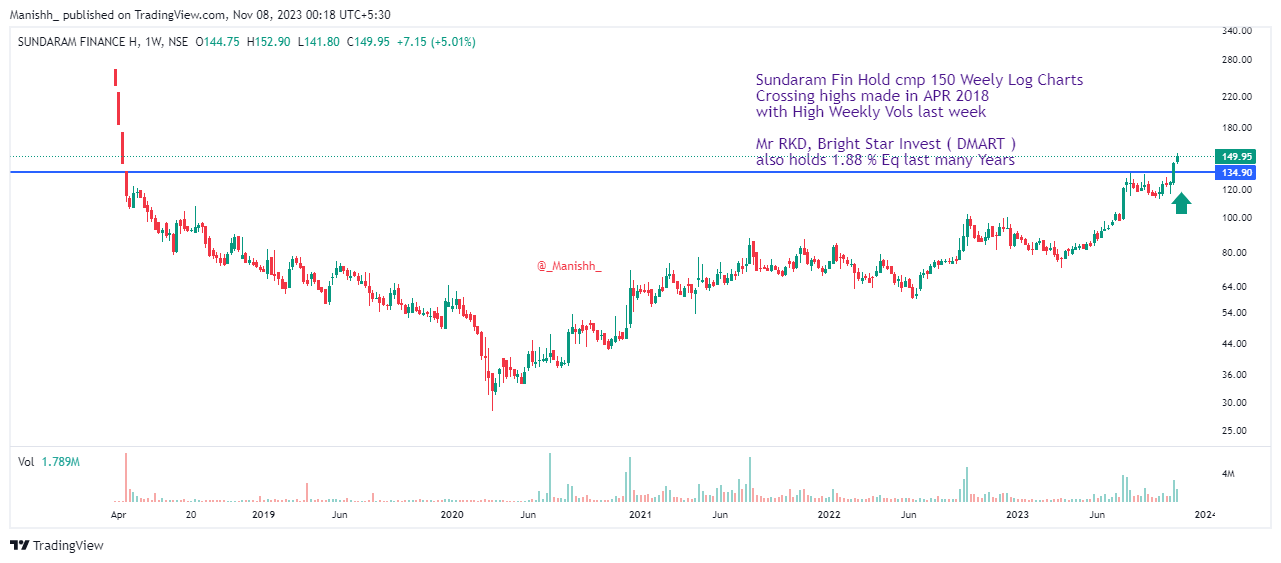
Sundaram Fin Hold cmp 150 Weely Log Charts
Crossing highs made in APR 2018
with High Weekly Vols last week
Mr RKD, Bright Star Invest ( DMART )
also holds 1.88 % Eq last many Years
1 Like
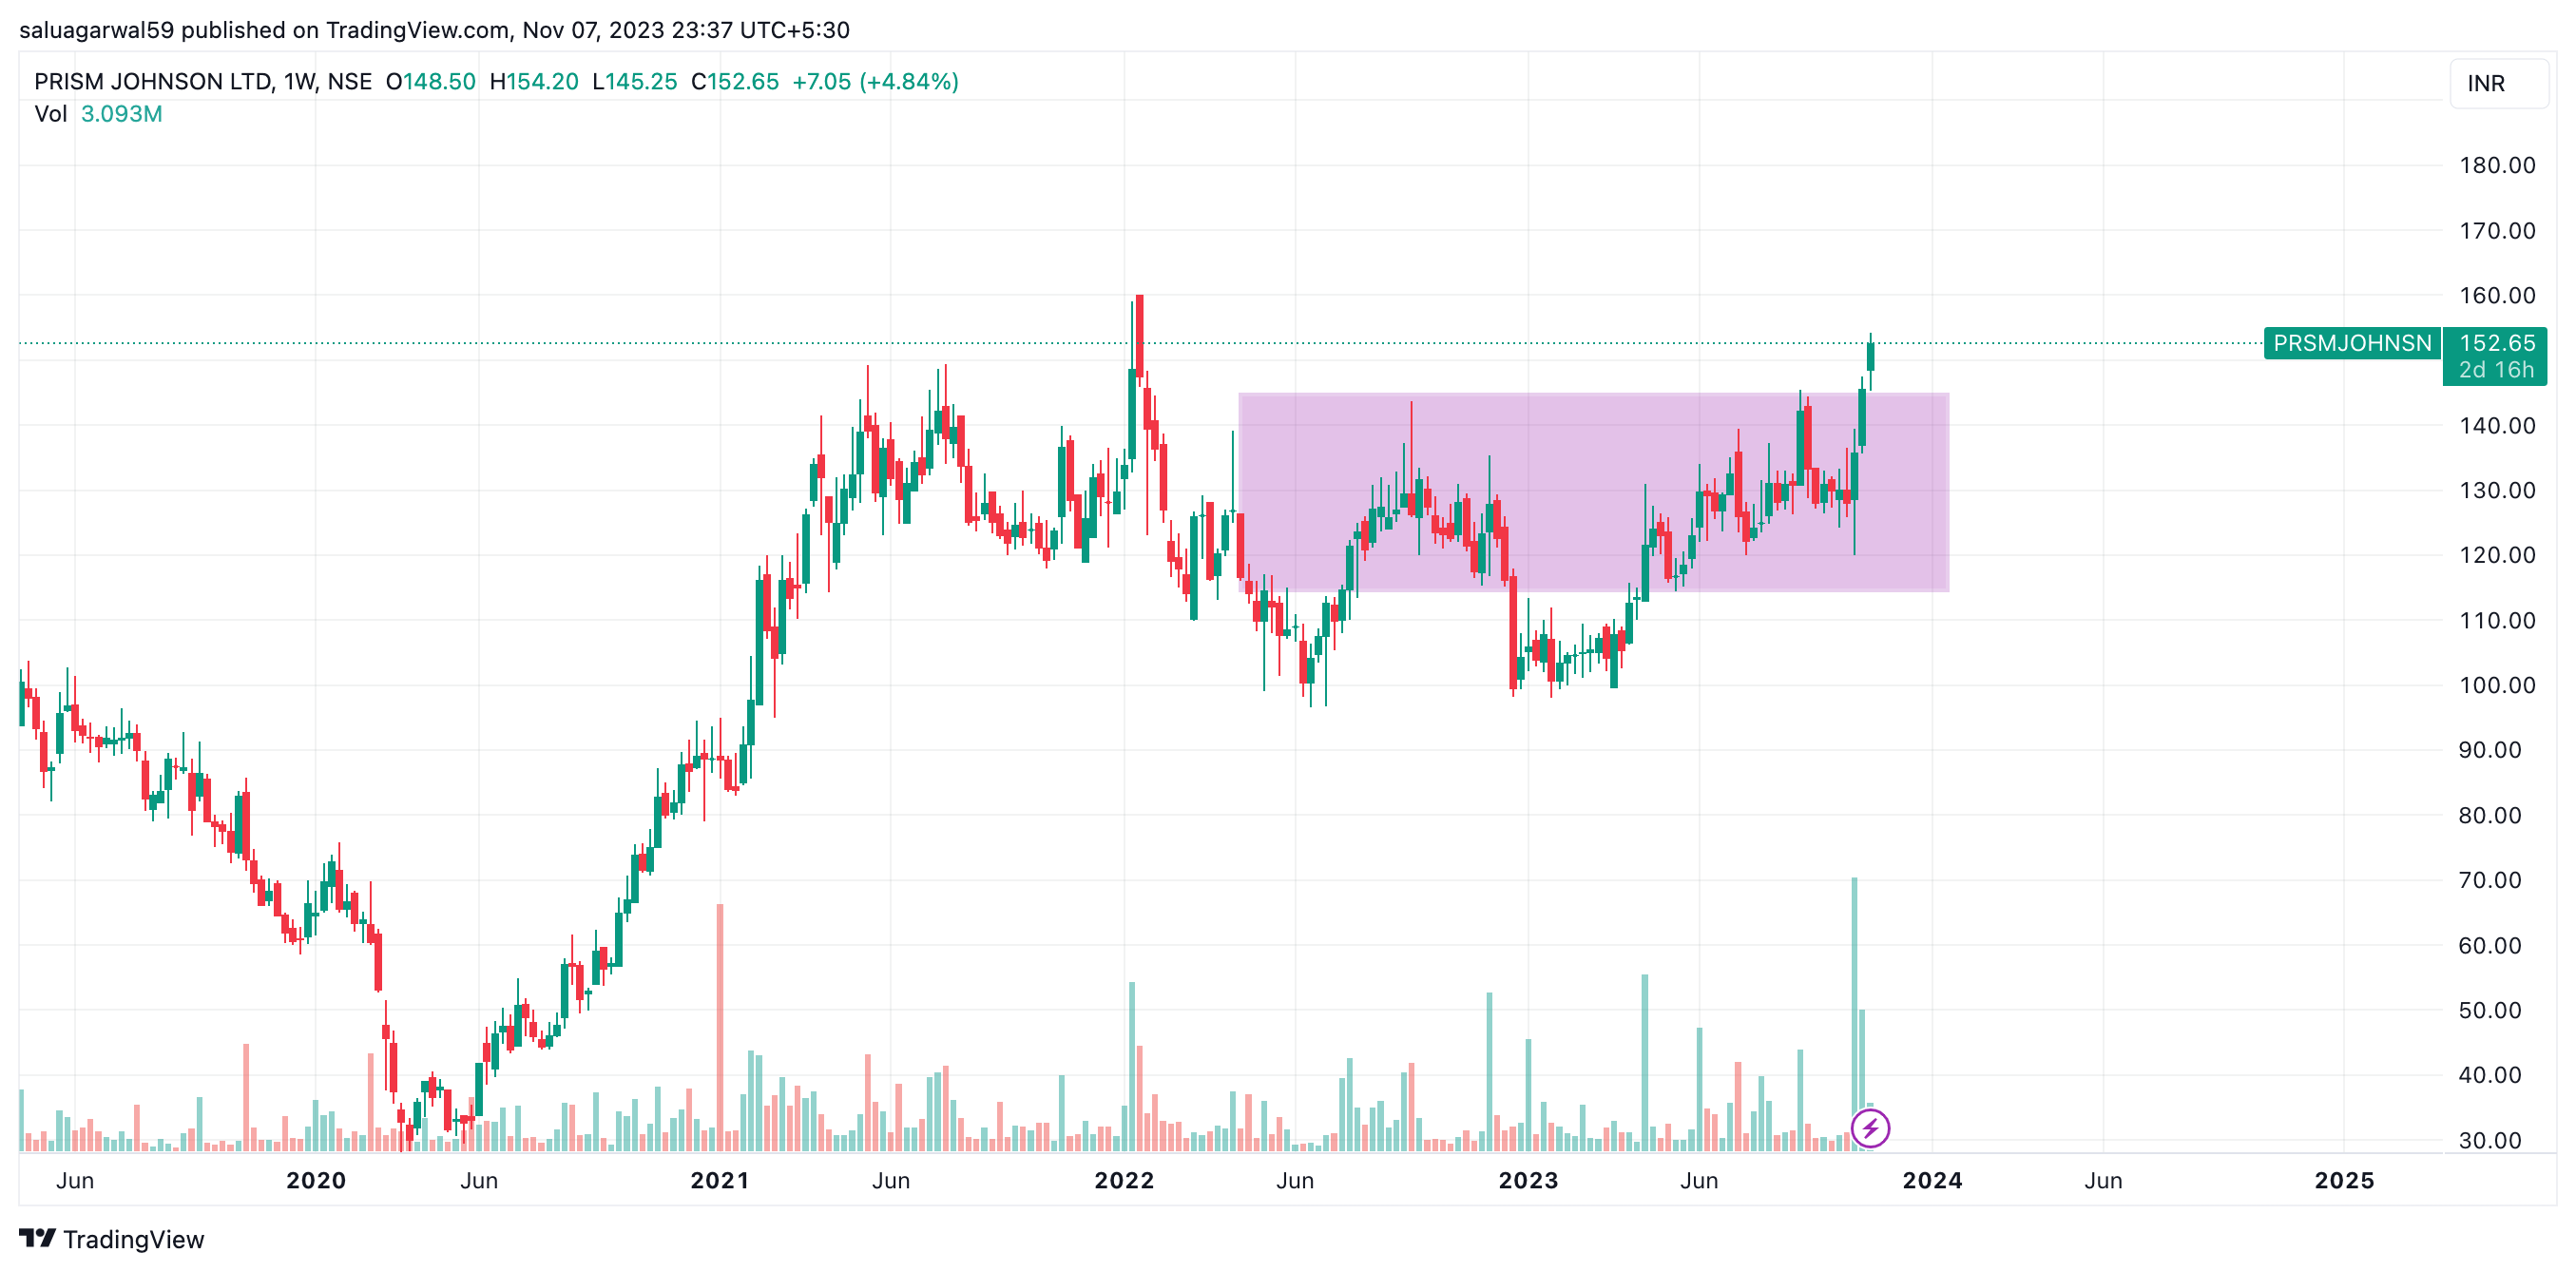
prism johnson ltd
looks good on chart
52 week high brkout with good consolidation.
@hitesh2710 sir you view on this.
1 Like
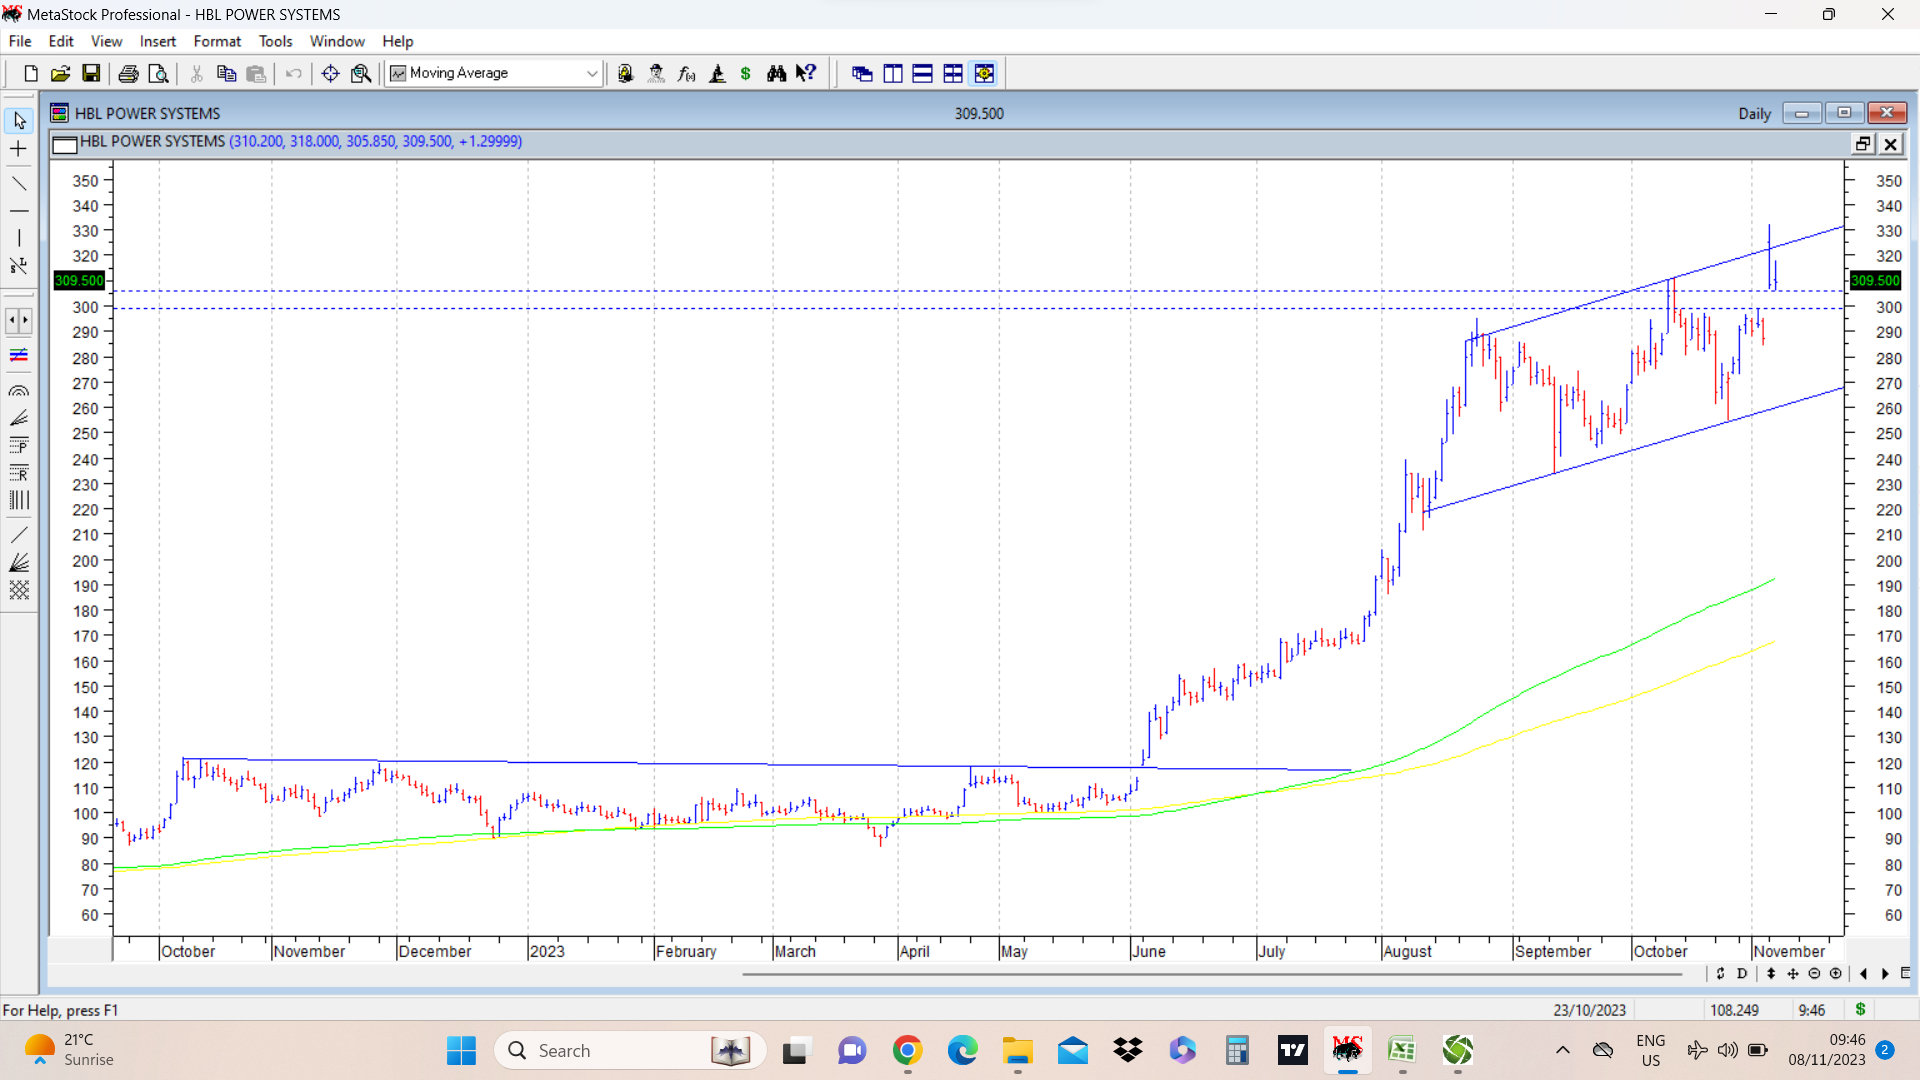
HBL Power came out with very good q2 fy 24 numbers. It has now posted two back to back good quarters. Going ahead, traction should continue with more revenues coming from higher margin segments of railways, defence etc. Half year EPS is 4.35 per share.
On charts, the high of the week prior to the results week was 299 and high of the day prior to results was 295. After results stock price opened with a huge gap up at 325, hit a high of 332 and has been consolidating. Currently it is trying to take support in the gap up area above 299. On the charts we can see an upward sloping channel from where stock price faced resistance. Gap up area is marked in dotted lines.
disc: invested.
29 Likes
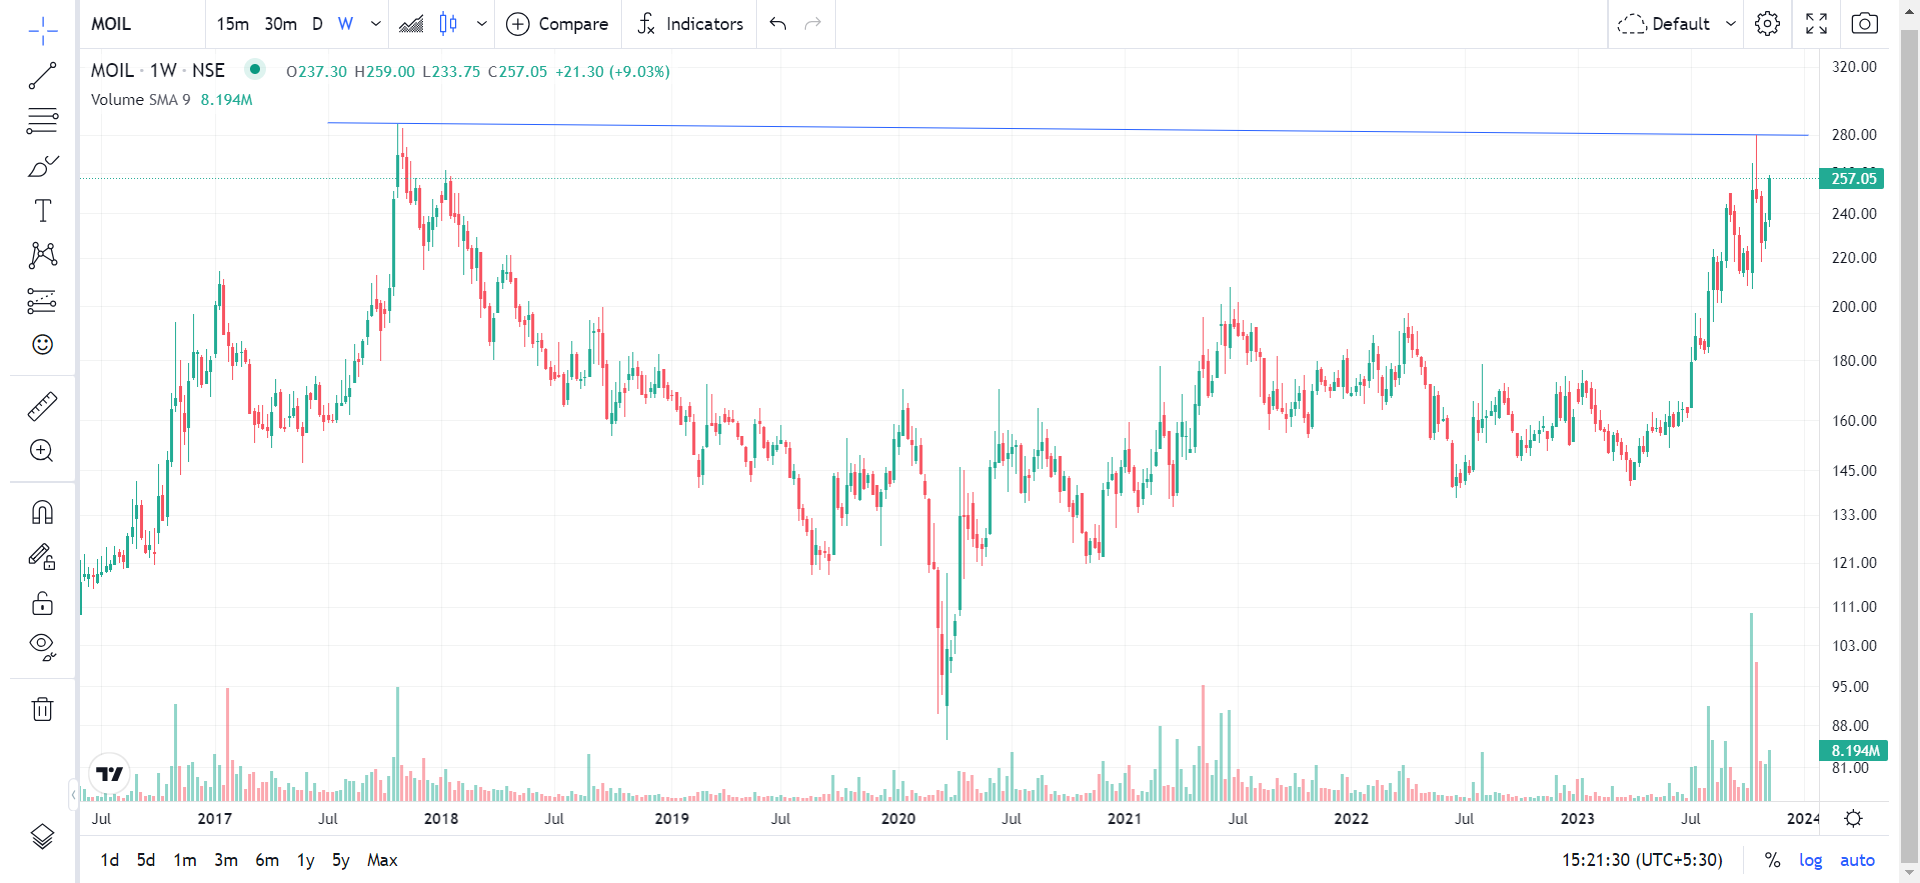
MOIL Ltd - CMP 259
Fundamentally, MOIL Ltd is a PSU Mini ratna company and has more than 50% of the total manganese ore reserves In India. Company is cash rich. MOIL has three verticals: Manganese Ore Mining, Ferro Alloy & Electrolytic Manganese Dioxide. MOIL derives 90% of its profits from Manganese Ore Mining. Its major consumers are alloy and streel manufacturers.
Today they have come up with good set of numbers YOY PBT has jumped more than 120% (61.52 vs 27.34 crs). As per the last presentation the company has come up with a growth plan to increase the production gradually from 13.02 in FY 23 lakh tonnes to 35 lakh tonnes by FY 30.
They planning to explore out of leasehold areas and venture into MP, Gujrat, Chhattisgarh, Karnataka, Jharkhand, Andhra Pradesh, Goa, West Bengal and Rajasthan. Recently they have signed an MoU (in form of JV) with GMDC to explore the possibility of manganese ore mining in Gujarat, which has a Resources base of 9.51 million tonnes of manganese ore established.
Technically the chart has formed a rounding bottom in form of a saucer. Its previous high was 286 rs on Oct 17, 2017 and recently the Stock price hit a high of 280 rs on Oct 17, 2023 and is consolidating since a month and the stock price has shown strength today after results. It has to be seen how the stock price behaves once it is able to cross previous high of 286 which it created in 2017. Life time high comes to 295 which was back on 01 Dec 2010 during the IPO(after bonus adjustment.)
Disclosure : Invested as a technofunda bet. (not a recommendation, anyone contemplating investing needs to do their own diligence).
3 Likes
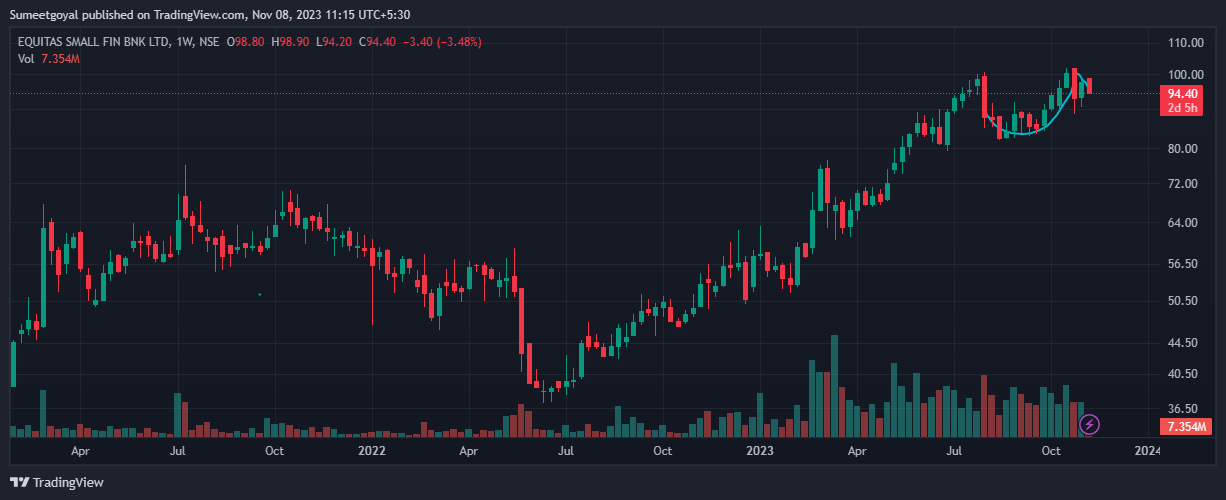
A cup and handle formation is clearly visible, if volume also starts drying up during completion of handle formation, we may see sharp upside in the stock. Result of the stock is impressive too!! Fingers crossed.
Valuable inputs suggested please.
Invested.
3 Likes
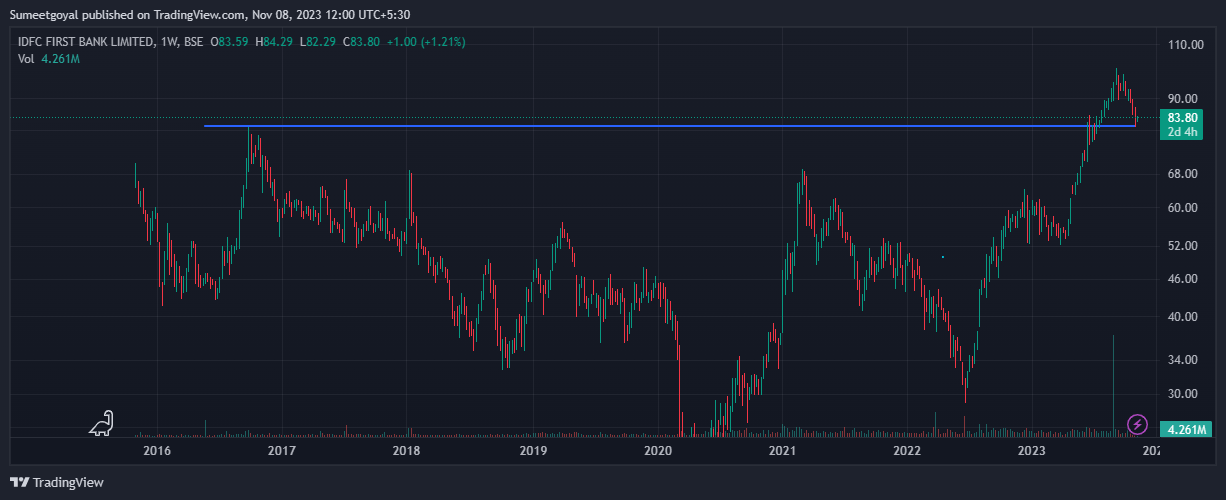
The long term weekly chart of IDFC First Bank. In sep 2016 the stock made its new high at 81.20 and this the week the stock tested the same level and making the reverse move taking the support of that previous high.
Backed by good quarterly numbers.
Invested
4 Likes
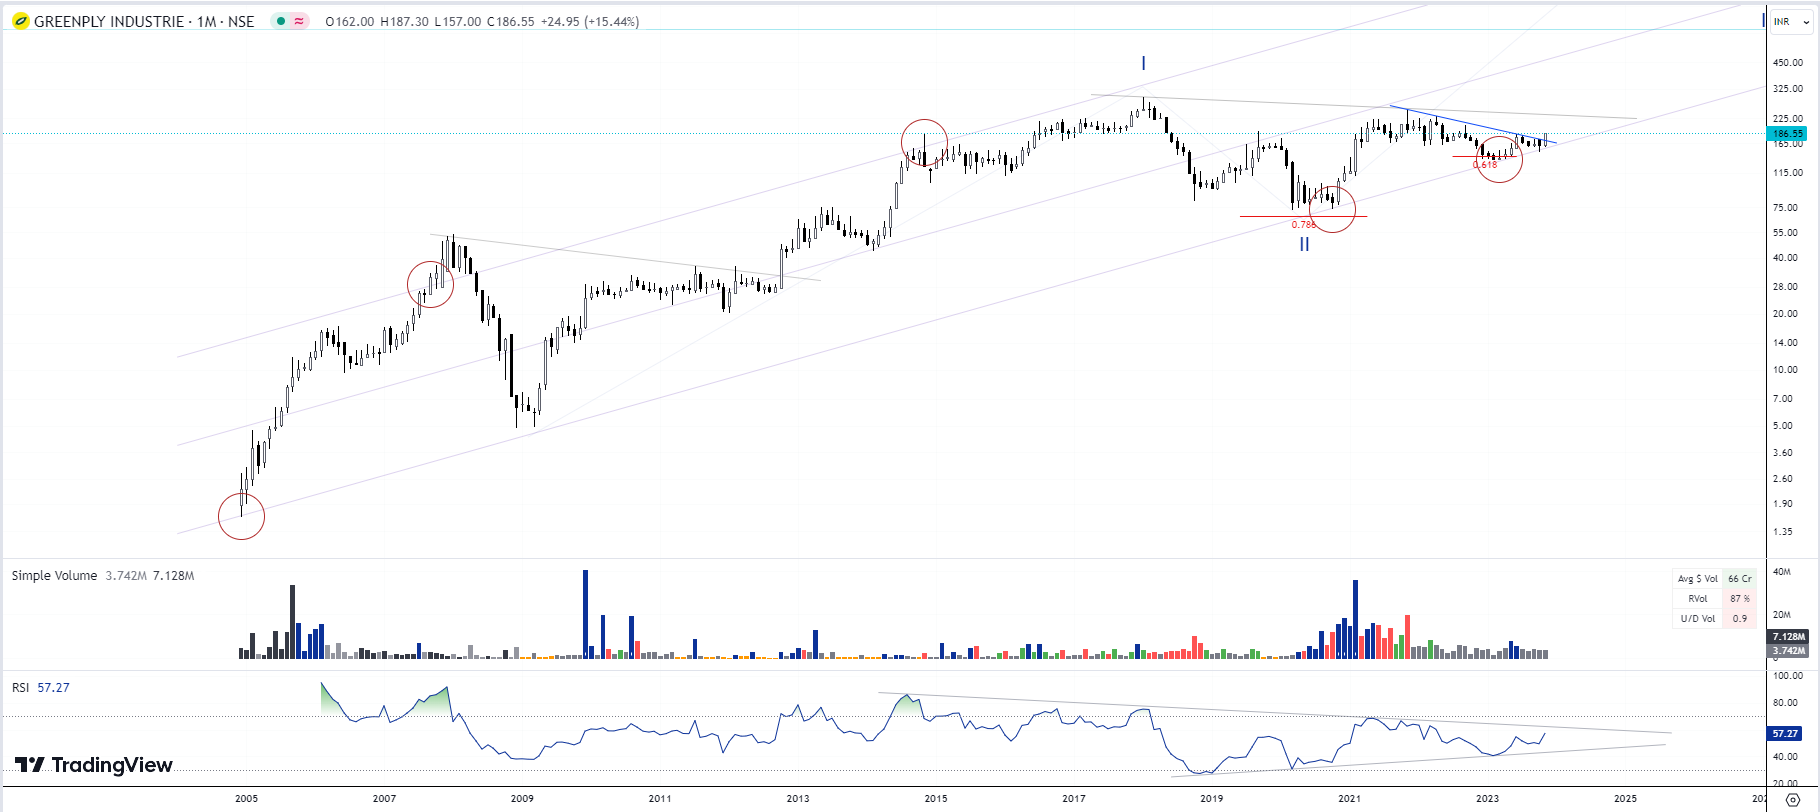
GREENPLY INDUSTRIES - Monthly Chart: (CMP 186; Currently trading at Nov2014 levels)
- A smaller slant breakout can be seen, volumes have risen in weekly chart, with increasing deliveries.
- A Multi year channel being respected
- RSI heading towards a breakout
- Previous Slant breakout in 2012 led to a bull run in the stock.
- Similarity in setups from 2007-12 and currently from 2018 Jan top to 2023
Safe to assume bullish bias ahead, with bigger slant breakout leading to large up moves.
4 Likes
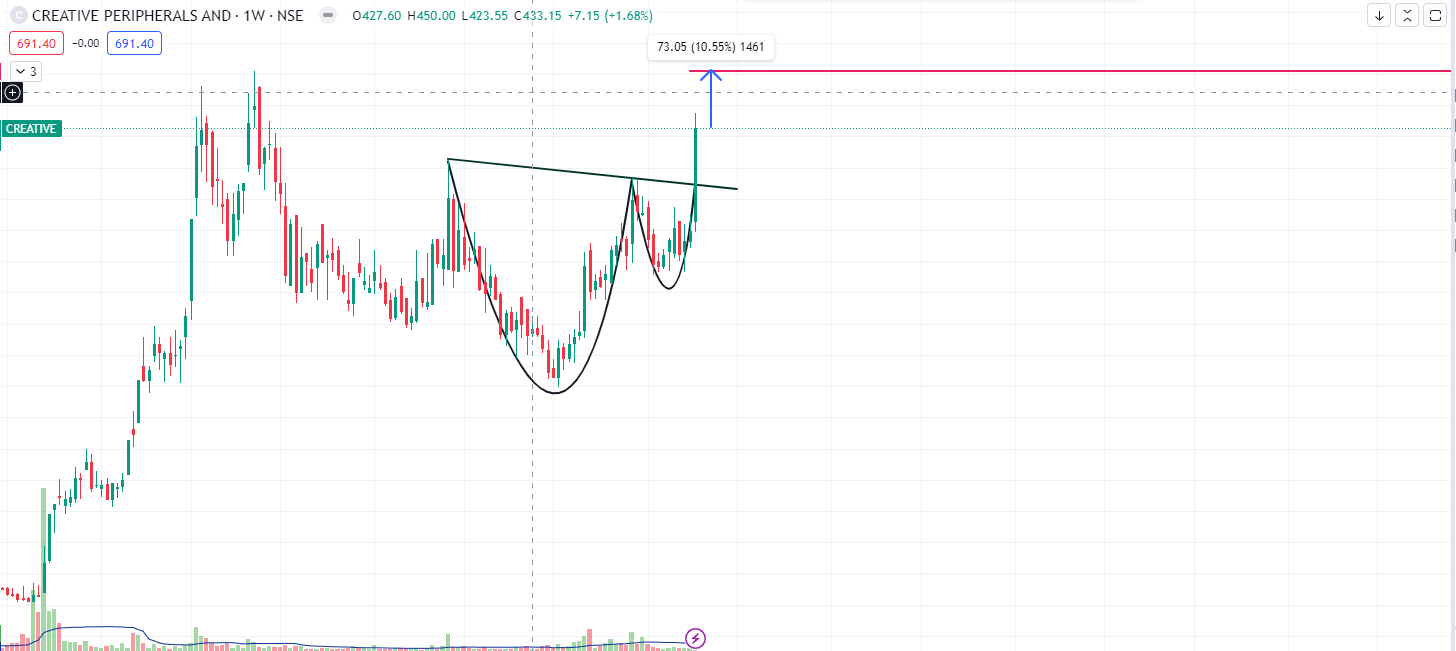
Creative Newtech Ltd (Formerly known as Creative Peripherals and Distribution Limited) has broken out of a VCP pattern on a weekly basis with high volumes. The Company posted strong quarterly results YOY. The current price is 10% away from its previous high which was made in Mar-22.
Disclosure: Not invested. Just studying charts and patterns.
1 Like