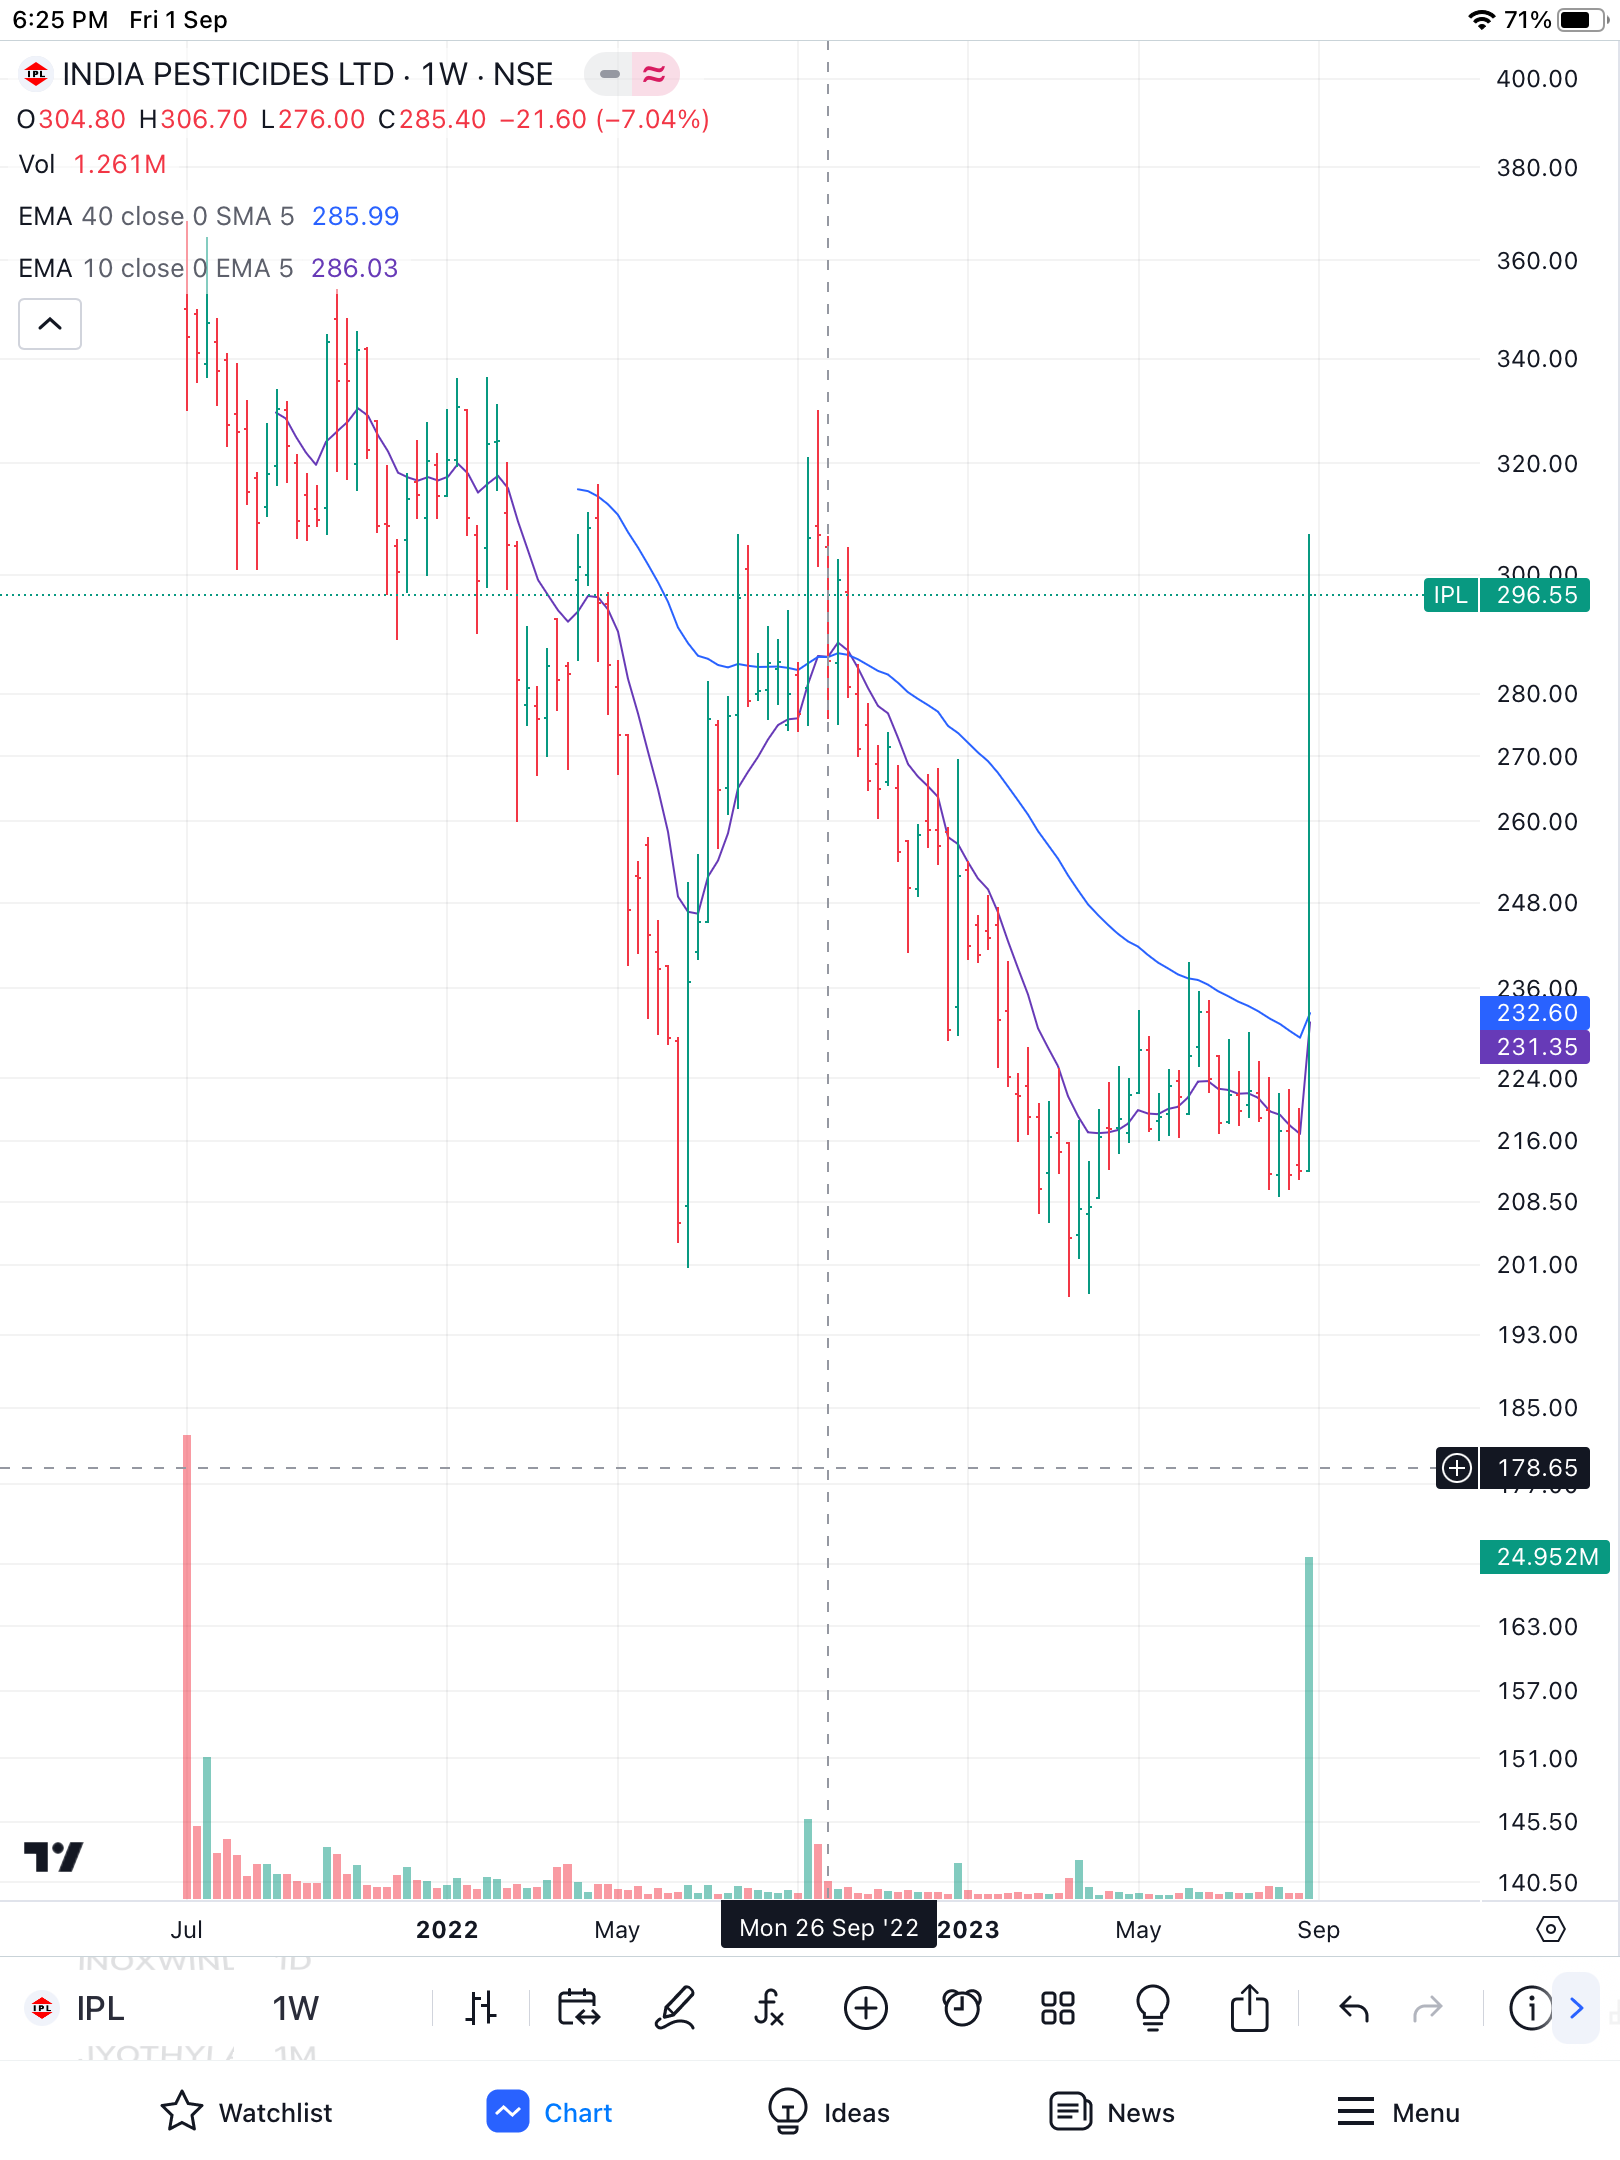
@hitesh2710 India pesticides Ltd (IPL) was in downtrend since it’s listing July 21. Volume and volatility also gradually started contracting and were lower since January 23. In this week IPL went above its 40 and 10 week moving average with huge volume and made new 10 month high. How do read such chart specially considering huge huge volume. Fundamental wise also it seems a reasonable.
2 Likes
Confidence petroleum chart shows 2 solid technical patterns here. One is breakout from a long, multiyear triangular channel, with good volumes. Second is breakout from cup and handle pattern in a shorter time frame.
3 Likes
@hitesh2710 Sir, How should we look at high volumes during break out but with very low delivery volumes. Many a times it has been observed that volumes are artificially inflated by contra buy sell trade by same entities which some times also appear in bulk trades. As soon as there is positive movement in share prices lot of intraday traders jump in and some also enter for 2 to 3 days. Intraday trades increases the volume substantially. Just wanted to understand your thought process and the underlying things at a fundamental level to appreciate the concept of volumes.
7 Likes
I don’t analyse delivery volumes in the usual short to medium term technical pattern analysis. But as a general rule, I avoid stocks which gap up or down too frequently, or those where corporate governance is blatantly negative, or stocks which are highly volatile.
You will find a lot of details on volume analysis in technical analysis textbooks, and you can read those chapters. But for someone like me who looks at nearly 30-50 or sometimes more charts in a single seating, I want to keep things simple, I like to look at parameters that I can put up on a chart in a single location ( I don’t want to go looking around for delivery volumes on nse site of other sites where it is available) and then I can base my analysis on these chart readings.
20 Likes
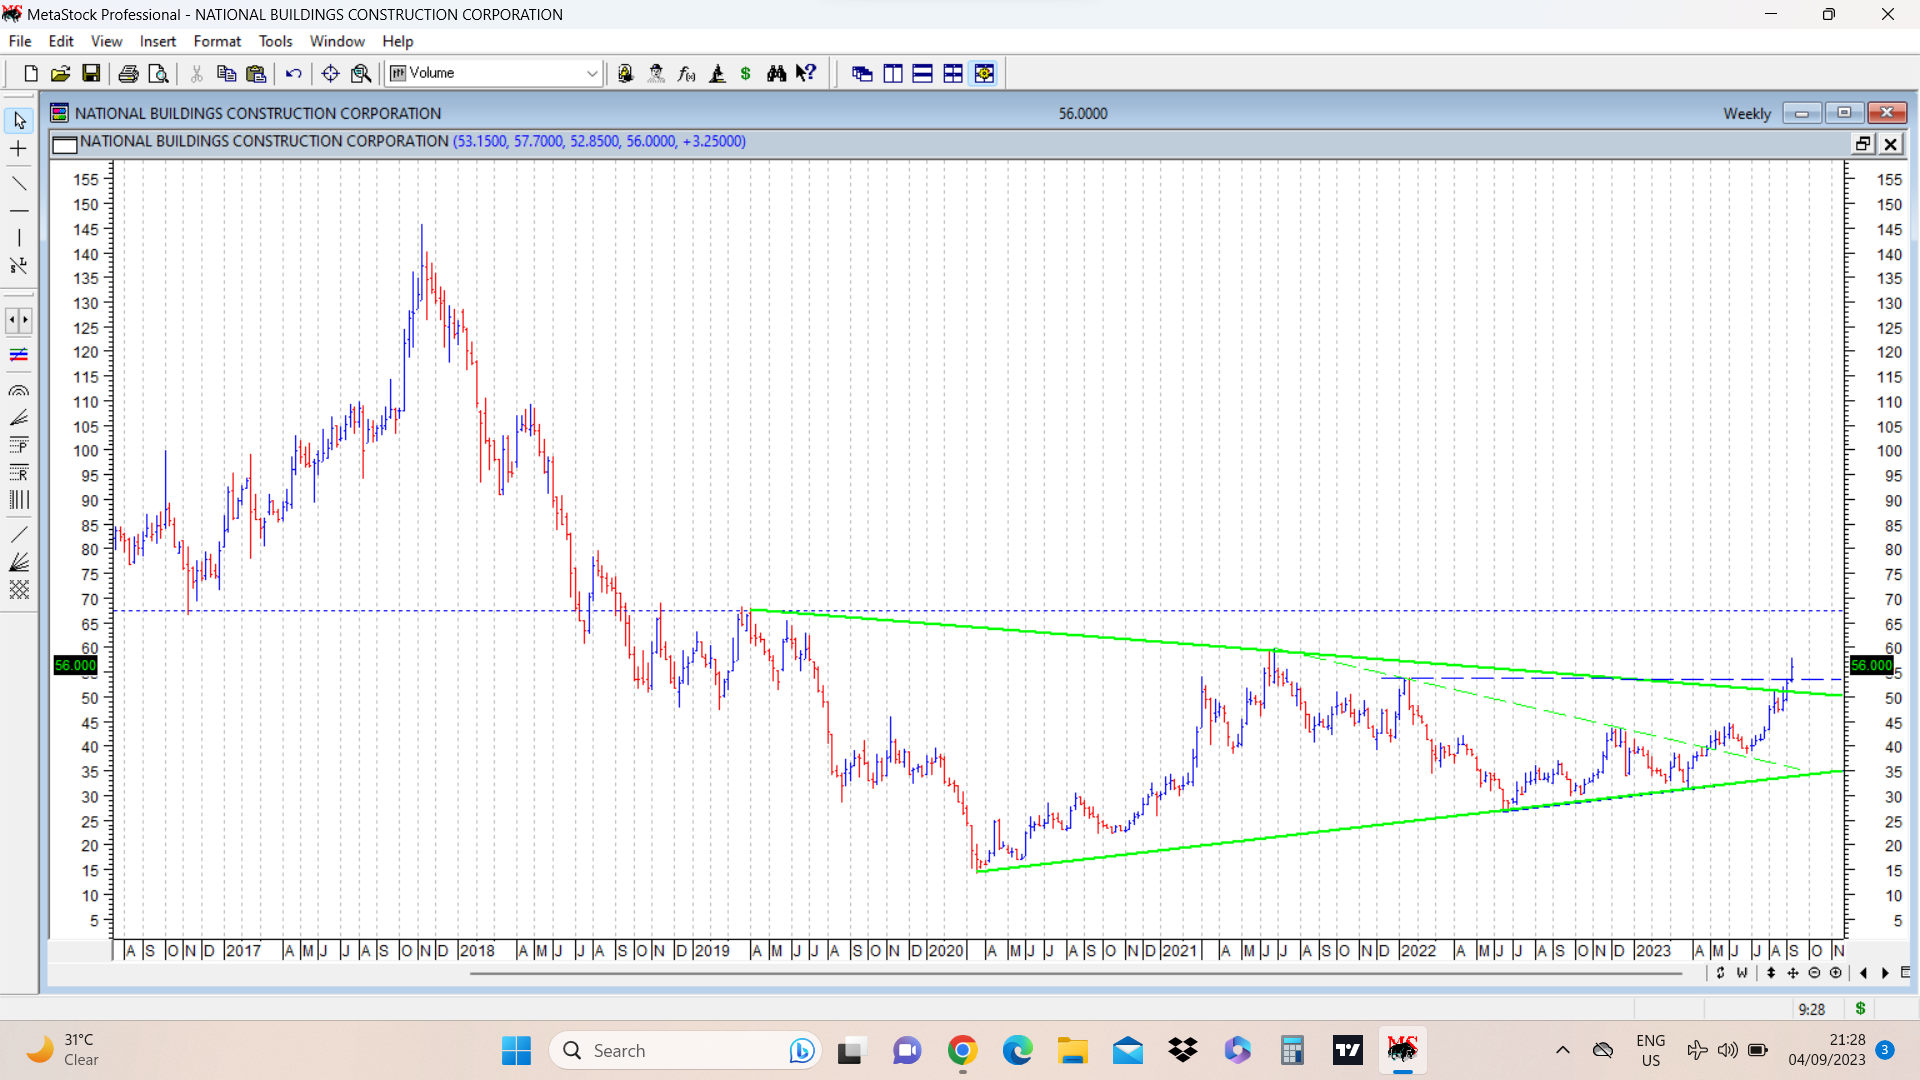
NBCC today made a fresh breakout from its consolidation and crossed a 52 week high level of 53, closing close to 56. Attached chart shows a triangle within a triangle pattern. Solid green lines show the larger symmetrical triangle and a dotted green line represents a smaller triangle wtihin it. Dotted blue line is a 52 week high line near 53. Next destination/resistance can be 68 (dotted blue line) which would be a 5 year high level.
disc: invested. It’s very interesting to see patterns different from the routine cup and handles, inverted head and shoulders, or others like 52 week high or multi year highs. Here its triangles.
28 Likes
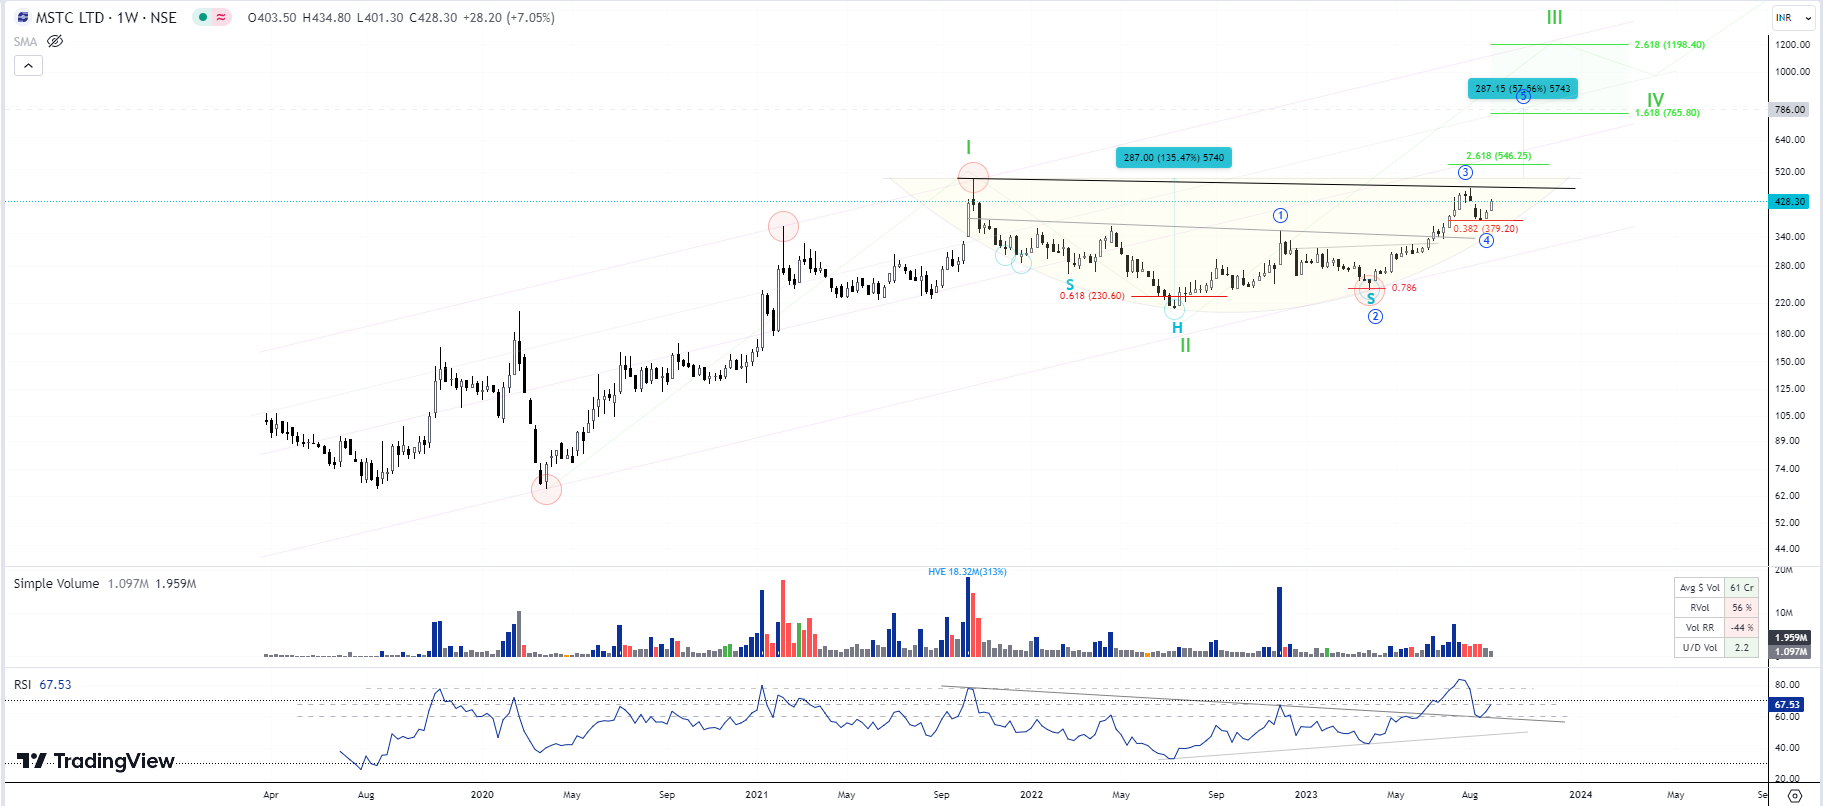
Update on MSTC:
- A nice Cup n Handle formation in progress, fall on low vols and taken support at Fibo 0.382 levels.
- RSI has also retested its breakout
Safe to assume bullish bias ahead.
7 Likes
Lakshmi Machine Works
Stock made ATH last week and formed the classic cup and handle pattern and with above average volumes on the breakout day
Technically it looks good and I don’t know about its fundamentals
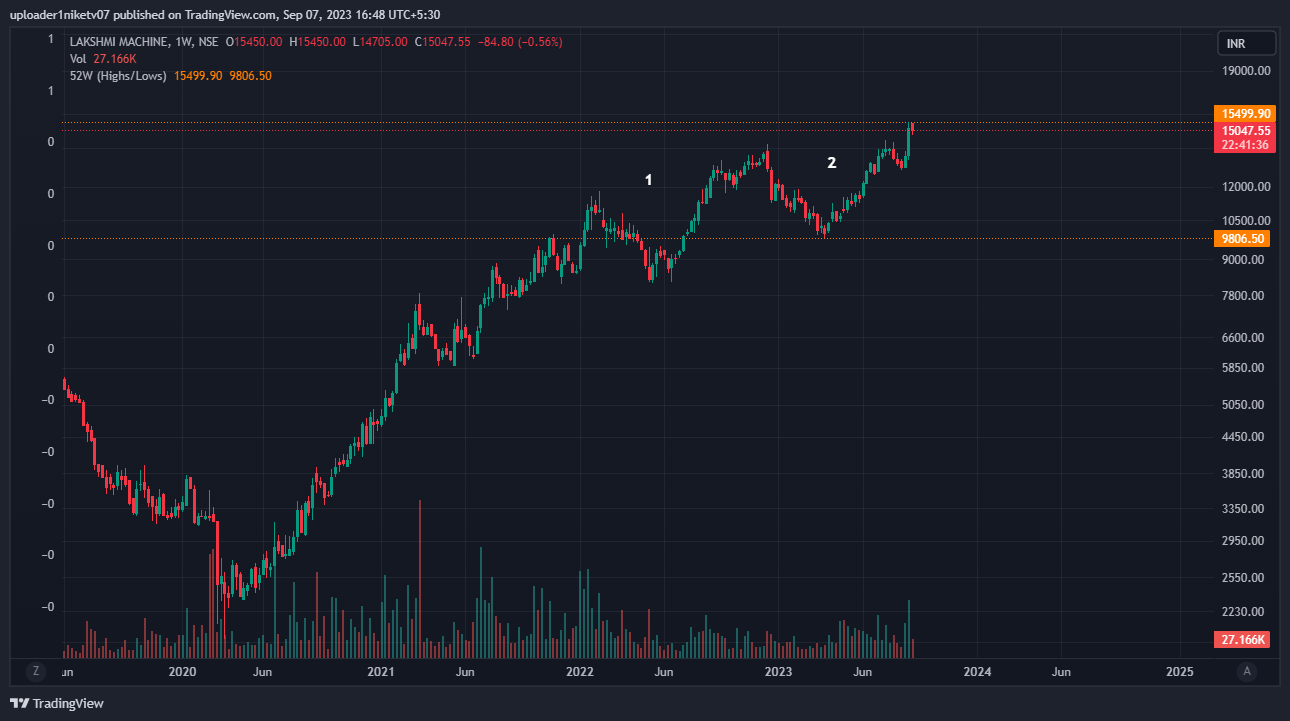
@hitesh2710 Sir , in my view both 1 and 2 marked in charts are cup and handle pattern although 1 is without handle and a failed one too
It is said that in stock market history repeats itself so seeing its history can we assume there is a probability of this one failing too .
Also when you invest on the basis of these pattern how much return on average do you expect from such trades
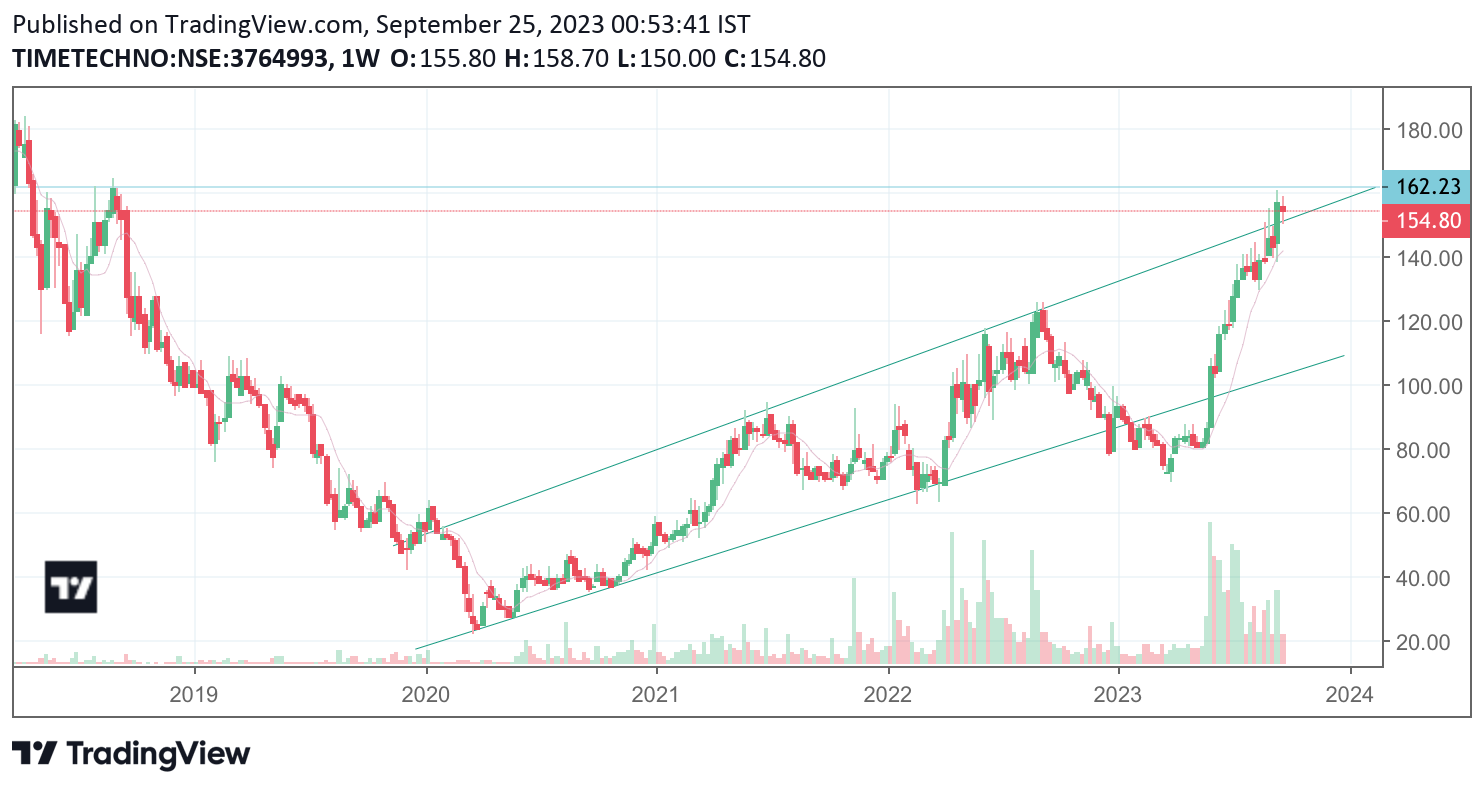
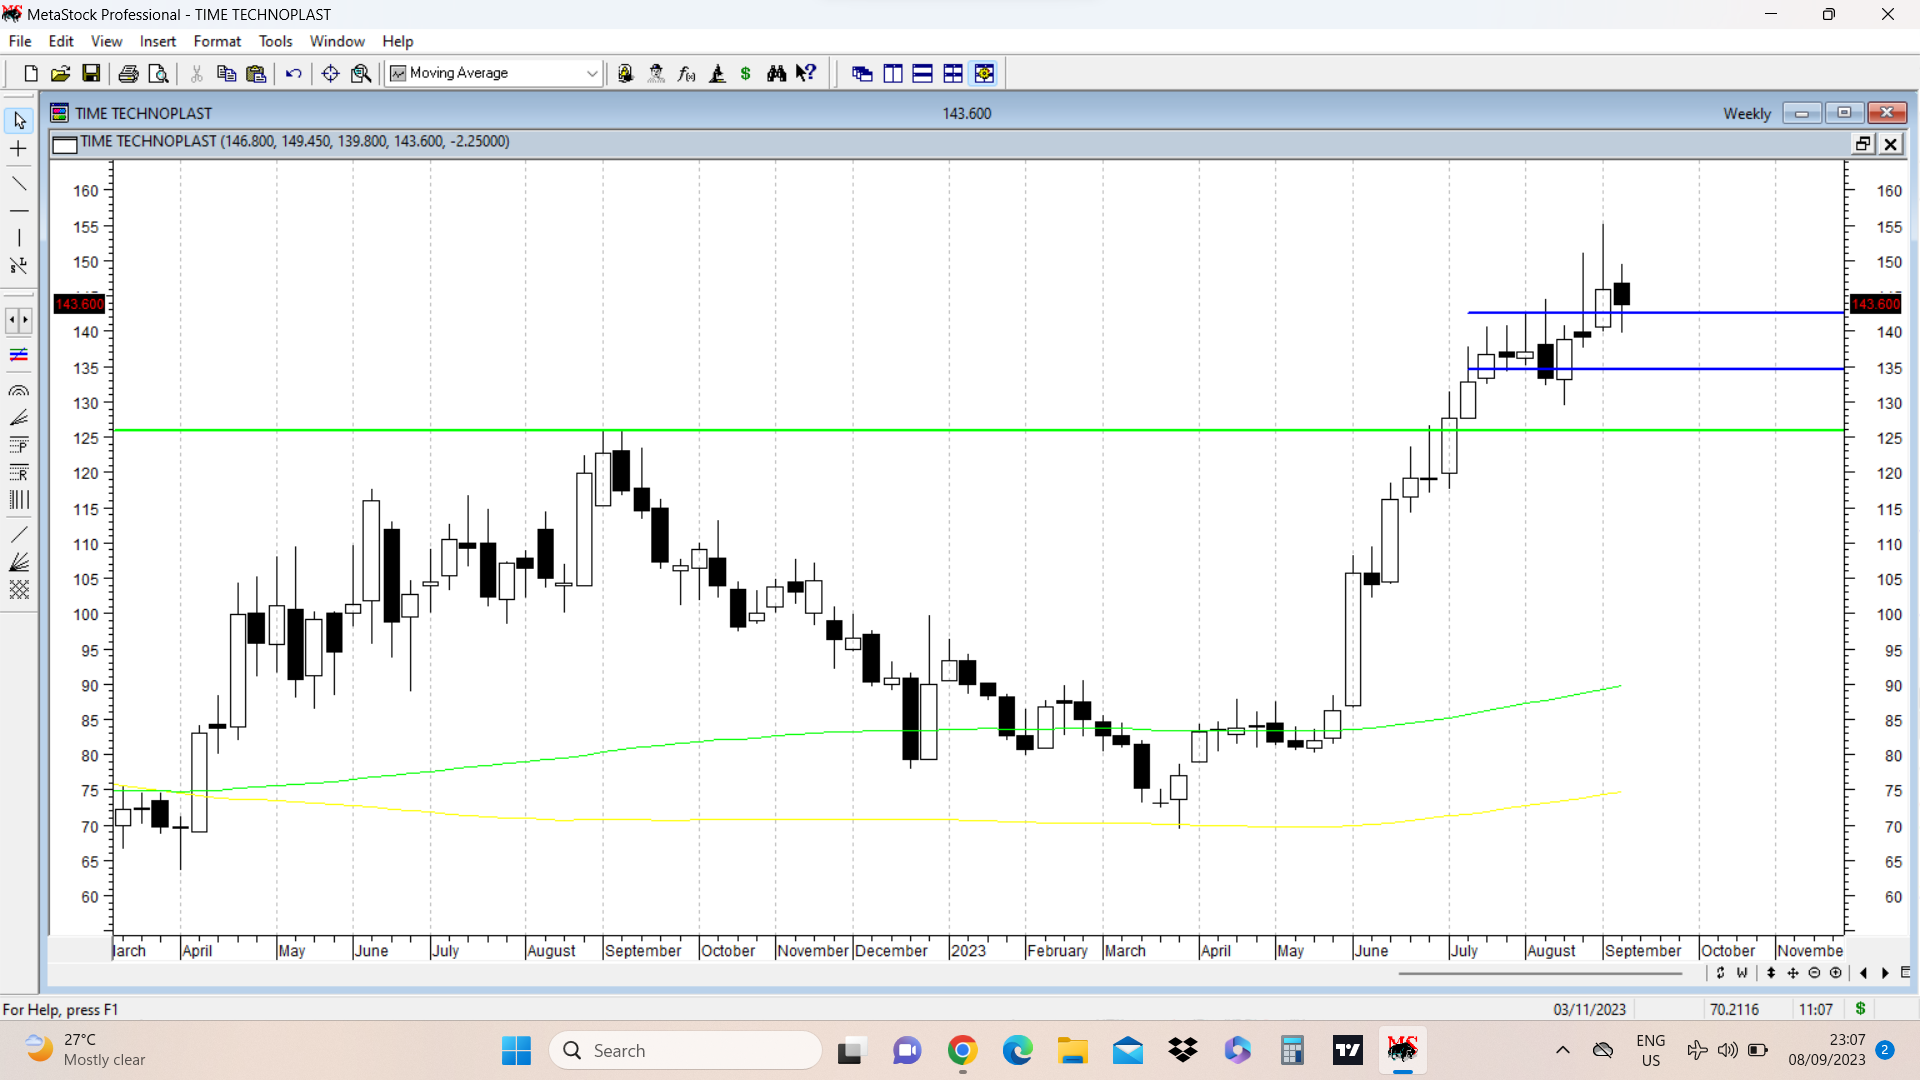
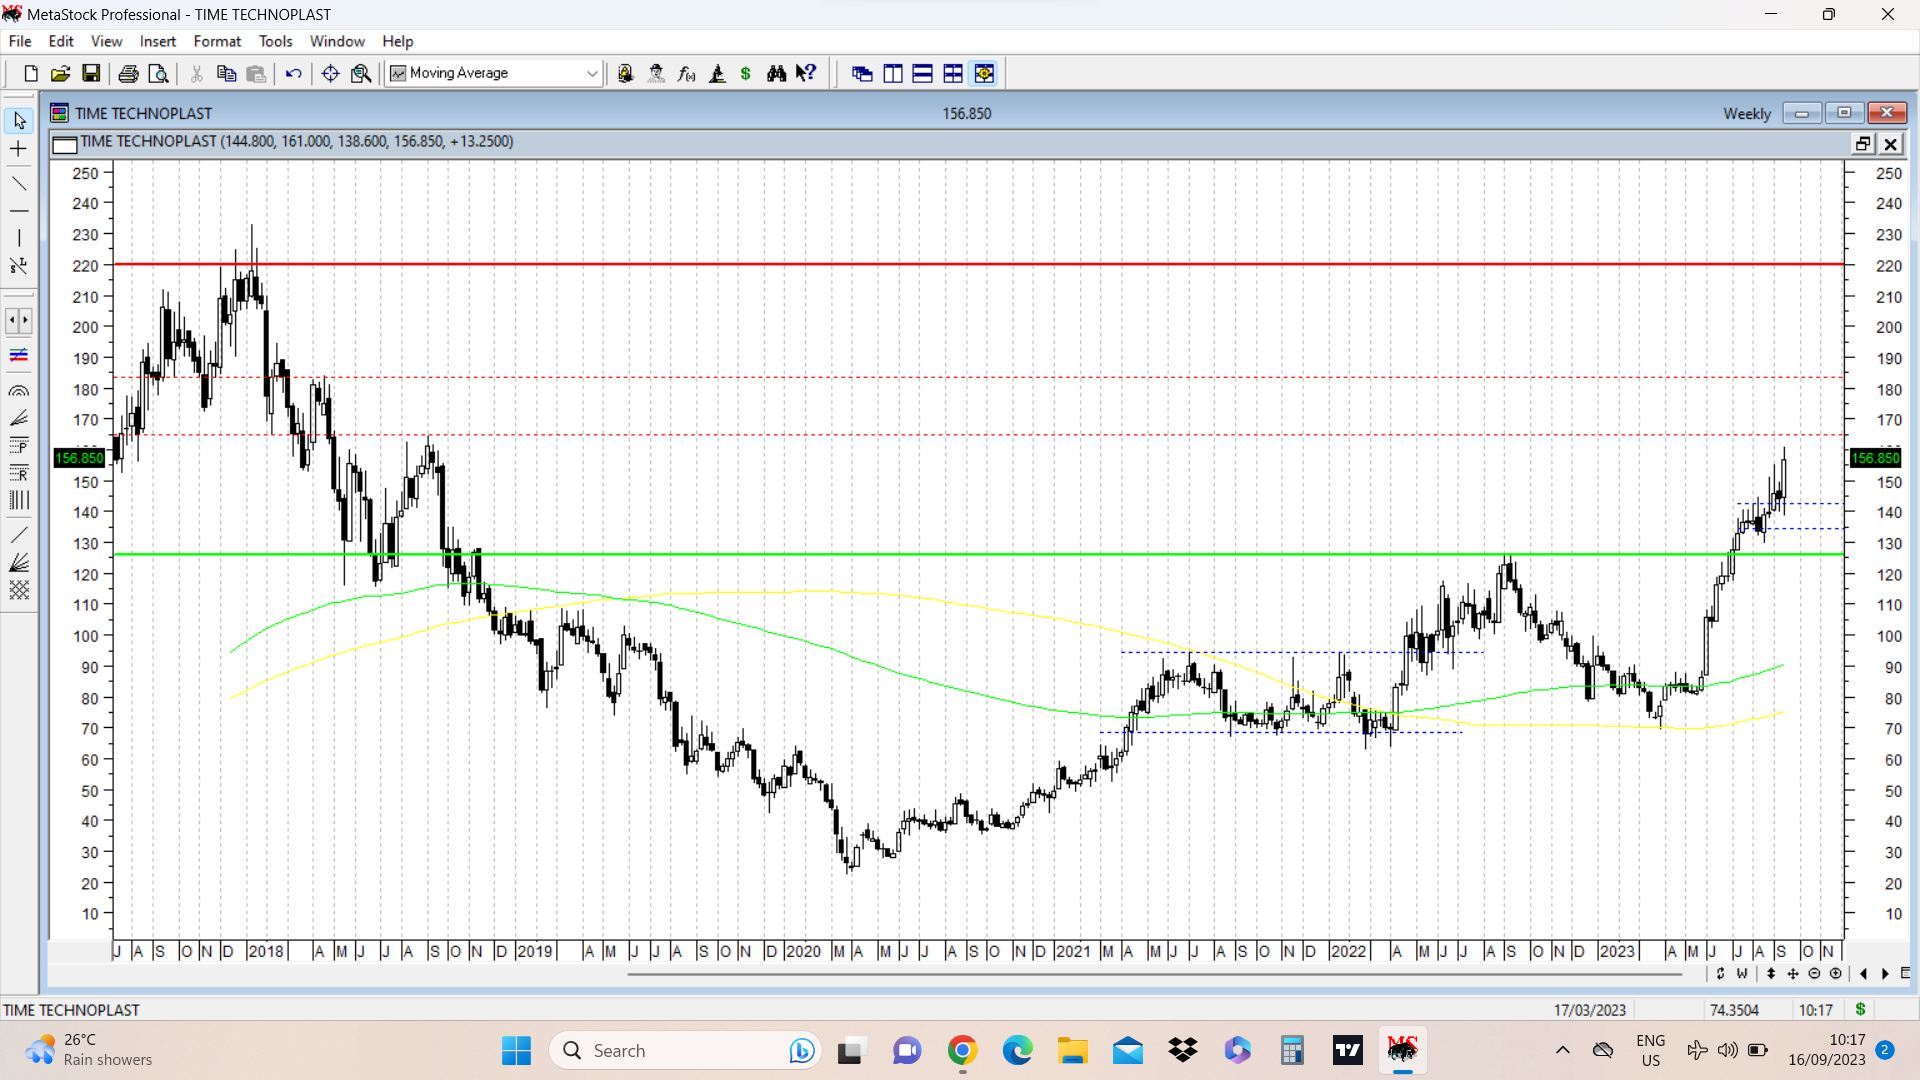
Time techno weekly update. As per last update, there was an attempt at a move above the short term trading range, but stock price last week closed marginally higher at 145, with a bigger upper wick at 155, indicating supply at that level. In current week ending 8 September, we have a spinning top like candlestick which again signifies indecision. All said and done, we have had nearly 7 weeks of consolidation in the stock, with the fight at higher end of the range. Previous resistance at 140 range now offering support on declines, but we need to see how it holds going forward. I mentioned in my portfolio thread also that in current rallies in most stocks, there have been a lot of retests before major upmoves materialise. It seems to be the case here too. disc: holding.
10 Likes
In the chart you put up, I can see a cup and handle pattern marked 2. But the pattern marked 1 does not hold characteristics of a cup and handle. Even the structure of cup is not the typical saucer shaped, rather its more a V kind of shaped structure.
What I usually do in any chart pattern I like is to have a brief idea about the fundamentals of the company in question. For that there are lots of resources like annual reports, presentations, concalls, and the relevant thread on VP.
7 Likes
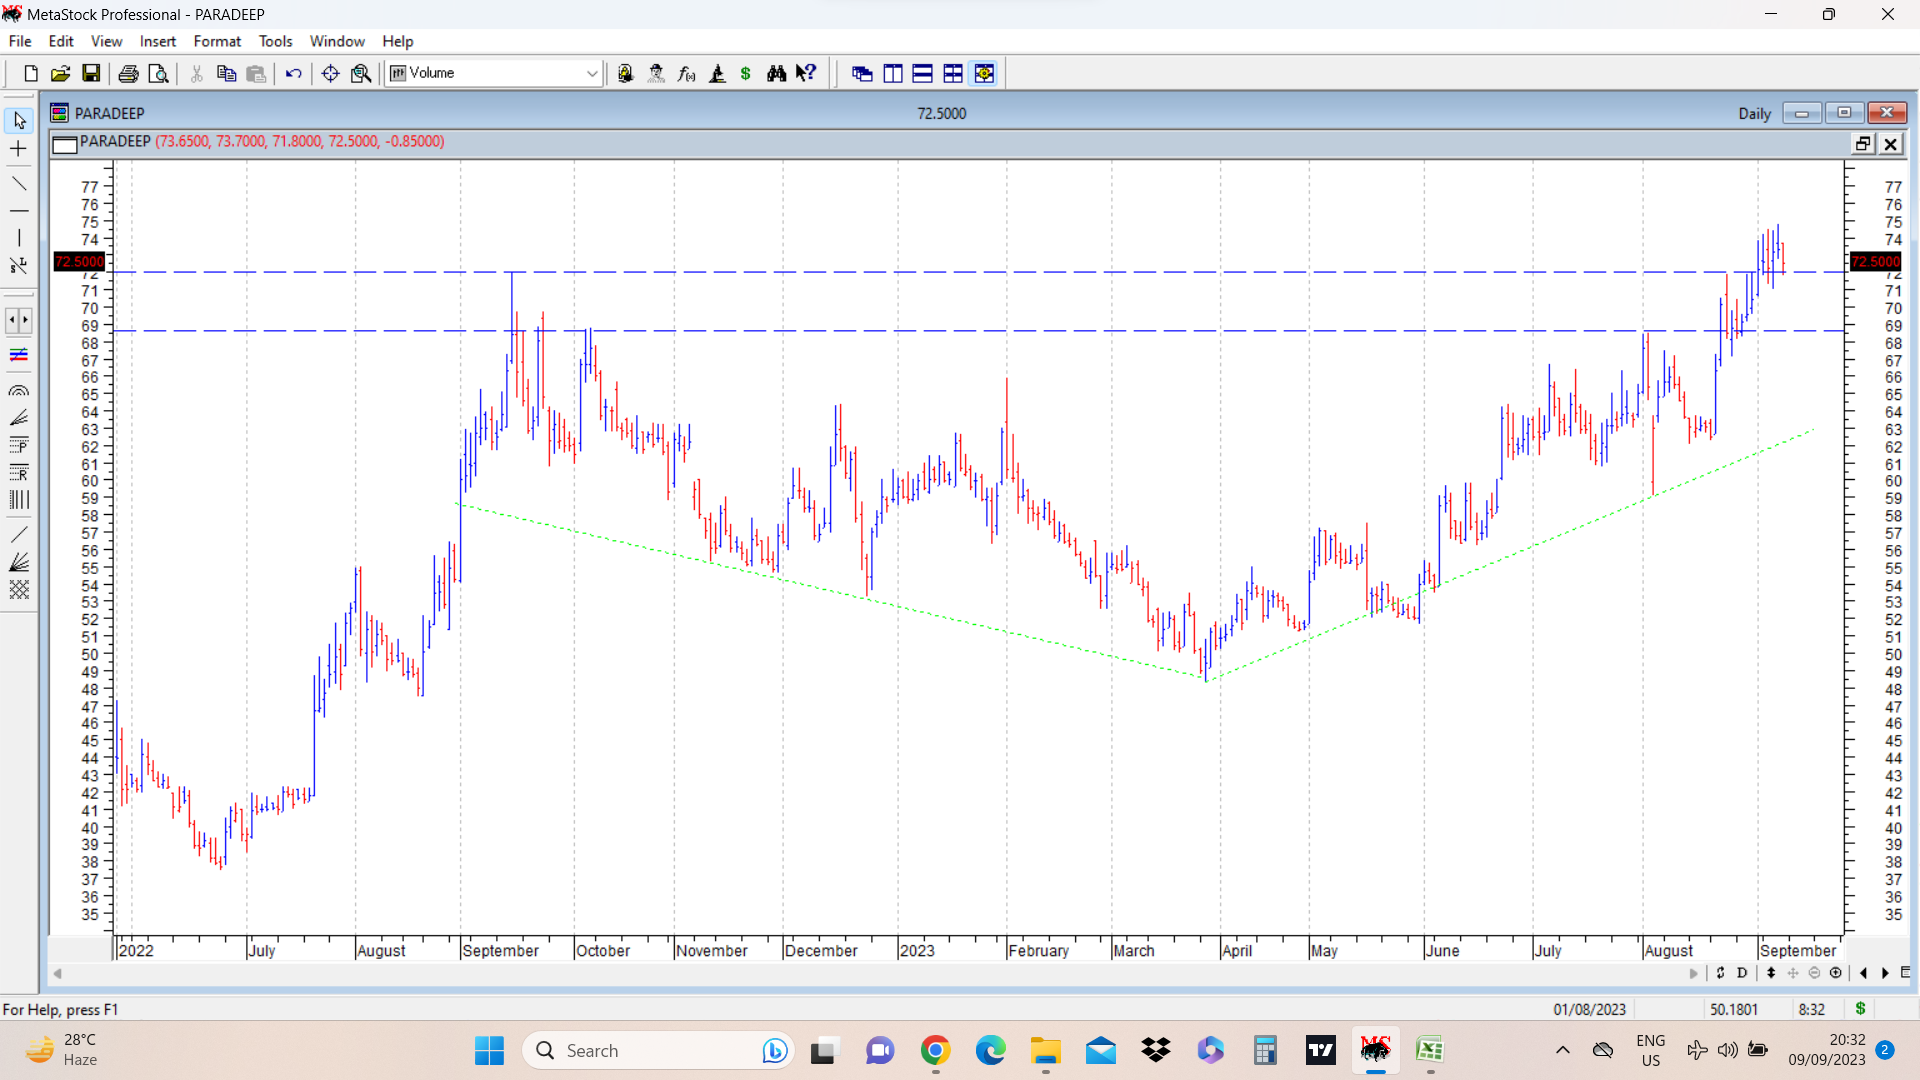
Paradeep Phosphates (cmp 72) is a fertiliser company which had its IPO in May 2022. IPO price was 42. Post listing at close to IPO price, stock price went down to 37 and then rallied to post a high of 72 in Sep 2022, and then corrected 61.8% or its previous rally, to post a bottom at 49 and again started rallying.
As visible from the chart put up, the stock price crossed its previous peak of 72 recently and has been consolidating at and around those levels. Two important resistances at 69 and 72 are marked on charts and stock price has managed to stay near or above these levels.
The structure of the move from Sep 22 to Sep 23 is a rounding bottom. A lot of fertiliser stocks have shown some strength in recent past.
disc: invested as a technical bet. ( not a recommendation. anyone contemplating investment should do their own diligence. )
17 Likes
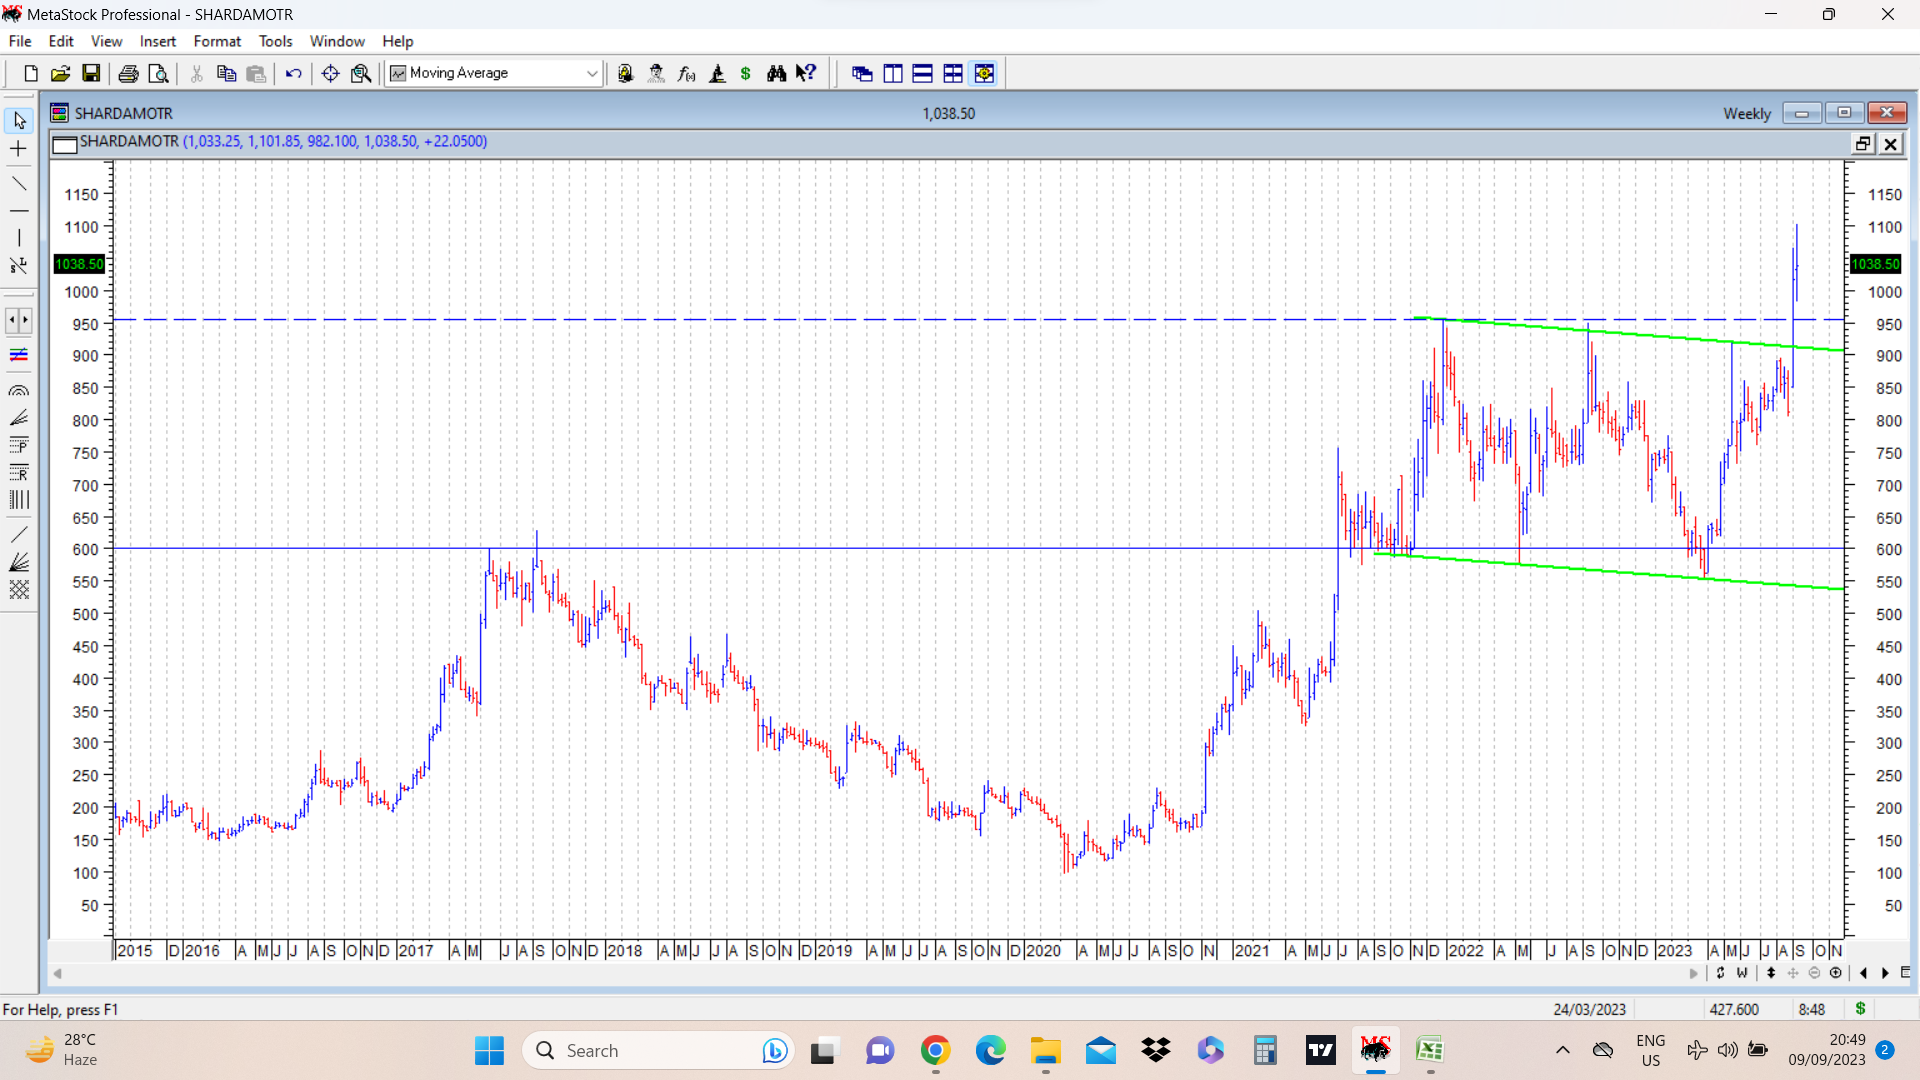
Sharda Motors cmp 1038. Company is an auto ancillary company, with net cash balance sheet and high ROE/ROCE. FY 23 con EPS 70. Company has shown consistent growth in topline and bottomline since 2020.
Stock price crossed its previous all time high of 600 (posted in 2017) in July 2021 and went on to hit a swing high of 954 in Dec 2021. Since then it had been consolidating between 600-900 and in Sep 2023 crossed its previous all time high of 954 and hit a fresh swing high of 1100.
The consolidation from July 2021 to July 2023 is in the form of a flag pattern (marked in green) , with flagpole extending from 170 to 950 and breakout point being 900. Pattern target if the pattern plays out can be in excess of 1600. (weekly chart attached)
Fundamentally company is claiming to have strong tailwinds going ahead due to change in emission norms (TREM V AND TREM VI, AND RDE) affecting the tractors, CV and other off the road vehicles. One can study the company by going through annual reports, concalls and presentations. Most of the details are discussed in concall.
One of the reasons for relatively ( in context of overall sector and market) cheap valuations inspite of stock price being at all time high ( 15 PE for a debt free company with consistent good growth) could be the concerns regarding terminal value assigned to a business which largely caters to ICE vehicles.
disc: invested as a techno funda bet. (not a recommendation. anyone contemplating investing should do their own diligence and research)
26 Likes
Hi Hitesh bhai,
Actually i too am confused between pattern 1 and pattern 2 as to how its different. Could you pls elaborate ?
I think you need to read a few books on technical analysis to get a grip on these patterns. And the other query on my portfolio thread regarding dead cat bounce and actual reversal.
I would suggest following books
1.How to make money in stocks by WIlliam O neil.
2. Secrets to profiting in bull and bear markets - Stan Weinstein… Stage investing book.
3. Minervini books.
4. Technical analysis of stock trends by Edward and Macgee.
Once these books are read, basic concepts will be clear and you will have a better understanding of these patterns and trends.
33 Likes
Sir, are there any differences between patterns that you have observed with regular bullish setups, and 52 week or ATH setups. A particular setup or a pattern that happens only in the intervals of a rise, fall and rise, in between, but not at 52 week high or ATH? Or there is no such distinction and any kind of pattern can form at any highs? Request you to throw some light on it.
In most cases, most patterns can happen anywhere. But there are some patterns labelled as bottoming/reversal formation and others labelled as continuation patterns.
Reversal patterns include double bottom, bottom triangle/wedge, rounding bottom, inverse head and shoulders pattern etc… These usually happen near bottom and are not commonly seen near 52 W highs or multi year highs.
Continuation patterns are flags, pennants, cup and handle, etc. These are often seen near 52 W highs and multi year highs. These offer time correction in a stock’s upward journey. Once this time correction is over, upmove resumes.
A common pattern I often see ( not always but quite frequently ) in stocks clearing 52 weeks high/multi year highs is symmetrical triangle. Triangles are very tricky structures, but provide powerful base for a strong breakout. Symmetrical triangle is an example of contraction ( also known as contracting triangle) where prices contract with lower and lower volumes before a breakout happens with huge volumes. I feel its a variant of the VCP desribed by Minervini. I think we have discussed such triangular consolidations in Usha Martin and HBL in this thread. Sometimes there can be more than one triangular pattern on top of each other, or more than one rectangular consolidation on top of each other… This is a variant of base on top of a base described by William O Neil.
33 Likes
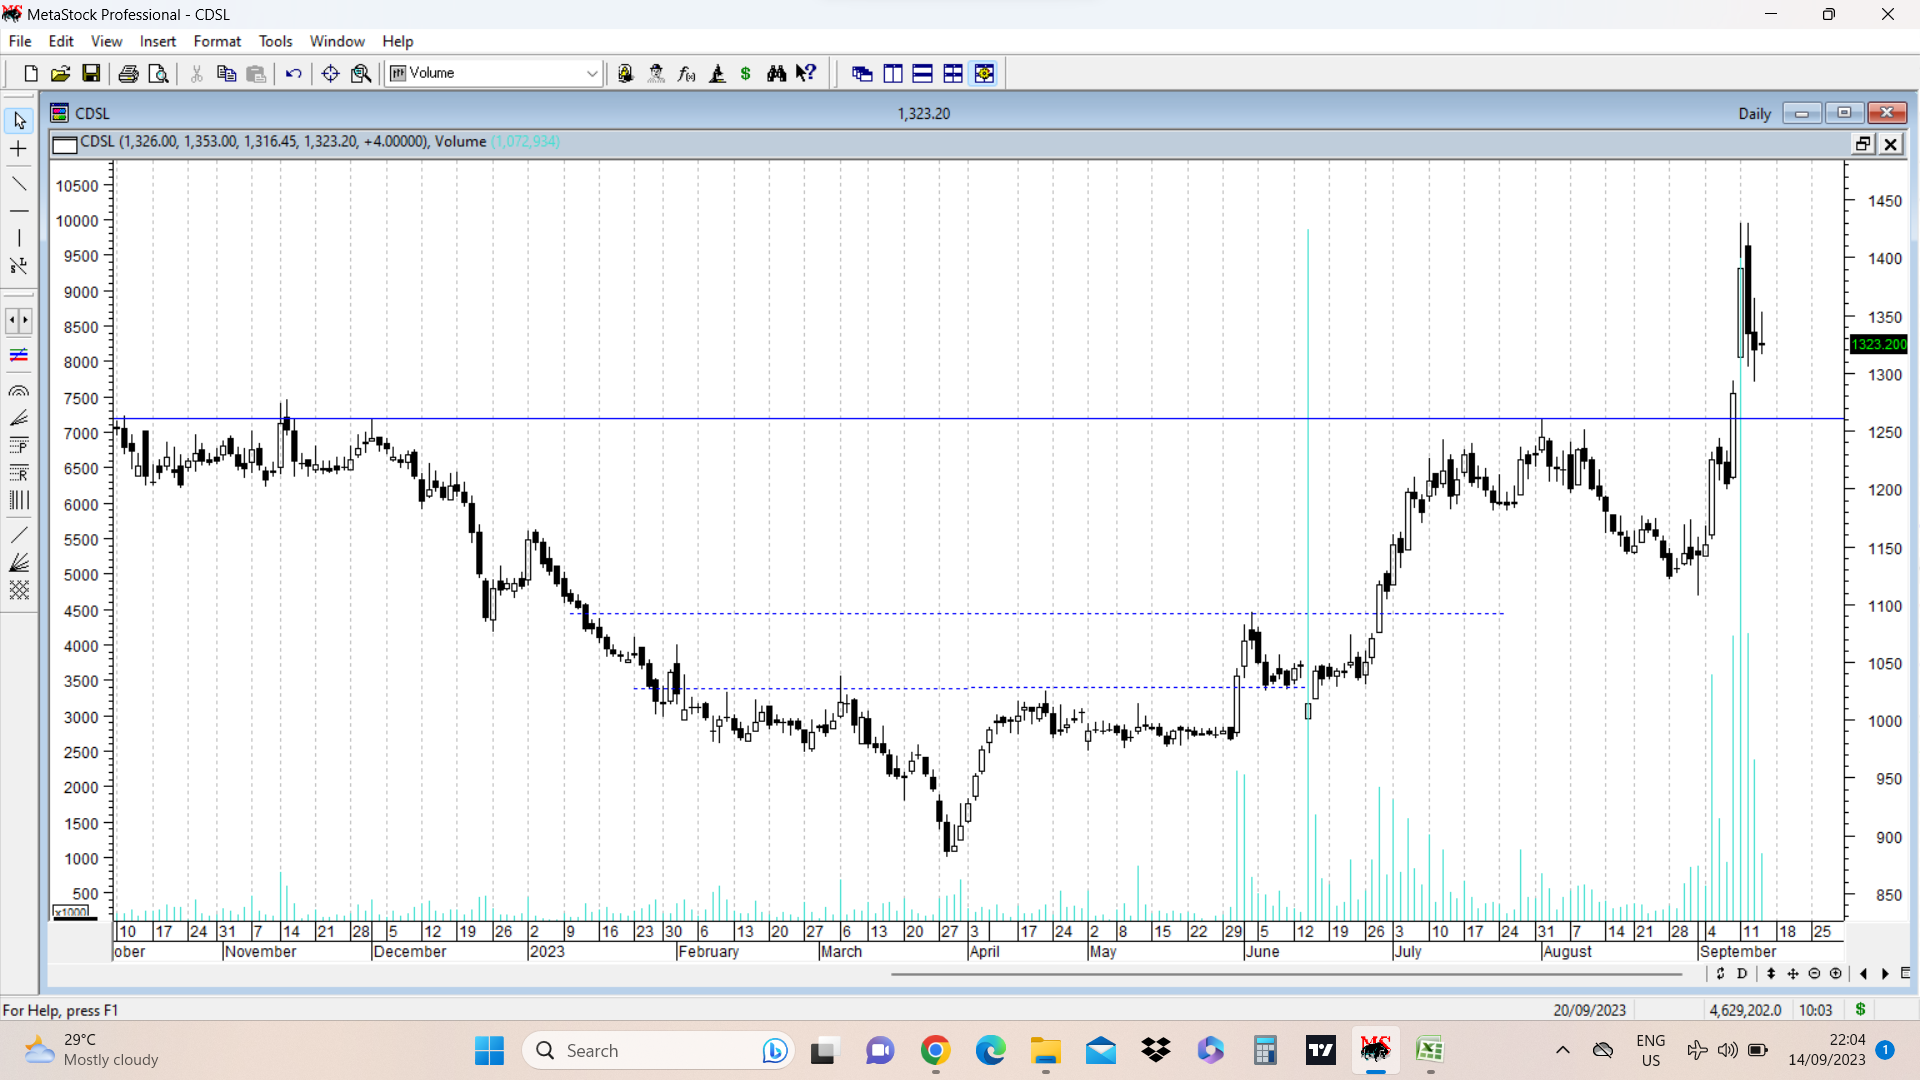
CDSL cmp 1322. Stock price broke out of a daily cup and handle pattern above 1260, marked in solid blue line. The breakout happened with a big bull candle with high volumes. Next day stock price gapped up between 1291 - 1308, and hit a swing high of 1430, before correcting along with the brief midcap and small cap sharp correction. It went down, retested the gap area, and reversed from there. It now seems to be stabilising above the breakout zone and gap up zone.
Note smaller breakouts in dotted blue lines, which could have provided early entry points for someone closely tracking the stock and its chart.
On daily chart, on candlesticks, stock price has formed a candlestick pattern called homing pigeon, which often signals reversal. Today the volumes have also fallen drastically as compared to preceding few trading sessions. Next couple of days should provide an idea on whether this candlestick pattern plays out or not.
The pattern target of cup and handle ( if pattern plays out ) breakout are close to 1600.
disc: invested as a technical bet. ( not a recommendation , anyone contemplating any buy/sell should do their own diligence. )
31 Likes
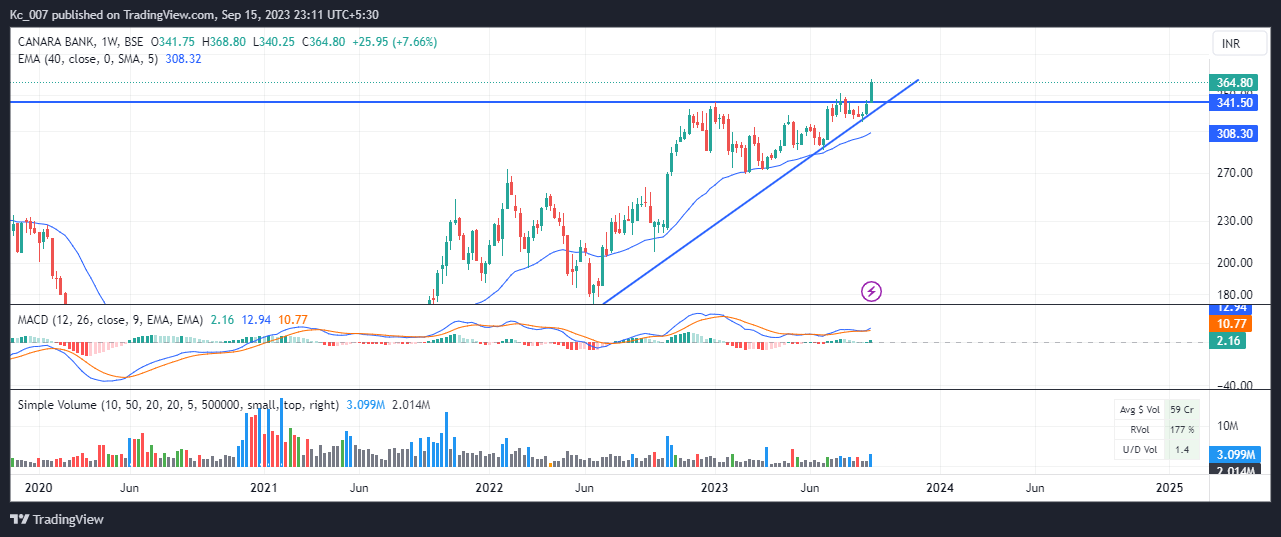
The stock price of Canara bank is above 40EMA and have making higher high with an upward trend.I believe that one should take entry if it passes Rs365-370 levels with good volumes. If not then 308 would be a crucial price to take an exit. Hitesh Sir your view please and also please suggest on how i can improve my skills (through indicators/observation/books)?
P.S : I am an investor using technical tools for entry and exit.
4 Likes
Time techno weekly update.
This week the stock price crossed the important hurdle zone of 140-150 with a big bullish candlestick with good volumes and closed at 156. If it sustains above the above mentioned congestion zone, it can head higher. Potential resistances on the way up marked by dotted red lines at 165, 185. Major resistance at 220, which also happens to be a technical target of the cup and handle pattern breakout above 125, whose neckline is marked in solid green lines. Zones of minor and major consolidation are marked in dotted blue lines. disc: invested as disclosed before.
28 Likes
Great call. PSU Banks are on steroids since last 2 sessions. It is just beyond my understanding what has so dramatically changed that PSU stocks are showing such upward movement.
In fact, even Dhanalaxmi from banking pack ended the day with good gains despite news of independent director resignation.
5 Likes